


Why Supplier Evaluation Gets Stuck in Excel
At the end of every month, purchasing and quality assurance staff line up the incoming inspection log, the receiving records and the open purchase order list, then pick out defect counts and late deliveries for each supplier by hand to build a score. At Japanese-affiliated plants in Thailand, this scene is still far from rare. In many cases, the weight of this manual work is what prompts a plant to look at a supplier evaluation system.
Yet replacing the spreadsheet with a system does not, by itself, automate the evaluation. In this article, we take the view that supplier evaluation is “an aggregation of records,” and that it cannot be aggregated by machine unless the underlying records have a closing boundary. “Closing boundary” is a term we use in this article for the line that says, “at this point, this record is final and may be used for evaluation.”
For example, should a lot whose incoming inspection decision is still on hold be counted as defective? Is the delivery date the day the goods physically arrived, or the day they were received into the system? When the due date of a purchase order changes partway through, which due date should be used to judge lateness? If each department draws this line differently, the same supplier gets a different score depending on who builds it. When that happens, suppliers who see their results say, “We don’t understand the basis for these numbers,” and the conversation never moves on to improvement.
This article covers a mechanism that aggregates supplier performance from four records (incoming inspection, receiving, open purchase orders (due dates) and supplier corrective action requests (SCAR)), builds a supplier performance scorecard and rank, and uses them to update the approved supplier list (ASL), run re-evaluations, decide order allocation and give feedback to suppliers. On that basis, we also lay out what to write in the RFP (request for proposal) and what to verify in the FAT (factory acceptance test) and SAT (site acceptance test).
Scope of This Article and Its Boundaries with Existing Articles
Supplier evaluation connects to many purchasing and quality tasks. To avoid overlap, we leave adjacent tasks to existing articles and cover only the touchpoints needed for evaluation here.
- How incoming inspection decisions are made and how inspection criteria are managed are covered in our article on incoming inspection management systems. This article covers only when those decisions become final and how they are passed to evaluation.
- How to handle discrepancies between the purchase order, the advance shipping notice and the physical goods is covered in our article on receiving discrepancy control. This article covers how to count the quantity variance remaining after that handling as an evaluation metric.
- Tracking and chasing undelivered balances is covered in our article on open purchase order management. This article covers how to use the due dates recorded on open purchase orders as the basis for the on-time delivery rate.
- The screens for order communication and due date responses with suppliers are covered in our article on supplier portals. This article touches on the portal only as a channel for returning evaluation results to suppliers.
- Comparing the terms of supplier quotations is covered in our article on AI comparison of supplier quotations. This article covers performance evaluation after trading has started.
- How to choose a purchasing management system as a whole is covered in our article on purchasing management systems. This article digs deeper into the supplier evaluation part of it.
What the Standards Require: ISO 9001 External Provider Evaluation and IATF 16949 Supplier Monitoring
ISO 9001:2026 Has Been Published
First, let us confirm the status of the editions. On the official ISO page, ISO 9001:2026 is shown as published on September 16, 2026 (edition 6), and ISO 9001:2015 is shown as “Withdrawn.” ISO’s explanatory page states, “ISO 9001:2026, which now replaces ISO 9001:2015.” The main changes ISO lists include leadership and quality culture in 5.1, strategic direction in 5.2, the distinction between risks and opportunities in 6.1, awareness in 7.3, and the new Annex A.
Regarding the transition period, the certification body LRQA advises that a transition period of approximately three years is anticipated, running to around September 2029. LRQA also explains that the transition arrangements will be formally confirmed by the International Accreditation Forum (IAF), and states that ISO 9001:2015 certificates remain valid during the transition period. Please confirm the definitive transition deadline against the IAF’s formal announcement. The certification body DQS lists “supplier criticality” as one example of an area to focus on when preparing for the transition.
We have not been able to verify, for this article, the clause in the 2026 edition that corresponds to the control of external providers (clause 8.4 “Control of externally provided processes, products and services” in the 2015 edition). Please therefore read the wording below as that of the 2015 edition.
The Evaluation Framework Required by 8.4.1 of the 2015 Edition
The wording of ISO 9001:2015 8.4.1 as quoted by the explanatory site Auditor Training Online is as follows.
“The organization shall determine and apply criteria for the evaluation, selection, monitoring of performance, and re-evaluation of external providers, based on their ability to provide processes or products and services in accordance with requirements.”
The same explanation also quotes the requirement to retain documented information of these activities and of any actions arising from the evaluations. As a practical example, it explains that if a re-evaluation finds a problem, a nonconformance is raised, and in extreme cases the supplier may be removed from approved status. The fact that an “approved-supplier list” is named as an example of what auditors check is also a reason to keep the ASL as a record.
Another explanatory site, isms.online, states in effect that for 8.4 you need to document not only the criteria but also the results of the activities, leaving a traceable audit trail. In this article, we base our reason for requiring an audit trail in the evaluation system on this explanation.
The IATF 16949 FAQ and the Monitoring Metrics Shown in Supplier Manuals
The automotive industry uses IATF 16949:2016. In the FAQ published by IATF (June 2026 edition), under 8.4.2.4.1 (second-party audits), in response to the question of whether a second-party audit is needed for a low-risk supplier, IATF answers that a risk analysis should be performed and that, depending on its results, a second-party audit may not be required. The FAQ lists the following criteria to consider in the risk analysis.
- Supplier certification status
- Commodity complexity
- New product launch(es)
- Significant employee turn-over
- Product quality issues
- Delivery issues
- Customer specific requirements
In this article, we note that quality and delivery issues are on this list. In other words, we take the view that the quality and delivery results aggregated by the evaluation system become input for deciding whether to conduct a second-party audit.
We have not checked the text of the IATF 16949 standard itself for this article. We therefore introduce the metrics to monitor through the wording of supplier manuals that companies publish as documents to help with conformance to IATF 16949.
Oetiker’s supplier manual for indirect suppliers (OEGR-P-0019/04) positions the manual as a tool to help with conformance to IATF 16949. It then lists the following four metrics to be monitored (paraphrased).
| Abbreviation | What the metric covers (paraphrased) |
|---|---|
| SQD | Conformity of delivered product to requirements |
| SCD | Customer disruptions caused by the supplier |
| SDP | Delivery schedule performance |
| SEP | Environmental disruptions caused by the supplier |
The manual states that suppliers are rated A, B or C for each metric, and that a B or C rating may trigger an escalation to improve performance.
Germany’s SUSPA specifies in its Quality Management Agreement (F0603.24, as of October 31, 2023) that it evaluates each supplier at least once a year on the following items: customer-related quality (holds at the customer, field returns, and stoppages of the customer’s line caused by the supplier), supplier quality, on-time delivery, the supplier’s response to defect reports, special freight costs (shipments from SUSPA to the customer caused by the supplier), and special status. The company also states that it keeps records of additional freight costs.
The Second Edition of IATF 16949 Is Planned for Mid-2027
According to IATF communique SC-2026-005 (July 30, 2026), the second edition of IATF 16949 is planned for publication in mid-2027. The communique also says the timeline is indicative and may change depending on the progress of the work. The third priority theme is “Tier N Supply Chain Management,” indicating a direction of strengthening the management of lower-tier suppliers through a more consistent, risk-based approach. We cover overall preparation for the second edition in our article on preparing for the IATF 16949 second edition.
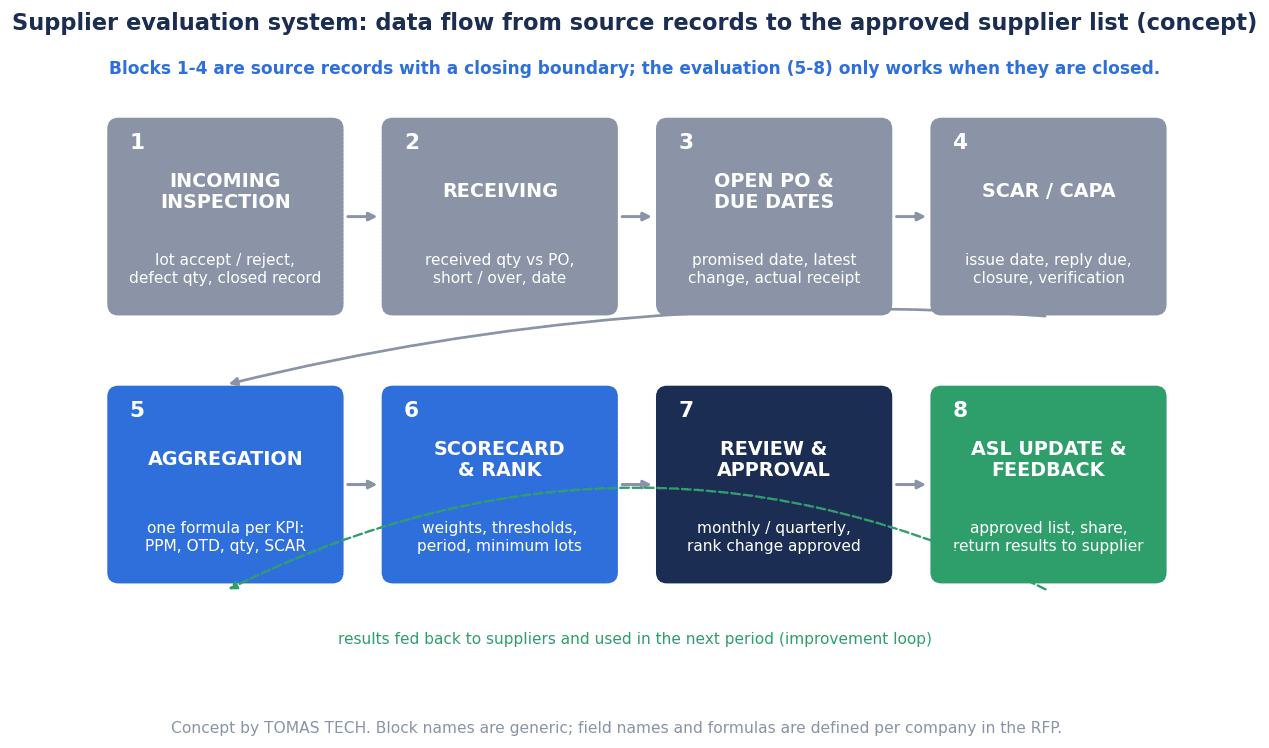
Data flow of the evaluation system (conceptual diagram). From the four source records (1 incoming inspection records, 2 receiving records, 3 open PO and due date records, 4 SCAR records), the data moves through 5 aggregation (definition formulas), 6 scorecard and rank, and 7 review meeting and approval, to 8 ASL update and supplier feedback.
Quality Metrics: Incoming Defect Rate, PPM and Lot Acceptance Rate
Even Public Documents Word the PPM Denominator Differently
As a quality metric, the one that appears in common across the public documents we checked for this article is PPM (defective parts per million). When you line up the definitions in public documents, the wording of the denominator differs slightly.
| Public document | Definition of PPM (gist of the original) |
|---|---|
| JAE Oregon “Supplier Quality Manual” Rev. 10 | Total defects ÷ total parts shipped × 1 million |
| Hendrickson supplier page (viewed 2026) | Number of rejected parts ÷ number of parts shipped × 1,000,000 |
| SUSPA Quality Management Agreement (as of October 31, 2023) | Number of defective parts ÷ number of parts delivered × 1 000 000 |
| SAP S/4HANA Cloud Parts Per Million KPI (SAP Learning) | Calculated from the number of items returned and the number of items for which quality notifications were created, relative to the number of items received |
Hendrickson further explains that its quality rating is calculated as “(2,000 − PPM) ÷ 2,000.” The company also notes that each rating and target may vary by business unit or supplier.
Decide the Rules for Counting Defects First
SUSPA specifies that the PPM calculation uses the date on which SUSPA recognized the defect. It also states that if the number of defects cannot be determined, the entire lot is treated as defective until the supplier presents another verifiable number, and that in the case of wrong deliveries or wrong packaging the entire lot is also treated as defective.
In this article, we take the view that these rules feed directly into the design of an evaluation system. Unless you decide which month a defect is counted in and how to handle cases where the number is unknown, the PPM value will fluctuate from month to month.
Incoming Defect Rate and Lot Acceptance Rate Change with the Denominator
The incoming defect rate and the lot acceptance rate are metrics that many companies define for themselves. As examples for this article, we define the incoming defect rate as “number of defects ÷ the quantity used as the denominator” and the lot acceptance rate as “number of accepted lots ÷ number of lots with a decision.”
The denominator is where the problem lies. At plants that use sampling inspection, the quantity inspected and the quantity delivered do not match. In this article, we take the view that because the value changes significantly depending on whether the denominator is the “inspected quantity” or the “delivered quantity,” it should be fixed as a definition formula at the RFP stage. Using the inspected quantity as the denominator gives the share of defects found within the sample. Using the delivered quantity gives the defects detected per quantity delivered, and the meaning of the value differs between suppliers with different sampling rates. Neither is wrong, but if you mix them, you cannot compare suppliers.
In the case of SAP S/4HANA Cloud, SAP Learning explains that the quality evaluation is split into a score based on inspection lot results and a score based on quality complaints received. Whether to combine quality into a single number or to view inspection lots and complaints separately is also a design decision.
Delivery Metrics: Calculating the Supplier On-Time Delivery Rate, Denominator and Numerator
On-Time Delivery Rate Formulas in Public Documents
In the JAE and Hendrickson documents, the on-time delivery (OTD) rate formula takes the form “on-time deliveries ÷ all deliveries.” The difference lies in what each calls “on time.” There are also methods, such as SAP’s, that turn the day difference directly into a score.
The JAE Oregon Supplier Quality Manual (Rev. 10) specifies that delivery is measured as the share of shipments within the evaluation period that met the criteria, as “compliant shipments / total shipments ∗100.” The criteria windows are as follows.
| Category | Non-compliant (too early) | Compliant | Non-compliant (late) |
|---|---|---|---|
| Domestic shipments | More than 3 days early | 3 days early to the due date | 1 day or more late |
| International shipments | More than 7 days early | 7 days early to the due date | 1 day or more late |
Hendrickson uses “Number of On-Time Shipments ÷ Total Number of Shipments” as its delivery rating formula. It treats deliveries received more than 3 days before the purchase order due date as early. The company explains that, while it expects zero late deliveries from suppliers, the calculation allows for 1 day late. The reason is to give the plant 1 business day after physically receiving the goods at the dock to receive them into the system.
For SAP S/4HANA Cloud, SAP Learning explains that the time evaluation is based on the difference between the item’s ordered date and the date it was delivered, treats both late and early deliveries as variances, and counts a one-day variance as 1%.
According to SAP’s older library (4.6C) description of MM Vendor Evaluation, the on-time delivery performance subcriterion and the quantity reliability subcriterion must always be viewed together. A minimum quantity can be set, per material or for all materials, for a goods receipt to be included in the evaluation. Goods receipts below the minimum quantity are not given a delivery score and instead receive a poor score for quantity reliability, the library explains.
These judgment windows are compared in the figure at the end of the next section. All of them are company-specific rules, and we do not recommend any of them.
Which Due Date to Use Is Your Own Decision
Lining up the public documents, the points each company decides when calculating the on-time delivery rate can be summarized as the following four.
- The unit of delivery counted in the denominator (per shipment, per purchase order line or per goods receipt)
- How early a delivery is allowed (the width of the window, and whether early delivery counts as non-compliant)
- Where lateness is judged (the physical receipt date or the system receipt date)
- Whether goods receipts below a minimum quantity are counted
In addition, in this article we take the view that “which due date to use as the basis” is also for each company to decide. Whether you use the due date promised at the time of ordering or a changed due date agreed partway through, the lateness judgment for the same delivery changes. If you use the changed due date, unless you record who approved the change, lateness disappears through the change. Efforts to reduce delivery delays themselves are covered in our article on preventing delivery delays.
Metrics for Quantity Variance, Supplier Corrective Action Requests (SCAR), Audits and Commercial Terms
Quantity Variance
SAP Learning describes the quantity evaluation in S/4HANA as being based on the difference between the ordered quantity and the delivered quantity. Both over-deliveries and under-deliveries are treated as variances. In this article, we take the view that you should use the value at the point when receiving discrepancy handling is complete and the finally accepted quantity is fixed. If you use the provisional value before handling, the discrepancy stays in the evaluation even after it is later resolved.
SCAR Response Deadlines and Completion
For a supplier corrective action request (SCAR), which asks for corrective action, the speed of the response and the certainty of completion are subject to evaluation. Deadlines differ from company to company.
| Public document | Corrective action deadlines (company-specific rules) |
|---|---|
| JAE Oregon “Supplier Quality Manual” Rev. 10 | Interim containment (D3 of 8D) within 24 hours of the nonconformance notice, final response within 10 business days (unless an extension has been agreed) |
| Oetiker supplier manual for indirect suppliers | Acknowledge receipt and start containment within 24 hours, complete containment and short-term measures within 48 hours, root cause and permanent measures within 14 days, effectiveness verification within 28 days |
JAE expects suppliers to manage both the D3 time and the final response time as metrics. Oetiker specifies that if resolution will take more than 28 days, this must be agreed with the quality contact, and that if a supplier does not respond within the deadline, appropriate action is taken, all actions are recorded and the costs are tracked.
In this article, we take the view that SCAR evaluation needs five dates: “issue date,” “response due date,” “response date,” “close date” and “effectiveness verification date.” If any of them is left blank, overdue items cannot be detected by machine. How to verify the effectiveness of corrective action is covered in our article on verifying corrective action effectiveness.
Audit Results
As the IATF FAQ introduced in Section 3 shows, quality and delivery issues are input for deciding whether a second-party audit is needed. Conversely, audit results can also be included in the evaluation. The official SAP on-premise help explains that the evaluation uses incoming inspection results and quality audit data from quality management. If you include audit scores in the evaluation, also decide how to treat suppliers that have not been audited (blank or a neutral value).
Compliance with Commercial Terms
The commercial terms items become a place to record not only the supplier’s performance but also your own company’s compliance. The Trade Competition Commission of Thailand (TCC) credit term guidelines and Japan’s Toriteki Act are taken up in Section 12 as issues for plants in Thailand. There are also examples, like SUSPA, of recording special freight costs and including them in the evaluation.
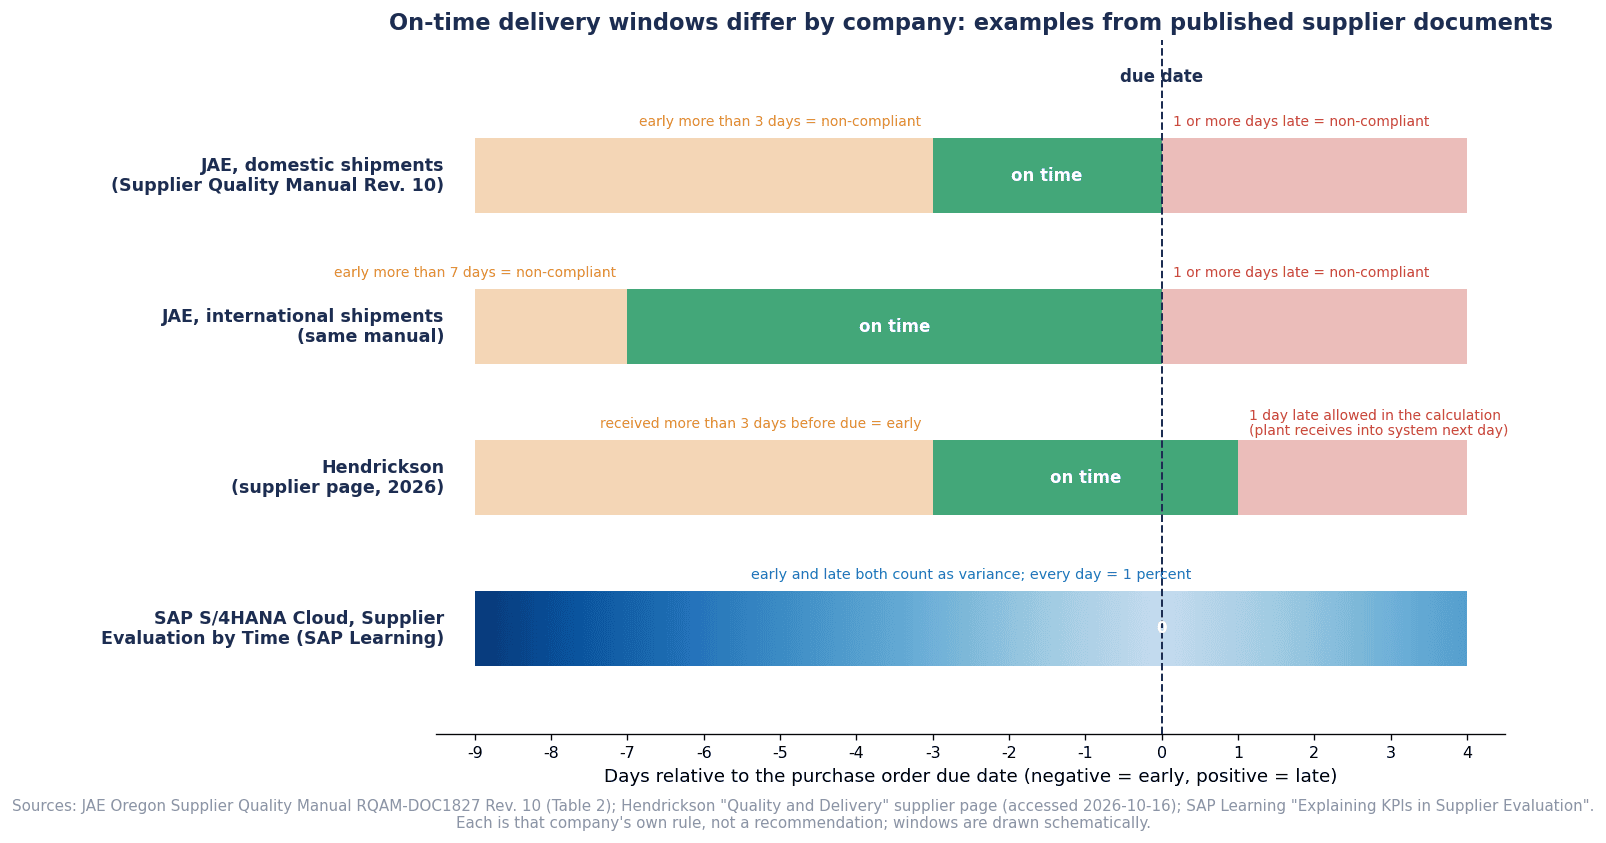
On-time delivery judgment windows differ from company to company (examples from public documents). JAE treats 3 days early to the due date as compliant for domestic shipments and 7 days early to the due date for international shipments, and treats 1 day or more late as non-compliant (Supplier Quality Manual Rev. 10). Hendrickson treats arrivals more than 3 days early as early and allows 1 day late in its calculation (company supplier page, viewed 2026). SAP S/4HANA Cloud counts both early and late deliveries as variances at 1 day = 1% (SAP Learning). All of these are company-specific rules, not recommended values.
Data Sources and the Closing Boundaries of the Four Records
Evaluation Does Not Run Until the Four Records Are Final
Here we make the core idea of this article concrete. Evaluation is the aggregation of four records. In this article, we take the view that unless you decide, for each of the four records, the point at which it can be called “final,” the evaluation system will not run.
| Record | Example closing boundary (our framing) | What happens if it is not decided |
|---|---|---|
| Incoming inspection record | When the accept/reject decision is approved. Lots on hold are not aggregated until final | Lots on hold are counted twice across months |
| Receiving record | When receiving discrepancy handling is complete and the received quantity is fixed | Discrepancies resolved later remain in the evaluation |
| Open PO and due date record | When the due date used for evaluation is fixed and the approver of any change is recorded | Lateness disappears, or increases, through due date changes |
| SCAR record | When the close date and effectiveness verification date are entered | Overdue items cannot be detected |
Prerequisites Seen in Public Documents
According to the official SAP on-premise help, vendor evaluation uses purchase order due dates, prices and quantities, incoming inspection results and quality audits from quality management, goods receipt data from inventory management, and data from LIS (Logistics Information System). For SAP S/4HANA Cloud, the prerequisites for evaluation include running the purchasing data migration app and configuring scheduling agreements to be included in the evaluation. After changing weights or calculation methods, the help explains that you run report MM_PUR_SEWS_VAR_SCORE_UPDATE to recalculate the scores.
Hendrickson allows 1 business day of lateness in its calculation because there is a gap between the physical receipt date and the system receipt date. SUSPA’s rule of using the date it recognized the defect can also be read as an example of setting the boundary for which period a defect is counted in.
Master Data Must Also Be in Place
To aggregate evaluations by supplier, by item group and by buyer, the master data for supplier codes, item codes and purchasing categories must be in order. If the same supplier is registered under multiple codes, its evaluation is scattered. For master data maintenance, see our article on master data management.
Scorecard and Rank: Weighting and Thresholds in Supplier Evaluation Criteria
How Scores Are Built in Public Documents
How scores are built differs by product and company. Here are the descriptions in official documentation.
- The official SAP on-premise help explains that the standard score range is 1 to 100 points, and that the overall score is calculated by multiplying the score for each main criterion (price, quality, delivery, general service, external service and invoice) by a weight. Additional main criteria can be defined. According to the 4.6C library, each main criterion can have up to 20 subcriteria.
- The official SAP S/4HANA Cloud help explains that weights for inspection lots, quantity, time, price, questionnaires, quality notifications, user-defined criteria and PPM are set per purchasing category, and that supplier classification is also maintained.
- Hendrickson shows an overall rating calculated by adding four ratings (quality, delivery, lead time and fill rate) and dividing by 4.
- Microsoft’s official training explains that when you select a Rating for each evaluation criterion, the Average rating is updated automatically.
Rank Definitions Are for Each Company to Decide
Thresholds for A, B and C ranks are not standardized even across public documents. Oetiker rates each metric A, B or C and says a B or C may trigger escalation, but within the documents we checked for this article, the threshold values are not published. In this article, we take the view that rank thresholds should be set to suit your own products and supplier mix, and that you should not import other companies’ numbers.
As a hypothetical example for this article, the weighting and settings are shown in the table below. The numbers are hypothetical values for illustration only.
| Setting | Hypothetical example in this article | Considerations when deciding |
|---|---|---|
| Weighting | Quality 4, delivery 4, corrective action response 2 (total 10) | Changes with product criticality |
| Evaluation period | Rolling aggregation over the last 12 months | Whether to smooth seasonal variation |
| Evaluation frequency | Calculated monthly, reviewed quarterly | Match the frequency of review meetings |
| Minimum number of lots | Suppliers with few lots in the period are treated as “reference values” | Do not judge low-volume suppliers by the same threshold |
| Rank threshold | Set in-house (parameterized) | Changes with supplier mix |
Evaluation Period and Minimum Number of Lots
The official help explains that the operational evaluation in SAP S/4HANA Cloud is calculated over the period from the previous year to the current date. In this article, we take the view that a short evaluation period lets a single defect move the rank significantly, while a long one makes improvements slow to show, so it is important to hold the period as a setting. Also, for a supplier that delivers only a few times a year, one defective lot causes the rank to plunge. Decide on a treatment such as not finalizing the rank for suppliers below the minimum number of lots and judging them individually at the review meeting.
Approved Supplier List (ASL) and Re-evaluation, New Registration and Suspension
The ASL Is the Exit of Evaluation
The approved supplier list (ASL) is the list in which evaluation results are reflected. The explanation of ISO 9001:2015 8.4.1 (Auditor Training Online) says that if a re-evaluation finds a problem, action is taken, and in extreme cases the supplier may lose approved status. Oetiker’s manual also uses the phrase “approved OETIKER supplier status.”
In this article, we propose managing the ASL status in at least the following four states.
| Status | Meaning (our framing) | Handling of orders |
|---|---|---|
| Under new evaluation | A registration application has been received and qualification is being checked | Prototypes and first lots only |
| Approved | Meets the evaluation criteria | As normal |
| Conditional | Rated B, C or similar, and an improvement plan is requested | Subject to review of order allocation |
| Suspended | New orders are stopped | Cannot be ordered |
Re-evaluation and Expiry Dates
The re-evaluation cycle also varies across public documents. SUSPA evaluates at least once a year, and JAE says it provides quarterly scorecards to strategic suppliers. Oracle’s official documentation describes settings that give a qualification an expiry date and automatically start requalification when it expires or enters the notification period before expiry, as well as settings that automatically requalify when a new response arrives.
In this article, we take the view that in addition to periodic re-evaluation, it is important to decide the conditions for event-driven re-evaluation. Examples are a serious defect, an overdue SCAR, or the relocation of a supplier’s plant. The risk analysis criteria in the IATF FAQ (certification status, new product launches, significant employee turn-over and so on) are a useful starting point for thinking about these conditions.
Stop Trading Through the System
Microsoft’s official training explains that in Dynamics 365 Supply Chain Management a vendor can be put on hold, and that the hold status determines which transactions are blocked. In this article, we take the view that when an ASL status becomes “Suspended,” it should be linked so that the supplier cannot be selected on the purchase order screen of the purchasing system. Even if a suspension is decided on a list, if the supplier can still be selected on the order screen, it will slip through in operation.
Pass Rank Changes Through Approval
If you design ranks to change automatically, a rank dropped because of a data error will affect trading. In this article, we propose a flow in which the system produces a proposed rank, and the heads of quality assurance and purchasing approve it at the review meeting before it is reflected in the ASL. As the official SAP on-premise help explains that “changes to evaluations are recorded in a log,” also keep a record of who changed the rank and when.
Feedback to Suppliers and the Improvement Cycle
Improvement Does Not Happen Unless Results Are Returned
In this article, we take the view that evaluation results only become improvement when they are returned to suppliers and lead to corrective action and discussions of commercial terms. Even if you build an evaluation sheet internally, a supplier that does not know its own numbers cannot set improvement priorities.
In public documents, JAE says it provides quarterly scorecards to strategic suppliers. SAP Learning explains that SAP S/4HANA Cloud has the Supplier Evaluation Score Output app, which can send evaluation scores to suppliers by email or print.
Decide the Channel, Frequency and Language
For how to return results, decide the following three things.
- Channel: whether to return results at regular quality meetings, through the supplier portal or by email
- Frequency: whether to return the monthly numbers every month or together at the quarterly review
- Language: whether to return them in Thai, Japanese or English (discussed in detail in Section 12)
If you return only numbers, the supplier cannot check “which deliveries were judged late.” In this article, we propose attaching, together with the score, a list of the deliveries and inspection lots on which the judgment was based. If a supplier raises an objection, record it, and if it is a data error, recalculate. Having this objection and recalculation flow increases trust in the evaluation numbers.
Reflect the Results of Improvement in the Next Period
Once a supplier completes corrective action, confirm the effect with the numbers for the following periods. If the improvement shows in the numbers, restore the rank; if not, move on to another corrective action request or a review of order allocation.
Examples of Standard Functions in ERP and Purchasing Systems
Here we introduce the supplier evaluation functions described in each vendor’s official documentation. This is not a comparison of strengths and weaknesses. The vendors are listed in alphabetical order, followed by examples of Japanese packages.
Microsoft Dynamics 365 Supply Chain Management
According to Microsoft’s official training (Microsoft Learn), you set up evaluation criteria groups and evaluation criteria and assign them to procurement categories. When you select a vendor, open the evaluation and choose a Rating for each criterion, the Average rating is updated automatically. Microsoft also explains that spend analysis and vendor performance analysis can be carried out with purchasing and accounts payable reports. There is also a function to put a vendor on hold. In the description on the same page, the Rating is explained as something the user selects and enters.
Oracle Fusion Cloud Procurement
According to Oracle’s official documentation (25C), Supplier Qualification Management uses qualification areas and questions to evaluate specific aspects of a supplier. When the evaluator approves the responses, a qualification is created, and an expiry date and automatic requalification can be set. Using a qualification model, you can carry out an assessment that combines multiple qualification areas, and there is also a setting to automatically reassess based on the results of requalification. The Oracle documents we checked for this article focus on questionnaire-based qualification management.
SAP
The official help for SAP S/4HANA (on-premise) describes a score range of 1 to 100 points, an overall score from main criteria and weights, and evaluation using purchase orders, incoming inspection results and goods receipt data. Scoring can be fully automatic, semi-automatic or manual, and changes to evaluations are recorded in a log. As mentioned in Section 5, there is also a setting that excludes goods receipts below a minimum quantity from the delivery evaluation.
The official help for SAP S/4HANA Cloud Public Edition and SAP Learning describe operational scores based on variances in quantity, price, quality and time, weights per purchasing category, the PPM KPI, Score Output to send scores to suppliers, and a recalculation report after configuration changes.
In addition, on October 12, 2026, SAP announced that through a partnership with Moody’s it will embed supplier risk monitoring into SAP Ariba Supplier Lifecycle and Performance, with general availability planned for the fourth quarter of 2026.
Japanese Packages
According to a September 2019 report by Cloud Watch, TIS announced that it had added “Supplier Quality Management,” with functions such as on-time delivery rate, defect occurrence rate and certification management, as a new module to its “LinDo Purchasing Cloud Service.” The report said it automatically carries out a quantitative evaluation on two axes, supply quality and product quality, based on data such as goods receipts against orders. This is a 2019 report, and the current functions need to be confirmed with the company.
On the other hand, NEC’s “Key Points for Selecting a Production Management System” page lists six components of a typical production management package, including production planning, requirements calculation, process management, purchasing management and cost management. The term “supplier evaluation” does not appear on that page. We introduce it not as a statement about whether the product has the function, but as an example in which supplier evaluation does not appear as a separate item in a list of basic production management functions.
When Standard Functions Are Enough, and When Integration Is Needed
In this article, we take the view that if all four records (incoming inspection, receiving, open purchase orders and SCAR) are in the same ERP, it is best to first consider operating with the standard functions. On the other hand, at plants in Thailand it is not unusual for incoming inspection records to sit in a separate quality department system or spreadsheet, and SCAR records in email or shared folders. In that case, you need an integration design that defines at what point and from which system each record is passed to the evaluation side. How to approach system integration is covered in our article on API integration development for manufacturers.
Issues Specific to Plants in Thailand
The Chonburi Floods from Late September 2026 and Single-Source Parts
According to The Nation (October 8, 2026), an earthen embankment collapsed at the Amata City industrial estate in Chonburi, and 34 factories in Zones 7, 8 and 9 stopped production, including more than 10 auto-parts plants. Citing information from the Ministry of Industry, the paper reported that five car manufacturers temporarily stopped production because suppliers could not make or deliver parts, or because employees could not come to work. Suppliers expected to resume deliveries from October 12. In addition, the honorary chairman of the Automotive Parts Industry Club of the Federation of Thai Industries (FTI) said that switching suppliers can take nearly a year to approve, especially for pickup trucks.
The same article divides parts into two groups: “substitutable parts,” which are supplied by multiple companies or can be temporarily imported from other ASEAN countries, and “single-source parts,” which only one supplier in Amata makes and for which there is no substitute. For the latter, car production is delayed until the supplier restores its equipment. Thailand Business News (October 6, 2026) reported the FTI’s estimate that losses to the automotive supply chain and related industries are no less than 1.018 billion baht.
In this article, we take the view that holding “is it substitutable,” “is it single-source” and “is there an alternative approved supplier” in your everyday evaluation records speeds up decisions in an emergency. Precisely because switching takes time, there is value in managing, as ASL attributes, whether an alternative supply exists, in addition to quality and delivery performance.
Thailand’s TCC Credit Term Guidelines
According to Tilleke & Gibbins (June 24, 2021), the Trade Competition Commission of Thailand (TCC) issued guidelines on payment terms when SMEs sell goods or services to buyers, effective December 16, 2021. In the commerce, manufacturing and service sectors, the payment period must not exceed 45 days, and in activities related to agricultural products or simple primary processing it must not exceed 30 days. However, a longer period can be set if there is a legitimate business reason and a contractual arrangement. The payment period is counted from the date the delivery of the goods or services is complete. Changing payment terms or contract terms without a legitimate reason and without at least 60 days’ advance notice is given as an example of unfair conduct.
In this article, we propose recording these guidelines in the evaluation system not as supplier performance but as a compliance item on your own company’s side. If you record whether the supplier qualifies as an SME, the payment due date and actual payment date, and the date of notice of any term change, you can also check your own company’s delays at the evaluation review meeting.
Japan’s Toriteki Act
In Japan, the “Act on the Prevention of Delay in the Payment of Proceeds to Small and Medium-sized Entrusted Business Operators Pertaining to Manufacturing Entrustment, etc.” (short name in Japanese: the Act on the Proper Conduct of Small and Medium-sized Entrusted Business Transactions, commonly called the Toriteki Act), which amended the Act against Delay in Payment of Subcontract Proceeds, etc. to Subcontractors, came into force on January 1, 2026. According to materials from the Small and Medium Enterprise Agency, the main amendments include a ban on unilaterally determining prices without responding to requests for consultation, and a ban on payment by promissory note. The same materials explain that changes in costs and other circumstances include changes to trading terms such as shortened delivery lead times, increased delivery frequency and reduced order quantities compared with before, and that a “determination” includes keeping a price unchanged.
The Toriteki Act is a Japanese law. In this article, we do not discuss its application to transactions within Thailand. For transactions that involve a Japanese head office or a Japanese entity, we take the view that keeping records of discussions on price and delivery terms during evaluation reviews provides material showing the course of consultation. When you change trading terms on the basis of evaluation numbers, it is a good idea to also keep the record of those discussions in the evaluation system.
Running Operations in Thai, Japanese and English
At Japanese-affiliated plants in Thailand, operations tend to run in three languages: Thai with supplier contacts, Japanese for reports to the head office, and English with group companies and foreign-owned suppliers. In this article, we propose holding metric names, rank names and SCAR field names as trilingual master data, and making the reports returned to suppliers available in the recipient’s language. Unless the explanations of the metric definition formulas are also prepared with the same content in all three languages, interpretation will drift from supplier to supplier.
The Depth of Supplier Tiers
In Thailand’s automotive industry, multiple tiers of suppliers sit beneath the car manufacturers. According to a Thailand Automotive Institute figure (as of September 2019) cited in an NSTDA presentation (given on March 30, 2023), there are 18 car manufacturers and 8 motorcycle manufacturers, compared with 476 Tier 1 suppliers and 1,210 Tier 2 and lower suppliers. All of these are 2019 figures. Considering that Tier N management is a priority theme for the IATF 16949 second edition, how much information to hold not only on your direct suppliers but also on the suppliers beyond them will be a design issue going forward.
Investment Background
According to a BOI announcement (PR No.178/2569, October 7, 2026), investment applications from Japanese companies from 2021 to mid-2026 totaled 1,380 projects, worth approximately 396.5 billion baht. As production equipment continues to be upgraded, we expect that more plants will also review how they manage suppliers.
How to Proceed with Implementation (90 Days)
In this article, we propose implementing a supplier evaluation system in four stages over 90 days.
| Period | Stage | Main tasks | Exit condition |
|---|---|---|---|
| Days 1-30 | Agree on definitions | Quality assurance and purchasing agree on metric definition formulas, denominators and numerators, closing boundaries of the four records, and initial weighting and rank thresholds | The heads of both departments approve the definitions document |
| Days 31-60 | Trial calculation with historical data | Calculate evaluations using the past 12 months of incoming inspection, receiving, open PO and SCAR data, and compare them with the manual evaluation | The cause can be explained for each supplier where a difference appears |
| Days 61-80 | Parallel operation | Run the manual evaluation and system evaluation side by side, and hold one review meeting | The approval flow for proposed ranks works |
| Days 81-90 | Go-live | Treat the system evaluation as the official one and start feedback to suppliers | The first scorecards are sent to suppliers |
In this article, we take the view that the trial calculation with historical data is the stage that yields the most discoveries. When you investigate, one by one, the suppliers whose manual and system evaluations do not match, you will in many cases find differences in the denominator definition or the due date used as the basis. Going back to the definitions document to fix these differences builds trust after go-live.
If you are commissioning an external development company, see our article on choosing a system development company in Thailand.
Costs and a Model Calculation
All the numbers from here on are hypothetical numbers for this article. They are not numbers from an actual plant. Please read them as a model to illustrate the approach.
Assumptions
- Current evaluation work: creating monthly scorecards takes 2 people × 8 hours = 16 hours/month. Preparing quarterly reviews takes 24 hours/quarter, which is 8 hours/month on a monthly basis. Total 16 + 8 = 24 hours/month, and 24 × 12 = 288 hours/year
- Hourly rate: 500 THB
- Evaluation work after implementation: 4 hours/month, and 4 × 12 = 48 hours/year
- Line stoppages caused by suppliers: currently 4 times a month, 1 hour each. The loss per hour of stoppage is assumed to be 10,000 THB
- Only line stoppage losses caused by suppliers are counted
Reduction in Evaluation Workload
| Item | Calculation | Amount (THB/year) |
|---|---|---|
| Current evaluation workload | 288 × 500 | 144,000 |
| Evaluation workload after implementation | 48 × 500 | 24,000 |
| Workload reduction | 144,000 − 24,000 | 120,000 |
Reduction in Line Stoppages (Base Case)
In the base case, we assume that as a result of returning evaluation results to suppliers and making progress on improvement, supplier-caused stoppages fall from 4 times a month to 2 times a month. Stoppages do not fall simply because a system is installed. This assumption presupposes that feedback and corrective action are actually carried out.
| Item | Calculation | Amount (THB/year) |
|---|---|---|
| Current stoppage loss | 4 × 1 × 12 = 48 hours, 48 × 10,000 | 480,000 |
| Stoppage loss after implementation | 2 × 1 × 12 = 24 hours, 24 × 10,000 | 240,000 |
| Reduction in stoppage loss | 480,000 − 240,000 | 240,000 |
The total reduction is 120,000 + 240,000 = 360,000 THB/year.
Initial Cost and Payback Period
| Item | Amount (THB) |
|---|---|
| Design | 60,000 |
| Development and integration | 150,000 |
| Training and parallel operation | 30,000 |
| Total | 240,000 |
The initial cost is 60,000 + 150,000 + 30,000 = 240,000 THB. The payback period in the base case is 240,000 ÷ 360,000 ≈ 0.67 years (about 8.0 months).
Sensitivity Case
We also look at the case where improvement does not go as hoped and stoppages fall only to 3 times a month.
- Stoppage loss after implementation: 3 × 1 × 12 = 36 hours, 36 × 10,000 = 360,000 THB/year
- Reduction in stoppage loss: 480,000 − 360,000 = 120,000 THB/year
- Total reduction: 120,000 + 120,000 = 240,000 THB/year
- Payback period: 240,000 ÷ 240,000 = 1.0 year (12 months)
Comparison of Annual Costs
| Case | Stoppage loss | Evaluation workload | Total (THB/year) | Difference from current |
|---|---|---|---|---|
| Current | 480,000 | 144,000 | 480,000 + 144,000 = 624,000 | – |
| Base case | 240,000 | 24,000 | 240,000 + 24,000 = 264,000 | 360,000 |
| Sensitivity case | 360,000 | 24,000 | 360,000 + 24,000 = 384,000 | 240,000 |
What this model shows is that most of the effect depends on reducing line stoppages, in other words on supplier improvement. Of the base case total reduction of 360,000 THB/year, the workload reduction is 120,000 THB/year, and the remaining 240,000 THB/year is the reduction in stoppage loss. In this article, we take the view that when making an investment decision on an evaluation system, you should first confirm whether you can genuinely build the operation of returning evaluation results and driving improvement, rather than focusing on workload reduction.
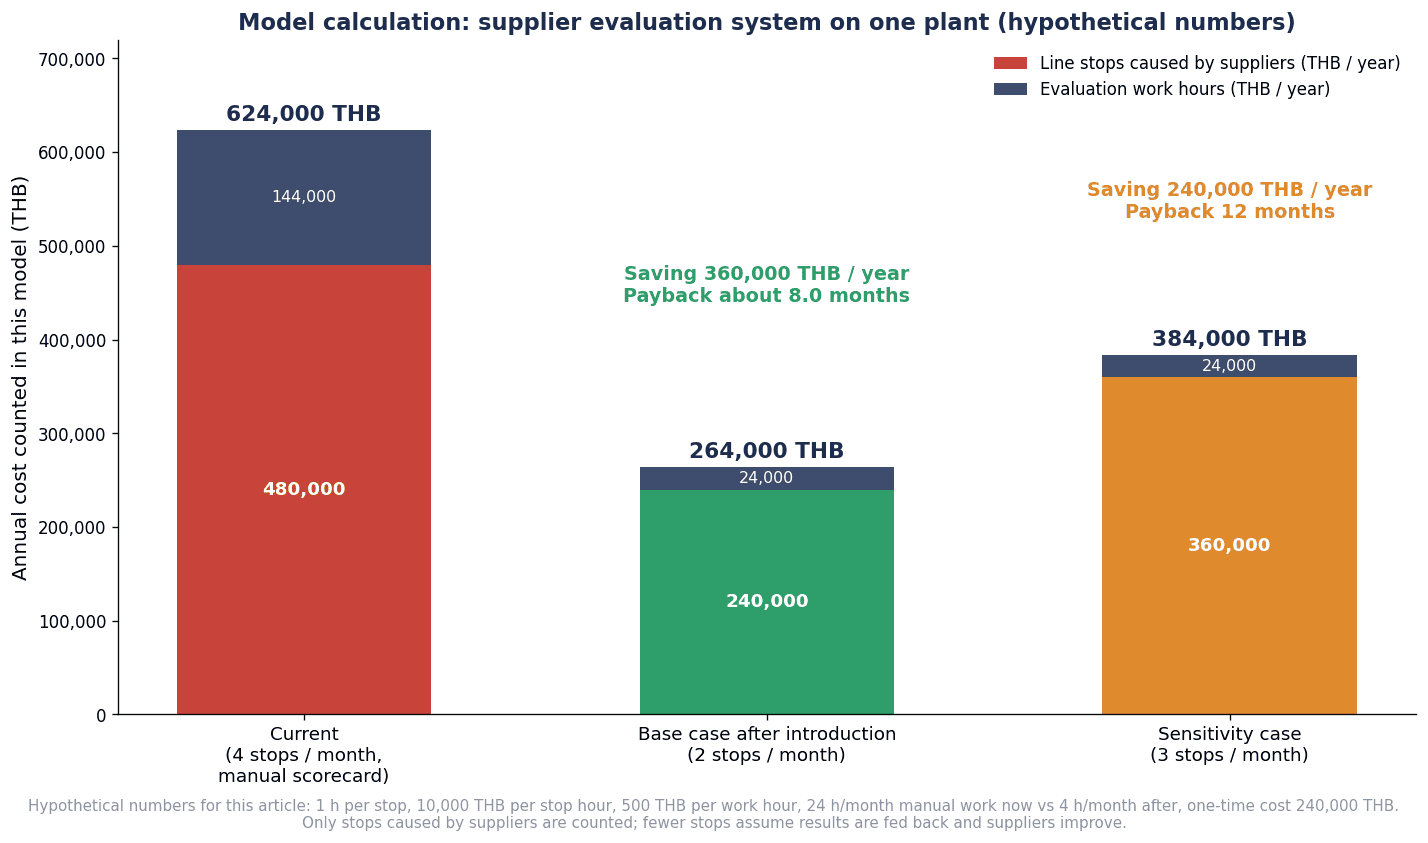
Model calculation (hypothetical numbers). The annual costs for the current state, the base case and the sensitivity case are stacked, split into supplier-caused stoppage loss and evaluation workload. The reduction in stoppages is an assumption that applies when evaluation results are returned to suppliers and improvement progresses.
What to Write in the RFP
In this article, we take the view that the RFP for a supplier evaluation system should state the metric definition formulas and the closing boundaries of the records before any screen requirements. If you place the order while the definitions are vague, each development company builds to its own interpretation, and disputes arise at the acceptance stage.
| Item | What to write in the RFP (our proposal) |
|---|---|
| Metric definition formulas | For each metric (PPM, incoming defect rate, lot acceptance rate, on-time delivery rate, quantity variance, SCAR response and completion), write the numerator, denominator, unit and rounding method as a formula |
| Due date basis | Whether to use the due date promised at ordering or the changed due date. The width of the early and late windows. Whether to use the physical receipt date or the system receipt date |
| Data sources and integration | Which system each of the four records is in, and at what point and how often it is passed to the evaluation side. How integration failures are handled |
| Closing boundaries | Whether lots on hold, unprocessed receiving discrepancies and unclosed SCARs are included in the aggregation |
| Parameterized rank thresholds | Weighting, thresholds and the minimum number of lots can be changed from the screen, with a change history kept |
| Evaluation period | Monthly, quarterly, the last 12 months and so on can be selected |
| Recalculation | Past periods can be recalculated after definitions or settings are changed. Values before and after recalculation can be compared |
| Audit trail | For rank changes, manual corrections and setting changes, who changed what, when and why is recorded |
| Multilingual support | Metric names, rank names and reports can be output in Thai, Japanese and English |
| Permissions | Permissions for viewing evaluations, correcting, approving ranks and changing settings can be separated. Suppliers can see only their own evaluation |
| Feedback | Scorecards and the detail on which the judgment was based can be sent to suppliers. Objections are received and recorded |
| ASL integration | Changes in ASL status are reflected in whether orders can be placed in the purchasing system |
If you attach 12 months of actual historical data (with personal information and prices masked) to the RFP and ask vendors to run a trial calculation at the proposal stage, differences in their understanding of the definitions become visible early.
What to Verify in FAT/SAT
FAT (factory acceptance test) is carried out in the development company’s environment, and SAT (site acceptance test) in your own environment with actual data. In this article, we take the view that acceptance of a supplier evaluation system should focus on checking “whether the numbers match” rather than on screen operations.
| Test item | What to verify | FAT | SAT |
|---|---|---|---|
| Recalculation match with historical data | Evaluations calculated with the past 12 months of data match values checked by hand | Test data | Actual data |
| Boundary cases for denominator and numerator | Lots on hold, partial deliveries, goods receipts below the minimum quantity and lots with an unknown number of defects are handled as defined | Yes | Yes |
| Delivery window boundaries | Days at the edge of the window (exactly on the due date, 1 day late, arriving 1 day beyond the early window) are judged as defined | Yes | Yes |
| Re-evaluation after due date changes | Orders whose due date was changed are judged against the defined base date, and the approver of the change is recorded | Yes | Yes |
| Detection of overdue SCARs | SCARs past their response or close deadline appear on a list and are reflected in the evaluation | Yes | Yes |
| Rank change approval flow | The ASL does not change until the proposed rank is approved. A record of the approval is kept | Yes | Yes |
| Setting changes and recalculation | After weighting or thresholds are changed, recalculation is possible, and values and history before and after the change are kept | Yes | Yes |
| Permissions | Users without permission cannot correct or approve. Suppliers cannot see other companies’ evaluations | Yes | Yes |
| ASL and order linkage | A suspended supplier cannot be selected on the order screen | – | Yes |
| Multilingual reports | The same numbers appear in Thai, Japanese and English reports | Yes | Yes |
What matters most is preparing the boundary case test data yourself. If you leave it to the development company, testing tends to end with clean data only. If you include in the test data the “deliveries we hesitated to judge” and the “defects we argued about how to count” that actually occurred on the shop floor, holes in the definitions come to light.
Common Mistakes
Adding Too Many Metrics
The more evaluation items you have, the fairer it seems. However, as items increase, so does the effort of deciding every closing boundary for the underlying records, and it becomes harder to explain which item moved the rank. In this article, we propose starting with a small number of metrics (quality, delivery and corrective action response) and adding more once operations are running.
Departments Define the Denominator Differently
It is common for quality assurance to calculate the defect rate on the inspected quantity and purchasing on the delivered quantity. If you introduce a system without creating a definitions document, one of the departments will start saying, “The system’s numbers are wrong.”
Not Returning Evaluation Results
As discussed in Section 10, if you stop at assigning ranks internally, suppliers enter the next period without knowing where they stand, and the improvement assumed in the model calculation does not happen.
No Approval for Rank Changes
As discussed in Section 9, unless proposed ranks and approval are kept separate, a data error can stop orders, damaging both the supplier relationship and production.
Judging Low-Volume Suppliers by the Same Threshold
Unless you decide on the minimum number of lots and the treatment of reference values discussed in Section 8, a low-volume supplier drops to the lowest rank with a single defect.
Frequently Asked Questions (FAQ)
What Is a Supplier Evaluation System?
It is a mechanism that aggregates each supplier’s quality, delivery and corrective action response performance from records such as incoming inspection, receiving, open purchase orders and supplier corrective action requests (SCAR), and builds a scorecard and rank. The results are used to update the approved supplier list, run re-evaluations, decide order allocation and give feedback to suppliers.
What Should Supplier Evaluation Criteria Include?
In public documents, quality (such as PPM), on-time delivery, speed of corrective action response, quantity variance, audit results and so on are used. Oetiker lists four metrics (product conformity, customer disruptions, delivery schedule and environmental disruptions), and SUSPA also lists items such as customer-related quality and special freight costs. In this article, we propose starting with a small number of metrics.
How Is the On-Time Delivery Rate Calculated?
The basic form is “on-time deliveries ÷ all deliveries.” JAE specifies “compliant shipments / total shipments ∗100.” However, the early delivery window, the date used to judge lateness, the due date used as the basis and the treatment of minimum quantities differ by company, so you need to decide them yourself as a definition formula.
How Is PPM Calculated?
It is “number of defects ÷ number shipped (or delivered) × 1,000,000.” JAE, Hendrickson and SUSPA all show this form, but the wording of the denominator differs between documents. Also decide which date a defect is counted on and how to handle cases where the number of defects is unknown.
How Should the Approved Supplier List Be Managed?
In this article, we propose giving it states such as under new evaluation, approved, conditional and suspended, and changing the state based on evaluation results and approval at the review meeting. Link the suspended state to whether orders can be placed in the purchasing system, and keep a history of changes.
What Does ISO 9001 Require?
The 2026 edition of ISO 9001 was published on September 16, 2026, and the 2015 edition has been withdrawn. Clause 8.4.1 of the 2015 edition, as quoted by an explanatory site, required organizations to determine and apply criteria for the evaluation, selection, monitoring of performance and re-evaluation of external providers, and to retain records of these. Please check the corresponding clause of the 2026 edition in the text of the standard.
What Should Be Checked in the RFP and FAT/SAT?
In the RFP, write the metric definition formulas, data sources and integration, closing boundaries, parameterized rank thresholds, recalculation, audit trail, multilingual support and permissions. In FAT/SAT, verify the recalculation match with historical data, judgment of boundary cases, re-evaluation after due date changes, detection of overdue SCARs, the rank change approval flow and permissions.
Summary
Supplier evaluation is the aggregation of four records: incoming inspection, receiving, open purchase orders and SCAR. In this article, we take the view that deciding a closing boundary for each record and agreeing on the metric definition formulas first is the starting point for systematization. Ranks should move based on thresholds you set yourself and approval at review meetings, and only by returning results to suppliers and driving improvement does evaluation connect to the plant’s performance. Write the definition formulas and closing boundaries in the RFP, and in FAT/SAT confirm that the numbers match using historical data.
Even if you are still at the stage of working out evaluation metric definitions or considering integration with your existing incoming inspection or purchasing systems, TOMAS TECH is happy to help. Contact us here
References
- ISO 9001:2015 – Quality management systems — Requirements (ISO, published 2015, withdrawn)
- ISO 9001:2026 – Quality management systems — Requirements (ISO, 2026)
- ISO 9001:2026: What businesses need to know (ISO, viewed 2026)
- ISO 9001 revision update: Publication date confirmed (LRQA, viewed 2026)
- What you should know about the ISO 9001:2026 revision (DQS, viewed 2026)
- ISO 9001 Clause 8.4 Control of externally provided processes, products and services (Auditor Training Online, viewed 2026)
- ISO 9001, Clause 8.4 Explained (isms.online, viewed 2026)
- IATF 16949:2016 Frequently Asked Questions June 2026 (IATF, 2026)
- IATF Stakeholder Communique SC-2026-005 IATF 16949 2nd Edition status (IATF, 2026)
- Supplier Manual INDIRECT SUPPLIERS OEGR-P-0019/04 (Oetiker, viewed 2026)
- Quality Management Agreement NPM Supplier F0603.24 (SUSPA, 2023)
- Supplier Quality Manual RQAM-DOC1827 Rev. 10 (JAE Oregon, viewed 2026)
- Quality and Delivery (Hendrickson, 2026)
- Overview of the Toriteki Act: Key Points of the Amendment, Document 1 (Small and Medium Enterprise Agency, in Japanese, 2026)
- Toriteki Act Related Information (Japan Fair Trade Commission, in Japanese, viewed 2026)
- New Guidelines Prevent Large Purchasers from Setting Unfair Credit Terms for SMEs in Thailand (Tilleke & Gibbins, 2021)
- PR No.178/2569 Thailand and Japan Cement $11.7 Billion Industrial Alliance (BOI, 2026)
- Floods halt over 10 auto-parts plants with Oct 12 restart expected (The Nation, 2026)
- Thailand’s Floods Expose Severe Vulnerabilities in Its Automotive Supply Chain (Thailand Business News, 2026)
- NAC2023 presentation Thailand Automotive Industry Structure (NSTDA, 2023)
- MM Vendor Evaluation SAP S/4HANA on-premise (SAP Help Portal, viewed 2026)
- Subcriterion SAP Library MM Vendor Evaluation 4.6C (SAP Help Portal, viewed 2026)
- Supplier Evaluation SAP S/4HANA Cloud Public Edition 2608 (SAP Help Portal, 2026)
- Operational Supplier Evaluation (SAP Help Portal, 2026)
- Supplier Evaluation Weighting and Scoring (SAP Help Portal, 2026)
- Explaining KPIs in Supplier Evaluation (SAP Learning, viewed 2026)
- Explain Supplier Evaluation (SAP Learning, viewed 2026)
- The Next Chapter in Spend Management: AI Innovations Across SAP Ariba, SAP Fieldglass, and SAP Concur (SAP News, 2026)
- Evaluate a vendor and put a vendor on hold (Microsoft Learn, viewed 2026)
- Qualification Areas Using Procurement 25C (Oracle Docs, viewed 2026)
- How You Use Qualification Models Using Procurement 25C (Oracle Docs, viewed 2026)
- TIS adds new functions to manage supplier on-time delivery rate, defect occurrence rate and more to its LinDo Purchasing Cloud Service for manufacturers (Cloud Watch, in Japanese, 2019)
- Key Points for Selecting a Production Management System EXPLANNER/Jx (NEC, in Japanese, viewed 2026)


