


When delivery delay prevention never gets past the morning meeting
Walk into enough Japanese-owned plants in Thailand and you start to notice a pattern. Delivery delay prevention exists, but it lives entirely inside the morning meeting and the weekly review. Late jobs get read out, the owner explains what happened, someone promises to catch up. Next week the list looks much the same.
The countermeasures themselves are usually not the problem. The problem is that the delay was recognised so late that the only remaining levers are overtime and pulling people off other lines.
Delivery delays are rarely events. They are almost always situations that had visible warning signs several days earlier, and those signs simply never reached the person who could have acted on them. This article breaks the problem into four root causes, then maps each one to a specific capability in a process management or production scheduling system, with the Thai operating environment taken into account.
The four root causes behind most delivery delays
Smart-go.net, a Japanese process management system vendor, groups the main causes of manufacturing delivery delays into four categories. The explanations you hear on the floor, usually some version of “we are short of people” or “an urgent order came in”, almost always reduce to one of these.
| Root cause | What is actually happening | How it sounds on the floor |
|---|---|---|
| Late progress visibility | Daily-report-based collection means problems surface the next day or later | “I totalled yesterday’s sheets this morning and we are behind” |
| Uneven load distribution | The bottleneck process is not visible, so the delay propagates downstream | “Work in progress always piles up in front of that machine” |
| Rush order handling | Manual replanning takes several hours to half a day, spreading delay to other jobs | “A hot order came in so everything else moved back” |
| Person-dependent due date quoting | Answers rely on experience and intuition, and vary by who is asked | “Only the veteran can give a delivery date” |
These four look independent but they compound. Because progress is invisible, the load imbalance goes unnoticed. Because the imbalance is unnoticed, a rush order lands on top of an already loaded process. And because the quote was given from memory rather than from the current load, the promise was unachievable the day it was made. Fixing only one of the four rarely moves the needle, precisely because of this chain.
Root cause 1 – late progress visibility cuts your options in half

This is the deepest one. In most plants an operator writes results on a paper daily report, an administrator collects the sheets after the shift, and someone transcribes them into a spreadsheet the following morning. Under that flow, the fact that a process started slipping reaches the manager somewhere between half a day and a full day after it happened.
A one-day lag does not sound dramatic. What matters is how much it shrinks the set of available responses. A slip caught the same day might have been absorbed with a few hours of overtime or help from the adjacent line. The same slip discovered the next morning leaves only the heavier options, such as resequencing downstream operations, which carry their own side effects.
In practice, delivery delay prevention is decided less by the quality of the countermeasure than by how many hours it took to notice.
There is a second problem with paper reports. Results written from memory at the end of the shift tend to be rounded, and the timeline of when work actually started and stopped is lost. You end up accumulating data that supports totals but cannot support any analysis of why the delay occurred.
Root cause 2 – uneven load, because a bottleneck you cannot see is a bottleneck you cannot move
In a plant where process load is not expressed in numbers, the only way to judge this week’s constraint is by feel. Everyone notices the process with work in progress stacked in front of it. Nobody notices the process that will be swamped three days from now, because nothing has accumulated there yet.
What makes load imbalance dangerous is that late responses always propagate. Work in progress that sits at the bottleneck for one day pushes every downstream operation back by a day. By the time the final process notices, there is no room left upstream to absorb it.
Root cause 3 – rush orders, where the replanning time is itself a source of delay
Urgent orders and specification changes are unavoidable in make-to-order plants. What matters is how they are absorbed. Where planning is redone by hand, replanning for a single rush job is described as taking several hours to half a day. During that window the plan is effectively suspended.
The quality of that hurried replan is also unreliable. A schedule rebuilt under pressure accounts for the few visibly affected jobs and misses those affected indirectly. The result is that the rush order ships on time while several other jobs quietly slip. Because the damage is distributed, the cause becomes hard to identify, and the month closes with a vague conclusion that things were somehow tight.
Root cause 4 – person-dependent quoting is where unachievable promises are born
In many plants the delivery date a salesperson receives depends on who they asked. The experienced plant manager answers conservatively from years of pattern recognition. A younger engineer answers with the date the customer hoped for. Neither answer is grounded in the actual current load.
Quote too conservatively and you lose the order. Quote too aggressively and you miss the date. That spread is not a personality issue, it is the predictable result of nobody being given data to answer from. A plant that runs a delivery delay prevention programme without touching the quoting process is trying to close the exit while leaving the entrance wide open.
External volatility is exactly why internal precision matters
The environment around manufacturing in Thailand has become visibly less predictable in recent years. According to a JETRO analysis published on 12 November 2025, Thailand’s total trade value grew at an average of 6.5 percent per year between 2000 and 2024, while the composition of its trading partners shifted substantially. China’s share expanded from 4.7 percent in 2000 to 19.1 percent in 2024, while Japan’s share fell from 19.5 percent to 8.6 percent. The same analysis notes that Thailand has run a trade deficit since 2022. On the export side, transport equipment grew from 3.6 percent to 11.2 percent of the total.
When the sourcing mix changes, the lead time assumptions built on it change too. If a component moved from a long-standing Japanese supplier to a newer supplier in China or within ASEAN, the variability of its arrival dates cannot be estimated from historical performance.
Logistics itself has added volatility. Reporting on the effects of the Thailand-Cambodia border conflict, Logistics Viewpoints wrote on 7 January 2026 that the disruption has raised logistics costs by more than 30 percent and extended transit times by two to four days. On the domestic side, Nation Thailand has reported that factory closures in Thailand rose 58 percent in early 2026, with stagflation risk being flagged.
None of this is within the control of an individual plant. That is precisely what makes internal precision valuable. You cannot stop a component from arriving two days late. Whether you can rebuild the downstream plan the moment you learn it will be two days late is entirely a function of how your process management is designed. The wider the external swings, the more your on-time delivery rate depends on internal reaction speed.
Countermeasure 1 – real-time progress tracking changes the unit of data collection
The response to root cause 1 is to change when and in what unit results are captured. Replace the daily report, which is one bulk entry per day, with a record at the start and end of each operation. In practice this usually means operators scanning a QR code on the work order with a smartphone or tablet and stamping start and completion.
Once that changes, the manager’s screen shows operations in progress in real time. An operation running longer than planned is identifiable while it is still running, not after it finishes. The starting point of delay response moves from “tomorrow morning’s totals” to “an anomaly happening now”.
The main design decision at implementation is granularity. Finer capture gives richer data but adds operator effort, which produces missed scans. A workable approach is to start with only the few processes where delays originate, capture just two points per operation, and expand once the routine is established. The common failure mode is rolling out to every process at once and then staring at a screen where half the data is missing.
| Collection method | Time until the manager sees it | Analytical value |
|---|---|---|
| Paper report transcribed next morning | Half a day to one day | Totals only, timeline is lost |
| Daily spreadsheet entry | Several hours to one day | Trends at process level |
| Terminal scan at each event | Near immediate | Start and stop times support root cause analysis |
Production results management is not a single-purpose mechanism. The same data feeds cost accounting, equipment utilisation analysis and standard time revision. Build the collection layer properly once and it becomes the shared foundation for everything that follows.
Countermeasure 2 – Gantt charts make load visible

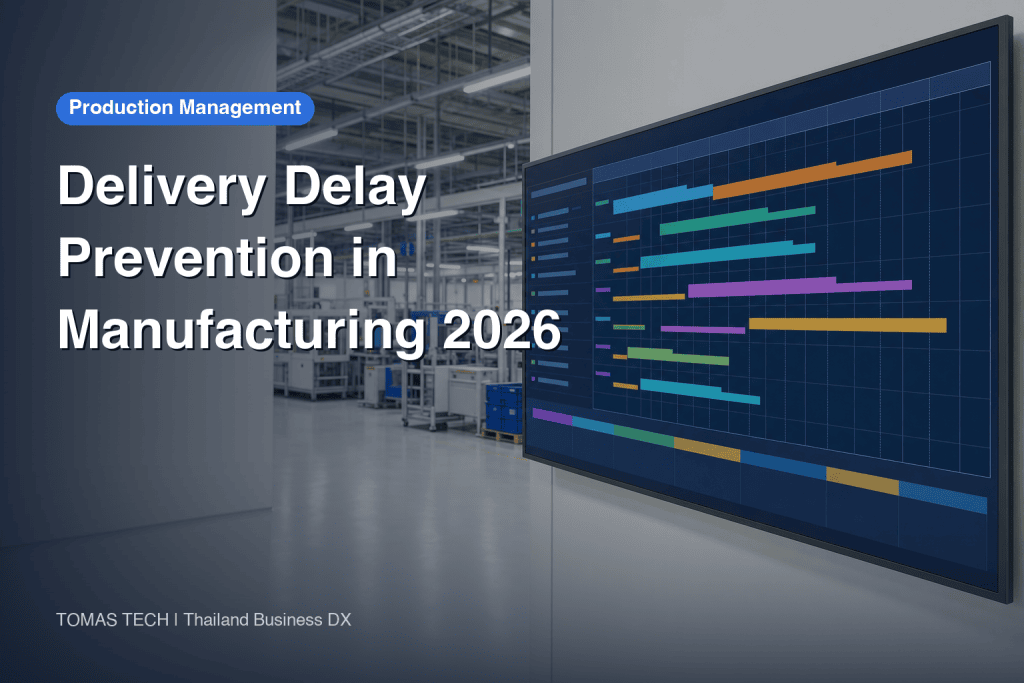
The standard response to root cause 2 is to plot load per process along a time axis. A Gantt view of every machine and operation makes the peaks obvious at a glance.
The value of a Gantt chart lies less in finding operations that are already late and more in finding operations that are about to be. If you learn today that a particular machine will exceed capacity next Wednesday, you still have options such as subcontracting, pulling work forward, or negotiating the date with the customer. Learn the same fact next Wednesday and the only option left is overtime.
There is a second effect that plants report more often than the first. Meetings change character. When everyone is looking at the same load picture, the exchange of subjective claims about how busy each area is gives way to concrete negotiation about which days of which operation move where. Shorter production meetings are one of the more reliably reported benefits of process visualisation.
How far to take that visualisation depends on budget, and the two questions are best considered together. Our breakdown of implementation formats and costs is in process management system cost and selection guide, which is the right reference while you are still sizing the investment.
Countermeasure 3 – automatic rescheduling for rush orders

The answer to root cause 3 is to automate plan regeneration. An automatic scheduler holds the constraints in advance, including machine capacity, operator skill, changeover time and material arrival dates, and recalculates the whole schedule the moment a new order lands. Replanning that consumed half a day by hand finishes in minutes when the constraint model is in place.
The real value is not raw speed but completeness. A human rebuilding a schedule under time pressure looks only at the prominent jobs. The system recalculates every job equally. Because you can see which orders move by how many days before you accept the rush job, a genuinely useful decision becomes available, such as accepting it while proactively renegotiating one specific customer date.
AI-assisted scheduling is also widely discussed as an industry trend, and cases of demand-variability-aware planning have been presented. The improvement figures quoted in such cases vary enormously with the underlying assumptions, so they should not be adopted as your own projections. At the evaluation stage, it is far more reliable to judge how completely a tool can express your actual constraints than to compare the benefit percentages in its marketing.
Faster replanning also shortens total lead time. If reducing the delivery window itself is the goal rather than simply protecting the promised date, the approach to compressing inter-process waiting is covered in manufacturing lead time reduction systems.
Countermeasure 4 – quote delivery dates from data
The countermeasure for root cause 4 is to move the basis of a quote from memory to measured data. With historical results and current load in one place, an answer can be constructed from concrete components, namely the average duration this product takes at each process and the date each of those processes next has capacity.
The gain is not only accuracy. It is explainability. When you can show a customer why a date is what it is, the conversation shifts away from being pushed into an impossible compression and towards realistic adjustments such as split shipments or partial early delivery of critical items. It also reduces the standing friction between sales and the plant.
Defining on-time delivery rate before you try to improve it
One decision needs to be made before any of the above, and it is the definition of the on-time delivery rate itself. Start improvement work with an ambiguous definition and you will not be able to tell whether the number moved because performance improved or because the reporting convention drifted.
The first choice is the reference date. Do you measure against the date the customer originally requested, the date your company committed at order acceptance, or the most recent date after any mutually agreed change. The same shipment history produces very different rates under each. A surprising number of plants use the third option without having consciously chosen it, which creates a mechanism where revising a date whenever a job looks late pushes the metric towards 100 percent.
| Reference basis | Character of the number | Best used for |
|---|---|---|
| Customer’s original requested date | Strictest, exposes the gap between sales promises and capacity | Reviewing order acceptance policy |
| Date committed at order acceptance | Honest measure of the plant’s ability to execute its own plan | Primary metric for process improvement |
| Latest revised date | Flattering, tends to diverge from how the floor feels | Supplementary customer reporting |
For process improvement, the second option is the one that matches reality. Whether you kept the promise you yourself made is the most direct question an improvement programme can ask.
Next, decide the counting unit. Counting by order, by shipment, or by quantity produces different numbers. In a plant with frequent split deliveries, counting by order makes a partial delay on a large job look small. Finally, decide in advance how partial shipments are treated. If 90 of 100 units ship on time and 10 arrive three days late, whether that counts as met or missed will swing the monthly figure by several points. There is no universally correct definition, but there is one rule that matters, which is not changing the definition midway.
Record a reason code on every delay
A plant that records only the fact that a job was late has nothing to work with six months later. If you are building a results collection mechanism, build the delay reason classification into it at the same time.
Keep the code list short. Material arrival delay, equipment trouble, rework due to quality defects, plan change or rush insertion, staffing shortage, and customer-side reasons. Six categories are enough to reveal the pattern. With twenty categories the person entering the data hesitates, and everything ends up in the other bucket.
After roughly three months the distribution becomes visible, and it is usually lopsided. It is common for more than half of all delay incidents to trace back to one or two causes. Only at that point can an investment decision be made properly. If material arrival delays account for half your incidents, the first thing to fix may be reorder points on the procurement side rather than the process management system.
Reason codes only need to be entered on jobs that actually slipped. Requiring an entry on every order creates effort that hollows out the practice. Recording only the late ones means a handful to a dozen or so entries a month, which is a habit that survives.
What matters specifically in Thai plants
Japanese-owned plants in Thailand operate under conditions that differ from those in Japan, and those differences shape how delivery management should be designed.
The first is workforce turnover. Where retention is hard to predict, process knowledge held in an experienced person’s head does not accumulate as an asset, and it leaves when they do. If measured results and standard times exist as a system, a less experienced planner can still build a workable schedule. Removing person-dependency in Thailand is closer to a business continuity requirement than to a simple efficiency gain.
The second is the working calendar. Thai public holidays do not align with Japanese ones, and there are extended shutdown periods such as Songkran. When the parent company’s operating days and local operating days diverge, leaving delivery date arithmetic to mental calculation produces errors of several days with very little effort. Simply holding the calendar in the system removes an entire class of avoidable delay.
The third is language. Information moves through four layers, namely floor operators, Thai staff, Japanese managers and the head office in Japan, and it thins out at each translation. A mechanism that lets people share status through numbers and a shared screen reduces the number of relay steps in the first place.
What to look for when selecting a delivery management system
Rather than comparing feature matrices side by side, it is faster to first confirm which root cause your delays cluster around and then shortlist products strong in that area.
| Your dominant symptom | Capability to prioritise |
|---|---|
| Delays are discovered the next day or later | Terminal-based result capture with real-time display |
| Work in progress accumulates at specific processes | Load display by process and Gantt charting |
| Every rush order breaks the plan | Automatic scheduler with impact simulation |
| Quoted dates depend on who is asked | Delivery date simulation based on actual results |
One additional item is non-negotiable in a Thai plant, which is Thai language support on shop floor terminals. Put a screen the operators cannot read in front of them and scanning will not take hold, which means the data will have gaps. The moment the data has gaps, every countermeasure above stops working.
Data integration with the existing core system deserves an early check as well. If order data has to be keyed in twice, entry lag becomes plan lag and the real-time capability you paid for disappears.
Roll out in stages, and avoid automating waste
In its report on the Monozukuri Strategy Forum ASEAN 2026, published on 28 April 2026, THAIBIZ described Denso pointing out that automating wasteful processes does not strengthen sustainable competitiveness while the underlying inefficiency remains, and recommending a staged approach to lean automation.
That applies directly to delivery management systems. A plant with an internal approval flow that stalls jobs for three days will, after digitising that flow, have a three-day wait rendered in software. Before implementing, separate whether your delays originate in the business process or in the speed of information transfer. If it is the former, fix the process first and let the system follow.
The same report offers useful points on adoption. It cites a case where video manuals reduced new-hire training from five months to one month, and cases where multilingual support removed language barriers. In Thai plants, where staff turnover is a constant, the effort required to teach a new mechanism largely determines whether it survives. Recording the operating steps as short videos can matter as much as the system rollout itself.
When the numbers actually move
The question everyone evaluating an implementation wants answered is when the effect appears. Smart-go.net reports that companies commonly experience the benefits of visibility within one to three months, with improvements in the on-time delivery rate appearing as measurable numbers at around the six month mark.
There is a reason for that gap. What the first one to three months delivers is a state of being able to see, not a reduction in delays. Acting on what became visible, embedding those actions as routine, and having the result show up in a monthly rate takes several more months. Treating a flat number at month three as failure means stopping just before the benefit arrives.
When presenting internally, share this two-stage pattern up front. For the short term, set the evaluation metric to something upstream, such as the time taken to recognise a delay or the scan completion rate, rather than the on-time delivery rate itself.
Frequently asked questions
What causes delivery delays in manufacturing
Behind the familiar explanations of labour shortage and sudden orders sit four structural causes, namely late progress visibility, uneven load between processes, manual replanning for rush jobs, and person-dependent due date quoting. Labour shortage is sometimes genuinely the cause, but even then you cannot justify adding headcount without numbers showing which process is short and by how much. Separating the causes is the practical first step.
Where should progress tracking in manufacturing start
Start where the delays originate rather than everywhere at once. List the last ten or so late jobs and count the process at which each first diverged from plan. The answers usually concentrate in two or three processes. Introduce result capture there, stabilise the routine, then expand upstream and downstream.
How granular should production results management be
Capturing start and completion at the process level is a realistic starting point. Finer granularity, such as per operator or splitting changeover from run time, is not essential in the early stages of delay reduction. Higher granularity increases scanning effort and creates a new problem in the form of missed entries. Build a dataset with no gaps first, then increase granularity once you know which question you want to analyse.
Will a delivery management system eliminate delays
No. What a system does is show the warning signs earlier and reduce the effort of replanning. Business-side problems such as slow approval routes or reorder points that no longer match reality will still be there afterwards. What changes is that you can see where the days are being lost, which makes those business-side problems far easier to isolate.
Are spreadsheets sufficient for progress management
Spreadsheets stop working when updating becomes the responsibility of one fixed person and nobody sees current status until that person types it in. With a small number of processes and a once-a-day update cycle, a spreadsheet is genuinely adequate. Once you need to see multiple lines or sites at the same time, or want results submitted directly from the floor, a shared file cannot keep up. The threshold is not plant size but the number of people updating and how often.
What if the shop floor resists the new system
Most resistance comes from the sense that effort increases while nothing comes back. If scanned data also flows to a floor-facing screen showing progress on their own process and tomorrow’s schedule, reception changes markedly. Building only a management-facing view in the early phase, while asking the floor for input alone, almost guarantees a falling scan rate. Aligning who bears the effort with who receives the benefit at design time is the condition for adoption.
Is this worth doing in a small plant
Yes, and arguably more so. In a smaller plant one person covers several processes, so load imbalance translates directly into missed dates. What matters at small scale is not the breadth of features but whether operators can reliably record their work. Starting with a minimal configuration and adding capability as needs emerge fits this situation well.
Summary
Delivery delay prevention is not a question of how to recover a late job. It is a question of how many hours it takes you to know. Once the causes are separated into late progress visibility, uneven load, rush order handling and person-dependent quoting, the corresponding countermeasures become specific and decidable.
The external environment around manufacturing in Thailand is swinging more widely, driven by shifts in trade structure and logistics disruption. You cannot stop external variation, but the ability to learn about it quickly and rebuild the plan around it is something you build internally. That is where on-time delivery performance will increasingly diverge between plants.
For rollout, resist the urge to cover every process from day one. Begin result collection where delays concentrate, confirm the visibility benefit, and expand from there. Expect around six months before the improvement shows in the rate itself, and measure short-term progress with upstream indicators such as recognition time and scan completion.
TOMAS TECH supports Japanese manufacturers in Thailand and across ASEAN in building process management and results collection, including the PEGASUS production management system. If you would like help separating which root cause your delays actually fall under, or simply want to talk through where to start, early-stage conversations are welcome. We will listen to your current situation and lay out the realistic options. Feel free to reach us through our contact page.
References
- How to prevent delivery delays through process management – smart-go.net
- Fundamentals of delivery date management – KIC-net
- Analysis of structural change in Thailand’s trade, 12 November 2025 – JETRO
- How the Thailand-Cambodia border conflict is creating ripple effects across global manufacturing supply chains, 7 January 2026 – Logistics Viewpoints
- Report on the rise in factory closures in Thailand – Nation Thailand
- Monozukuri Strategy Forum ASEAN 2026 report, 28 April 2026 – THAIBIZ
- Commentary on AI-assisted production scheduling


