


Head office says, “We only see the Thai plant’s costs once a month,” or “Please explain the reasons for the variances.” Many plants are caught between standard costs built once a year in Excel and an “other variances” line that grows every month. A standard costing system may look like the answer, but a system can only calculate within the formulas you have decided in advance and the data you have collected.
This article makes one argument. Standard costing is decided less by “building the standards” and more by designing data collection so that variances can be explained. Specifically, it comes down to six points.
- Variances are useless unless they can be broken down. Split them into materials (price and quantity), labor (rate and efficiency) and manufacturing overhead (spending, efficiency and volume), and agree on a single set of formulas and sign conventions across the company.
- To break variances down, you need to collect actual consumption, labor hours and machine hours by product or by production order. Whether a system implementation succeeds is decided by actual data collection.
- Standards rest on “moving assumptions” such as the minimum wage, electricity tariffs (Ft) and exchange rates. Decide the revision frequency and the triggers in advance.
- For accounting purposes, IAS 2 permits the standard cost method to be used for convenience if the results approximate actual cost, and requires standards to be reviewed regularly. Decide how variances are treated with your audit firm and accountants.
- Compare the standard costing functions of ERP vendors on “version control of standards,” “cost estimates and release,” and “variance accounts and level of breakdown.”
- Then write in your RFP “which variances you want to see, at what level, and when,” and verify the recalculation of variances during acceptance testing.
Note that this article does not recommend or rank any specific product. The worked example in the second half uses illustrative numbers chosen for explanation and does not represent an actual plant. For final decisions on tax and accounting, always check with your own accountants and audit firm.
What Is Standard Costing: Differences from Actual Costing and Its Purpose
Standard costing is a method in which you determine in advance the cost that “should” be incurred to make one unit of a product (the standard cost), then capture and analyze the difference from the cost actually incurred (the cost variance). AccountingTools, a US accounting explainer site, defines standard costing as “the practice of substituting an expected cost for an actual cost in the accounting records” (article dated January 9, 2026).
From the perspective of purpose, the differences from actual costing are as follows.
| Aspect | Actual costing | Standard costing |
|---|---|---|
| Product cost value | Fixed by totaling actual amounts at period end | Valued immediately at the standard unit cost set at the start of the period |
| When cost becomes known | After month-end closing | As soon as production actuals are entered (on a standard basis) |
| Management focus | “How much did it cost?” | “Where did it deviate from the standard?” |
| Treatment of variances | The concept of variance is not central | Variances are broken down by type to identify causes and responsible departments |
| Prerequisite | Accuracy of actual data | Accuracy of actual data plus validity of the standards |
Japan’s Cost Accounting Standards (原価計算基準, Genka Keisan Kijun), an interim report issued by the Business Accounting Council of the Ministry of Finance on November 8, 1962, cover standard costing in Chapter 3 “Calculation of standard costs,” Chapter 4 “Calculation and analysis of cost variances,” and Chapter 5 “Accounting treatment of cost variances.” It is also worth noting that the Standards themselves state that they do not uniformly prescribe the procedures of individual companies. In other words, each company has room to design which variances to separate and to what extent, according to its own management purposes.
Standard costing has three main purposes.
- Cost control: Break down the difference between standard and actual by type (materials, labor and overhead) and trace the causes
- Budgeting: Build up the standards to form the basis of next period’s manufacturing cost budget and selling prices
- Valuation of inventory and cost of goods sold: Value inventory and cost of goods sold at standard without waiting for actual costs to be finalized
On the other hand, standard costing also has weaknesses. AccountingTools lists as drawbacks that in a fast-changing environment standards can become outdated within “a month or two,” that it can encourage inappropriate behavior such as purchasing staff over-buying to make the price variance look good, and that feedback is slow. When a plant in Thailand complains that “the standards are out of date and the variances are meaningless,” it is exactly these weaknesses coming to the surface.
Cost Variance Analysis: The Big Picture
The starting point of cost variance analysis is not to look at the “total variance” as a single number. The total variance splits into three parts (direct materials, direct labor and manufacturing overhead), and each of these further splits into two to four types of variance.
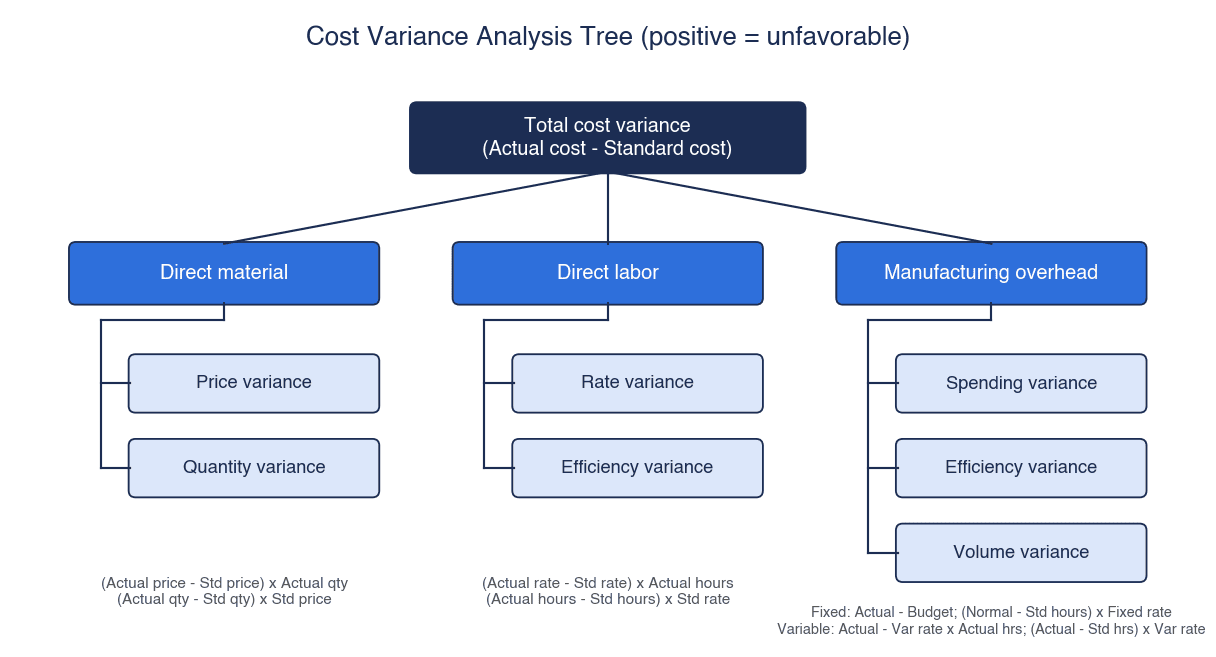
In this article, variances are calculated as “actual minus standard,” with positive values meaning unfavorable variances (actual exceeded standard) and negative values meaning favorable variances. AccountingTools and the OpenStax managerial accounting textbook write their formulas in this direction, but some materials, such as ACCA-related study materials, use “standard minus actual,” which reverses the sign of the same variance. If you do not settle on one set of formulas and signs within the company, accidents happen where head office and the plant, or accounting and production, read the same number with opposite meanings.
| Category | Variance | Formula (positive = unfavorable) | Example of main responsible department |
|---|---|---|---|
| Direct materials | Price variance | (Actual unit price − Standard unit price) × Actual quantity used | Purchasing |
| Direct materials | Quantity variance | (Actual quantity used − Standard quantity) × Standard unit price | Production |
| Direct labor | Rate variance | (Actual rate − Standard rate) × Actual labor hours | HR, Production |
| Direct labor | Efficiency (labor hours) variance | (Actual labor hours − Standard labor hours) × Standard rate | Production |
| Manufacturing overhead (variable) | Spending variance | Actual variable overhead − Standard variable overhead rate × Actual hours | Each department |
| Manufacturing overhead (variable) | Efficiency variance | (Actual hours − Standard hours) × Standard variable overhead rate | Production |
| Manufacturing overhead (fixed) | Spending (budget) variance | Actual fixed overhead − Budgeted fixed overhead | Each department |
| Manufacturing overhead (fixed) | Volume variance | (Normal capacity − Standard hours for actual output) × Fixed overhead rate | Sales, Production planning |
The “standard quantity,” “standard labor hours” and “standard hours” here are all standards for the actual output. If you planned to make 100 units but made only 90, you compare against the standard for 90 units, not the standard for 100 units. If you get this wrong, every drop in output turns into a favorable variance, appearing as “we saved materials” or “labor hours were short.”
The responsible department column is only an example. For instance, a material quantity variance can arise not only from shop-floor yield but also when purchasing brought in a cheaper substitute material that led to more defects. Rather than mechanically linking each variance type to one department, it is more realistic to use the column as “the department to ask for an explanation first.”
Direct Material Variances: Price and Quantity Variance
Material variances separate a purchasing issue (how much you paid) from a production issue (how much you used). Section 46 of the Cost Accounting Standards divides the direct material cost variance into a price variance and a quantity variance, defining the price variance as the difference in consumption price multiplied by the actual quantity consumed, and the quantity variance as the difference in quantity consumed multiplied by the standard price.
The formulas are as follows.
- Price variance = (Actual unit price − Standard unit price) × Actual quantity used
- Quantity variance = (Actual quantity used − Standard quantity for actual output) × Standard unit price
- Direct material cost variance = Actual unit price × Actual quantity used − Standard unit price × Standard quantity = Price variance + Quantity variance
In this article’s worked example (illustrative numbers), we assume the following for the main material in a given month.
| Item | Standard | Actual |
|---|---|---|
| Unit price (baht/kg) | 100 | 104 |
| Quantity used (kg) | 1,000 (standard for actual output) | 1,050 |
| Amount (baht) | 100,000 | 109,200 |
- Price variance = (104 − 100) × 1,050 = 4,200 baht (unfavorable)
- Quantity variance = (1,050 − 1,000) × 100 = 5,000 baht (unfavorable)
- Total = 109,200 − 100,000 = 9,200 baht (unfavorable) = 4,200 + 5,000
The key point is to use the “actual quantity used” to calculate the price variance and the “standard unit price” to calculate the quantity variance. This way, the portion where the price difference and the quantity difference overlap (4 baht × 50 kg = 200 baht) falls into the price variance, and the sum of the two variances always matches the total variance.
Another design decision is when to capture the price variance. Section 46 of the Cost Accounting Standards defines the “material purchase price variance,” which arises from recording the receipt price of materials at the standard price, as (standard price − actual price) × actual quantity received (the Standards do not prescribe the direction of the difference, that is, the sign, so this article aligns it to “actual minus standard”). The AccountingTools purchase price variance is also a formula multiplied by the actual quantity purchased.
- Capturing at receipt: The price variance is fixed when goods are received, and inventory is carried at the standard unit price. The results of purchasing are visible immediately, but variances on inventory not yet consumed also appear in the current month.
- Capturing at consumption: Price variances arise only for the quantity issued to production. The link to product cost is easy to understand, but inventory must be carried at the actual unit price, which adds to system management.
Which method you choose changes the inventory valuation settings in the ERP, the performance indicators for purchasing, and how the monthly variance report looks. In the RFP, state first which method you assume.
Typical causes of quantity variances are worse yield, defects and rework, trial runs during setup, and errors in the standard usage quantities in the BOM (bill of materials) itself. The last one, “errors in the standard,” is surprisingly common: the BOM was not updated after a design change, or offcuts and cutting allowances were not included in the standard, so the same unfavorable variance keeps appearing every month. For items where the quantity variance appears every month with the same sign and the same magnitude, it is worth suspecting the standard before suspecting the shop floor.
Direct Labor Variances: Rate and Efficiency Variances
Labor variances separate “what the wage rate was” from “how many hours it took.” Section 46 of the Cost Accounting Standards divides the direct labor cost variance into a rate variance and a labor hours (efficiency) variance, and states that they are to be analyzed by department or by type of work.
- Rate variance = (Actual rate − Standard rate) × Actual labor hours
- Efficiency (labor hours) variance = (Actual labor hours − Standard labor hours) × Standard rate
- Direct labor cost variance = Rate variance + Efficiency variance
In the worked example, the standard rate is set at 50 baht/hour. This is Bangkok’s daily minimum wage of 400 baht, effective July 1, 2025, divided by an assumed 8-hour day.
| Item | Standard | Actual |
|---|---|---|
| Rate (baht/hour) | 50 | 52 |
| Labor hours (hours) | 800 (standard for actual output) | 820 |
| Amount (baht) | 40,000 | 42,640 |
- Rate variance = (52 − 50) × 820 = 1,640 baht (unfavorable)
- Efficiency variance = (820 − 800) × 50 = 1,000 baht (unfavorable)
- Total = 42,640 − 40,000 = 2,640 baht (unfavorable) = 1,640 + 1,000
Cautions When Deriving the Standard Rate from the Minimum Wage
Working back from the minimum wage to set the standard rate is easy to understand, but used as-is it will diverge from the actual rate. That is because the hourly labor cost a company actually pays includes allowances, overtime and shift premiums, and the employer’s share of social security. AccountingTools also cites overtime premiums, shift differentials, and standards that do not reflect current wage levels as causes of rate variances.
In addition, actual wages at Japanese-affiliated companies are not the same as the minimum wage. According to JETRO’s “FY2025 Survey on Business Conditions of Japanese-Affiliated Companies Overseas (Asia and Oceania),” the monthly base salary for manufacturing workers in Thailand averaged USD 490 among responding companies as of August 2025 (median 463, 228 valid responses). By region, the average was USD 581 in Bangkok, USD 481 in the EEC (Chonburi, Rayong and Chachoengsao), and USD 465 elsewhere. These are averages of responses from Japanese-affiliated companies and do not indicate the level at any individual plant, but you should expect that a standard rate set as “minimum wage ÷ 8 hours” is likely to come out lower than the actual rate.
In practice, building the standard rate as follows makes the rate variance easier to explain.
- Base salary (or daily wage) converted to an hourly figure
- Fixed allowances converted to an hourly figure
- Employer’s share of social security and similar contributions
- For overtime premiums, choose whether to include them by setting a standard overtime ratio, or to exclude them and see them as a variance
There is no single right answer for the last item, overtime. If you include it, the rate variance becomes smaller; if you exclude it, it becomes visible in the form “in months with more overtime, the rate variance turns unfavorable.” Decide according to what you want to manage, and write it into the RFP and the operating rules.
The accuracy of the efficiency variance is decided by whether labor hours can be collected by product, order and process. If you can only capture total attendance hours, the efficiency variance can only be produced for the plant as a whole. At what granularity to record labor hours and how to reconcile them with attendance is covered in detail in our article on implementing a labor hour management system.
Manufacturing Overhead Variance: Spending, Efficiency and Volume Variances
The manufacturing overhead variance is the part of variance analysis where practices differ the most. Section 46 of the Cost Accounting Standards defines the manufacturing overhead variance as the difference between the standard amount and the actual amount incurred, and states that it is to be analyzed “as appropriate” into efficiency, volume, budget variances and so on. In Japan’s formula-based flexible budget approach, there is also a practice of taking the volume variance as “the difference between the base activity level and the actual activity level.”
In this article, after separating variable and fixed costs, we standardize on the following formulas, following the four categories presented by AccountingTools.
- Variable overhead spending variance = Actual variable overhead − Standard variable overhead rate × Actual hours
- Variable overhead efficiency variance = (Actual hours − Standard hours for actual output) × Standard variable overhead rate
- Fixed overhead spending (budget) variance = Actual fixed overhead − Budgeted fixed overhead
- Fixed overhead volume variance = (Normal capacity − Standard hours for actual output) × Fixed overhead rate
The assumptions for the worked example (illustrative numbers) are as follows. The allocation base is machine hours.
| Item | Value |
|---|---|
| Budgeted fixed overhead | 500,000 baht |
| Normal capacity | 10,000 machine hours |
| Fixed overhead rate | 50 baht/hour (500,000 ÷ 10,000) |
| Variable overhead rate | 30 baht/hour |
| Standard hours for actual output | 9,000 machine hours |
| Actual machine hours | 9,400 hours |
| Actual fixed overhead | 520,000 baht |
| Actual variable overhead | 290,000 baht |
- Fixed overhead spending variance = 520,000 − 500,000 = 20,000 baht (unfavorable)
- Volume variance = (10,000 − 9,000) × 50 = 50,000 baht (unfavorable)
- Variable overhead spending variance = 290,000 − 30 × 9,400 = 290,000 − 282,000 = 8,000 baht (unfavorable)
- Efficiency variance = (9,400 − 9,000) × 30 = 12,000 baht (unfavorable)
- Total = 20,000 + 50,000 + 8,000 + 12,000 = 90,000 baht (unfavorable)
As a check, compare the actual amount incurred with the standard amount applied. The actual amount incurred is 520,000 + 290,000 = 810,000 baht, and the standard amount applied is (50 + 30) × 9,000 = 720,000 baht, a difference of 90,000 baht. This matches the sum of the four variances.
The Volume Variance Is Not “Shop-Floor Efficiency”
The volume variance is the fixed overhead that could not be fully absorbed because actual output fell short of the normal capacity (here, 10,000 hours) used to allocate fixed overhead. In the worked example, the standard hours for actual output were 9,000 hours, 1,000 hours below normal capacity, so 1,000 × 50 = 50,000 baht was left unabsorbed.
This variance did not arise because the shop floor was slow. The main cause is that the volume of orders or the production plan did not reach normal capacity. AccountingTools also points out that, because fixed overhead cannot be managed through production volume in the short term, the fixed overhead volume variance can be misleading.
For reference, according to a report in The Nation on the Manufacturing Production Index (MPI) of Thailand’s Office of Industrial Economics (OIE), the capacity utilization rate of Thai manufacturing as a whole was 57.61% in June 2026. This is a figure for manufacturing as a whole and is different from the normal capacity of any individual plant, but it suggests that when utilization is low, allocating fixed overhead based on normal capacity is likely to produce large unfavorable volume variances.
In systems and reports that do not show the volume variance as a separate line, unabsorbed overhead caused by lower orders gets lumped into “unfavorable manufacturing overhead variance” and looks like the shop floor’s responsibility. In the RFP discussed later, we make it a requirement that the volume variance is always shown separately.
Setting Standard Costs: Materials, Labor Hours and Overhead Rates
Setting standard costs means multiplying a “quantity standard” by a “price standard” for each of materials, labor and manufacturing overhead. Paragraph 21 of IAS 2 states that standard costs take into account normal levels of materials and supplies, labor, efficiency and capacity utilization. The benchmark is the “normal level,” not ideal maximum efficiency and not an average of past poor performance.
| Element | Quantity standard | Price standard | Main information sources |
|---|---|---|---|
| Direct materials | Standard usage in the BOM (state whether yield, cutting allowances and offcuts are included) | Standard purchase price (contract price, exchange rate assumption, treatment of freight) | BOM, purchase contracts, exchange rate assumptions for imports |
| Direct labor | Standard labor hours in the routing (separate setup time and run time) | Standard rate (base pay, allowances, employer contributions, treatment of overtime) | Routing, work measurement, HR wage data |
| Variable manufacturing overhead | Standard quantity of the allocation base (machine hours, etc.) | Variable overhead rate (electricity, consumables, etc.) | Actual machine hours, electricity tariffs, actual consumables |
| Fixed manufacturing overhead | Allocation base quantity at normal capacity | Fixed overhead rate (budgeted fixed overhead ÷ normal capacity) | Annual budget, equipment capacity, production plan |
Here are issues that often come up when setting standards.
Quality of the BOM and routing. The quantity standards in standard costs are built up from the BOM and routing. If the master data does not match reality, the standard itself is wrong, and no amount of variance breakdown will be meaningful. In standard costing implementation projects, it is not unusual to spend the first few months cleaning up the master data.
Treatment of setup time. In high-mix, low-volume plants, setup time can affect cost as much as run time. Whether you hold setup time in the standard as a fixed time per lot or allocate it per unit changes how the efficiency variance appears when lot sizes change. For master data design in plants with many product types, our article on production management systems for high-mix low-volume manufacturing may also be helpful.
Choice of allocation base. Machine hours are a candidate allocation base for machining-centered operations, and direct labor hours for assembly-centered operations. For processes with high electricity consumption, holding electricity as a separate variable overhead rate makes it easier to isolate the impact of Ft revisions.
Determining normal capacity. If normal capacity, the denominator of the fixed overhead rate, is set at theoretical maximum capacity, the fixed overhead rate becomes low and large unfavorable volume variances appear every month. Conversely, if it is set at recent low actuals, the fixed overhead rate becomes high and drifts away from the “allocation based on normal capacity” required by paragraph 13 of IAS 2. Normal capacity is a value that should be agreed not only by accounting but also with production planning and sales.
Exchange rate assumptions. The standard unit price of imported materials is built by multiplying the foreign-currency contract price by an exchange rate assumption. Unless you record which day’s rate, and which rate, was used as an attribute of the standard, you will not later be able to separate the exchange rate factor from the supplier price increase factor within the price variance.
When to Revise Standards: Moving Assumptions in Thailand
Section 42 of the Cost Accounting Standards states that standard costs “must be standards that reflect current conditions” for every purpose: cost control, budgeting, and calculating inventory values and cost of goods sold. It then states that revision is necessary when basic production conditions such as equipment or production methods change significantly, or when price factors such as material prices or wage rates change significantly, and calls for their appropriateness to be reviewed periodically.
For plants in Thailand, typical assumptions behind the standards that move due to external factors are the minimum wage, electricity tariffs and exchange rates. Here are the main values we could confirm as of October 2026.
| Assumption | Confirmed value | Date and scope | Impact on standards |
|---|---|---|---|
| Minimum wage (January 2025 revision) | 337 to 400 baht per day (330 to 370 baht before the revision) | Effective January 1, 2025 | Standard rate |
| Minimum wage (July 2025 revision) | 337 to 400 baht per day (Bangkok 400 baht, monthly minimum 12,000 baht) | Effective July 1, 2025. The Wage Committee decided on March 17, 2026 not to revise for the time being | Standard rate |
| Minimum wage (for 2027) | The Wage Committee discussed the review framework on June 30, 2026 | As of writing, the new amounts and effective date could not be confirmed | Candidate trigger for the next revision |
| Electricity, January to April 2026 | Ft 9.72 satang/kWh, average 3.88 baht/kWh | National average, VAT excluded | Variable overhead rate |
| Electricity, May to August 2026 | Ft 16.23 satang/kWh, average 3.95 baht/kWh | National average, VAT excluded | Variable overhead rate |
| Electricity, September to December 2026 | Ft 16.23 satang/kWh, base tariff 3.72 baht/kWh, average 3.89 baht/kWh | National average, VAT excluded | Variable overhead rate |
| Exchange rate, USD | BOT reference rate 33.5580 baht/USD | October 9, 2026 | Standard unit price of imported materials |
| Exchange rate, JPY | Commercial bank average mid rate 21.2958 baht/100 yen | October 9, 2026 | Standard unit price of imported materials |
Minimum Wage
In 2025, the minimum wage moved twice, in January and July. According to Tilleke & Gibbins, the January 1, 2025 revision set the daily rate at 337 to 400 baht (330 to 370 baht before the revision). According to Forvis Mazars, on July 1, 2025 Bangkok was raised from 372 baht to 400 baht (monthly minimum 12,000 baht), while areas outside the scope of the notification were left unchanged. The national daily rate is 337 to 400 baht. Thai PBS reported that at the Wage Committee meeting on March 17, 2026, the three parties (employers, workers and government) unanimously decided not to consider a revision for the time being, citing the impact of fighting in the Middle East on production costs.
Subsequently, according to an announcement by Thailand’s Ministry of Labour, the Wage Committee on June 30, 2026 discussed the framework and criteria for reviewing provincial minimum wages for B.E. 2570 (2027). As of the time of writing (October 12, 2026), the new amounts and effective date for 2027 could not be confirmed. Because minimum wage revisions can take effect in the middle of a fiscal year, deciding in advance on a trigger such as “review the standard rate once the notification is issued” helps you avoid scrambling.
Electricity Tariffs (Ft)
Thailand’s electricity tariff consists of a base tariff plus a fuel adjustment charge (Ft), and the Energy Regulatory Commission (ERC) sets the Ft every four months. According to The Bangkok Insight, the Ft for January to April 2026 was 9.72 satang/kWh and the average electricity tariff was 3.88 baht/kWh (VAT excluded). For May to August 2026, the Ft was 16.23 satang/kWh with an average of 3.95 baht/kWh, and according to Naewna’s report on the public hearing, the lowest option was one that applied recovered excess profits of the power utilities. The Nation reported that for September to December 2026, the Ft was kept at 16.23 satang/kWh while street lighting costs (about 6 satang/kWh) were removed from the base tariff, bringing the base tariff from 3.78 to 3.72 baht/kWh and the average tariff from 3.95 to 3.89 baht/kWh.
Note that these are national average tariffs. The unit price a plant actually pays differs depending on its contracted tariff category (TOU and so on). If you include electricity in the standard variable overhead rate, it is safer to take the actual unit price from your own bills and use Ft revisions as “a signal to learn the direction and size of the change.”
Exchange Rates
According to the Bank of Thailand (BOT) table, the USD reference rate on October 9, 2026 was 33.5580 baht/USD, and the commercial bank average mid rate for the yen was 21.2958 baht per 100 yen. Trading Economics reports that USD/THB fell 2.55% over the past 12 months (as of October 9, 2026). In addition, the ERC’s public hearing document for September to December 2026 uses an exchange rate assumption of 32.51 baht/USD for May 2026. When exchange rates move, the standard unit prices of imported materials and the cost of foreign-currency equipment and parts all shift together.
Revision Frequency and Triggers
AccountingTools states that many companies update their standards on an annual basis, and as alternatives lists reviewing only when cost changes exceed a threshold (with “a 5% cost increase” as an example), increasing the frequency only for the 20% of items that account for 80% of costs, and reviewing when an item’s variance is 5% or more for several months. It concludes that selective, trigger-based reviews are more efficient than increasing frequency across the board. A 2022 article by US accounting firm Sensiba proposes, amid inflation and supply chain disruption, increasing review frequency to semiannual, quarterly or monthly, focusing reviews on the top 20% of items, triggers based on thresholds (with a 25% change as an example), and a “watch list” to separate temporary changes from permanent ones. The same article also points out that if standard revisions lag during inflation, companies may end up taking and delivering orders that generate little profit.
The figures of 5% and 25% are examples given by each source, not industry-defined benchmarks. Set your own thresholds based on your cost structure and the acceptable range of variances. Here are examples of triggers that are easy to design for plants in Thailand.
- Periodic revision: Once a year (together with budgeting)
- Minimum wage: When the Wage Committee’s notification is issued and the effective date is set
- Electricity: When the ERC revises the Ft, or when your own electricity unit price changes by more than a certain range
- Exchange rates: When the rate stays more than a certain range away from the exchange rate assumption used when the standard was set
- Key materials: When, for the top items by cost, the price variance exceeds a certain range for several months
- Processes and equipment: When equipment upgrades or process changes alter standard labor hours or machine hours
Let us look at the impact of an electricity revision using illustrative numbers. If the standard was set using the May to August 2026 average tariff of 3.95 baht/kWh and it becomes 3.89 baht/kWh for September to December, then assuming monthly consumption of 100,000 kWh, (3.89 − 3.95) × 100,000 = −6,000 baht/month (favorable). However, this calculation uses the national average tariff and differs from the actual unit price under the plant’s tariff category (TOU, etc.). If the standard is left unchanged, these 6,000 baht will keep appearing every month on the favorable side of the variable overhead spending variance. The variance itself is not a problem, but unless it is recorded in a way that shows the cause is “a tariff revision,” it will look as if the shop floor saved electricity.
Relationship with Accounting Standards: IAS 2, TAS 2 and Treatment of Variances
As long as inventory and cost of goods sold are valued at standard cost, the relationship with accounting standards cannot be avoided.
IAS 2 Paragraphs 21 and 13
Paragraph 21 of IAS 2 “Inventories” states that techniques for the measurement of cost, such as the standard cost method or the retail method, may be used for convenience if the results approximate cost. It goes on to state that standard costs take into account normal levels of materials and supplies, labor, efficiency and capacity utilization, and that they are regularly reviewed and, if necessary, revised in the light of current conditions. KPMG’s IFRS Institute also summarizes that under IAS 2 the standard cost method and the retail method may be used if they approximate cost (article dated June 1, 2026).
In other words, valuation at standard cost is permitted on the premise that “the results approximate actual cost.” A situation where standards are outdated and large variances keep appearing is a management problem and, at the same time, a situation where the accounting premise is also starting to break down.
Paragraph 13 of IAS 2 states that the allocation of fixed production overheads is based on the normal capacity of the production facilities, that the amount of fixed overhead allocated to each unit of production is not increased as a consequence of low production or idle plant, and that unallocated overheads are recognized as an expense in the period in which they are incurred. It also states that in periods of abnormally high production, the amount allocated per unit is decreased so that inventories are not measured above cost.
Following this approach, allocating a large unfavorable volume variance caused by low production to inventory and leaving it in stock is not consistent with the thinking of IAS 2. Unabsorbed fixed overhead, like the 50,000 baht volume variance in the earlier worked example, is something to consider treating as a period expense.
Thai Accounting Standards (TFRS)
Thai Financial Reporting Standards (TFRS) are prepared by the Federation of Accounting Professions (TFAC) based on the IFRS framework, and there are two frameworks: TFRS for PAEs, which covers listed companies and similar entities, and TFRS for NPAEs, which covers general non-publicly accountable entities (according to an explainer by Thai accounting software company FlowAccount, June 15, 2026). According to RSM Thailand, the 2022 revised edition of TFRS for NPAEs applies to accounting periods beginning on or after January 1, 2023.
TAS 2, the standard on inventories, is generally understood to be based on IAS 2, but because this article was unable to confirm the Thai-language text of TAS 2, we do not quote its wording. Please check with your accountants and audit firm which framework your company applies and how that framework treats valuation at standard cost and the handling of variances.
Year-End Treatment of Variances
How variances are treated at period end also ties directly to system settings. AccountingCoach, a US accounting learning site, presents the view that immaterial variances are charged in full to the income statement (cost of goods sold), while material variances are allocated between inventory and cost of goods sold.
Section 47 of Japan’s Cost Accounting Standards states that under an actual costing system, cost variances are in principle charged to cost of goods sold for the current year, and material purchase price variances are allocated between the quantity issued and the ending inventory. Under a standard costing system, quantity variances, labor hours variances, efficiency variances and the like that are recognized as arising from abnormal conditions are treated as non-cost items, and the rest are handled in accordance with the treatment under an actual costing system.
Because the consolidation policy of the Japanese head office, Thai statutory accounting and tax are all involved, the treatment of variances is not something the system side can decide. In a system implementation, check whether the design allows you to choose, “for each type of variance, whether to charge it to cost of goods sold, allocate it to inventory, or treat it as a non-cost item,” and decide which to choose with your accountants and audit firm.
Key Points for a Standard Costing System: Actual Data Collection, Master Data and Order-Level Tracking
As the formulas so far show, breaking down variances requires “actual quantities.” Unless you can collect actual quantities used, actual labor hours and actual machine hours by product or by production order, you cannot separate the price variance from the quantity variance, or the rate variance from the efficiency variance. The success of a standard costing system is decided by actual data collection more than by the calculation engine.
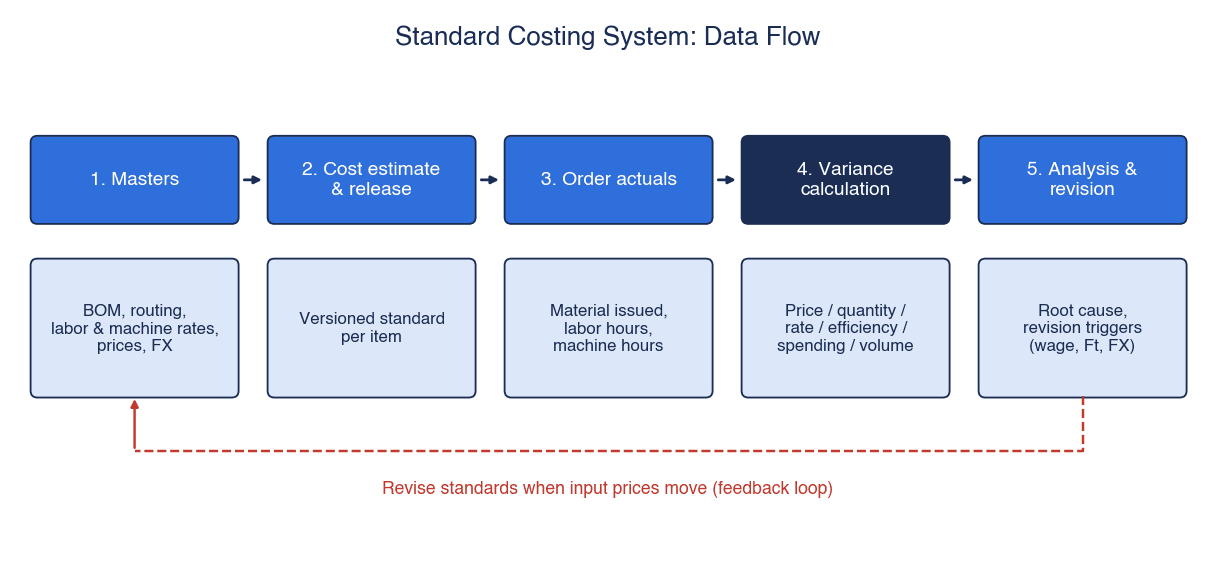
Here is the data flow in five stages.
- Master data: The inputs for the standards, such as the BOM, routing, wage rates, overhead rates and exchange rate assumptions
- Cost estimate and release: Build up standard costs from the master data, approve them and make them effective
- Production order actuals: Record material issues, labor hours, machine hours, completed quantities and defect quantities by order
- Variance calculation: Match standards against actuals and calculate variances by type
- Analysis and standard revision: Investigate the causes of variances, revise the standards if necessary, and return to stage 2
For moving to daily actual data collection and away from month-end costing, our article on turning month-end cost into daily decisions with a manufacturing cost management system covers how to run a 90-day PoC. Our selection guide for manufacturing cost management systems also explains in detail why costs cannot be produced without actual data collection.
The points to keep in mind when systematizing are as follows.
Close actuals at the order level. As a rule, variances should be finalized when a production order is completed. If an order stays open across month-end, the valuation of work in process and the period to which variances belong become entangled. The treatment of work in process at month-end is explained together with KPIs in our article on work-in-process inventory management.
Combine with seiban in make-to-order plants. In plants where specifications differ for each order, item-level standards alone make variances less meaningful. For how to combine this with a mechanism that compares actuals and estimates by seiban (job order number), see our article on job order (seiban) management systems.
Define the boundary between ERP and production management. A common division of roles is for the ERP to handle the calculation and journal entries for standard costs, while a production management system or MES handles actual data collection. In that case, unless you define the specification for passing order numbers, item codes, quantities and hours (the data contract) and how corrections and cancellations are handled, variances can disappear between the two systems or appear twice. Integration design is summarized in our guide to ERP and production management integration.
Keep versions of standards. If you overwrite old standards when revising them, you cannot recalculate past variances. Being able to retain which version of the standard was effective in which period is also important for audit purposes.
Standard Costing Functions in ERP and Production Management Packages [Vendor Materials]
Here we summarize the standard costing functions of major ERP systems based on what is stated in each vendor’s official documentation and learning materials. The following is a summary of what vendor materials state, not a recommendation or ranking. Pricing is also not covered. The actual scope of functions differs depending on edition, license, version and the configuration by the implementation partner, so be sure to confirm through demos and in a test environment.
| Product | How standards are held | Version control and release | Handling of variances | Type of source |
|---|---|---|---|---|
| SAP S/4HANA | Price control for each material is selected from standard price (S) or moving average price (V). Material Ledger is mandatory | A cost estimate is “marked” to set the future standard price and “released” to make it the current standard price. Marking can be done multiple times within a period; release once. If there is stock, it is revalued | When optional actual costing is used, variances between standard and actual are recorded in the Material Ledger and a periodic unit price is calculated at period end. The periodic unit price can be marked and released as the standard price for the next period | SAP Learning course, SAP PRESS Blog (no date given on the article) |
| Oracle Fusion Cloud Cost Management | Rolled-up costs for manufactured items are estimated in cost scenarios. Purchased items are published with “Update Standard Costs” | Incremental rollups can reflect mid-period corrections and rolling forecasts. Effective dates can be set in the past, present or future | The 25B new feature “Standard Purchase Cost Variance Summary” shows variances by cost organization, cost book and variance type, for the last 30 days by default, with drill-down from item to transaction | Product documentation (26A), new feature material (25B) |
| Microsoft Dynamics 365 Supply Chain Management | Standard costs are managed in costing versions. There are two update approaches: one-version and two-version | Updates are entered as Pending and become Active upon activation. In the two-version approach, a separate costing version is used for updates, and a blocking policy prevents updates to the original version | When a new standard price is activated, on-hand inventory is typically revalued through a standard cost revaluation transaction | Microsoft Learn (updated September 1, 2026) |
| Odoo 18 | The costing method is selected from Standard Price, AVCO and FIFO. Standard Price is the default, valued at the cost entered manually on the product form | Within the scope of the materials referenced in this article, no description of version control was confirmed | With automated valuation (Automated), valuation journal entries are generated automatically. A note advises consulting an accountant before changing the costing method | Official documentation (18.0) |
When comparing, look not only at whether a function exists but also at whether it fits your operations from the following three perspectives.
- Version control of standards: Can future standards be registered in advance and switched over by effective date? Can past versions be kept and used for recalculation?
- Cost estimates and release: Are the steps of building up, approving and activating standards separated? What journal entries are generated for inventory revaluation at release?
- Variance accounts and level of breakdown: Of the eight types of variance summarized in this article, which can be produced separately with standard functions? Can you drill down by item, order, department and variance type?
The third point in particular is hard to judge from product materials alone. In demos, the reliable approach is to provide your own items and illustrative numbers and ask the vendor to show the amounts by variance type on screen and in reports.
The Limits of Excel and Criteria for Moving to a System
Building standard costs in Excel, extracting actuals from the ERP and calculating variances is how many plants actually operate. At a stage where the number of items is small and breaking down variances into total materials and labor amounts is sufficient, Excel is often more flexible and cheaper.
On the other hand, when symptoms like the following appear, Excel-based operation is nearing its limits.
- Revising the standards takes several weeks, so you cannot revise more often than once a year
- You cannot trace afterwards which version of the standards a variance was calculated with
- Extracting and reconciling actuals takes several days at month-end, leaving no time for analysis
- Most variances end up in “other” or “adjustments” and cannot be explained
- When the person in charge changes, nobody understands the calculation logic anymore
- Head office asks for variances by item or by order, and you cannot produce them
As criteria for deciding whether to move to a system, try answering the following questions.
| Question | The more “yes” answers, the more likely a system will be effective |
|---|---|
| Are you already recording actuals (material issues, labor hours, machine hours) at the order level? | If records exist, the system can focus on calculation and aggregation |
| Do you need to revise standards twice a year or more? | Version control and bulk recalculation have a large effect |
| Do you have many items, with Excel sheet management close to breaking down? | Building up from master data pays off |
| Do you want to see variances by item, by order and by department? | Drill-down functions become necessary |
| Are auditors asking for the basis of standards and variances? | Retention of versions and calculation history becomes necessary |
Conversely, if you introduce a system without recording actuals at the order level, you will not be able to break down variances. In that case, it is the right order to put the mechanism for actual data collection in place before systematizing standard costing.
12 Items to Include in the RFP
In an RFP (request for proposal) for a standard costing system, it is more important to write concretely “which variances you want to see, at what level, and when” than to list functions. The following 12 items can be used as a minimum framework.
| No. | Item | Example of what to write |
|---|---|---|
| 1 | Variance types and formulas | The eight types of variance in this article, with their formulas and signs (positive = unfavorable) |
| 2 | Variance aggregation level | How far to separate: item, production order, process, department, type of work |
| 3 | Timing of variance finalization | At order completion, at monthly closing, and whether daily provisional figures are needed |
| 4 | When the material price variance is captured | At receipt or at consumption |
| 5 | Components of the standard | Breakdown into materials, labor, variable overhead and fixed overhead, and whether electricity is held separately |
| 6 | Version control of standards | Advance registration of future standards, switchover by effective date, retention of past versions and recalculation |
| 7 | Standard revision procedure | Segregation of authority for build-up, approval and release, and inventory revaluation at release |
| 8 | Management of assumptions | Hold wage rates, overhead rates, exchange rate assumptions and electricity unit prices as master data and keep change history |
| 9 | Method of collecting actuals | Input methods and granularity for material issues, labor hours, machine hours, completed quantities and defect quantities |
| 10 | Integration with other systems | Integration items with ERP, production management and attendance, and handling of corrections and cancellations |
| 11 | Accounting treatment of variances | Accounts by variance type, and options for allocation between cost of goods sold and inventory |
| 12 | Reports and analysis | Reports by variance type, drill-down, languages (Japanese, English, Thai) |
In the RFP, if you select a few representative items from your own product range, attach illustrative standards and actuals, and write “please show in your proposal what the variances would be with these numbers,” you can compare each vendor’s proposal on an equal footing.
Acceptance Test Items for Verifying Variance Recalculation
At the stage of accepting the system (FAT/SAT, UAT), the most important thing to confirm is not whether the screens work but whether the variance figures match manual calculations. Prepare illustrative data with known answers, like the worked example in this article, and check it against the system’s results.
| No. | Test item | What to confirm |
|---|---|---|
| 1 | Material price and quantity variances | Do they match the worked example values (4,200 and 5,000), with a total of 9,200? |
| 2 | Labor rate and efficiency variances | Do they match the worked example values (1,640 and 1,000), with a total of 2,640? |
| 3 | The four manufacturing overhead variances | Do they match 20,000, 50,000, 8,000 and 12,000, with a total of 90,000? |
| 4 | Consistency of the total variance | Does the sum of the variances match the difference between actual cost and standard cost (101,840)? |
| 5 | Sign | Are unfavorable variances positive and favorable variances negative, and are they shown in the same direction in reports? |
| 6 | When output changes | Are comparisons made against standard quantities for actual output (not against planned output)? |
| 7 | Standard revision | When a new version is released mid-period, is the correct standard used before and after the effective date? |
| 8 | Inventory revaluation | Do the amount and journal entries for inventory revaluation at release match manual calculations? |
| 9 | Corrections and cancellations | When actuals are corrected or cancelled, are variances recalculated correctly without duplication? |
| 10 | Orders spanning month-end | Is the treatment of variances for orders not completed at month-end in line with the agreed rules? |
| 11 | Period-end processing | Are the account transfers and allocations by variance type in line with the rules agreed with the accountants? |
| 12 | Recalculation with past versions | Can variances for past periods be recalculated with past versions of the standards? |
Also prepare test data with a mix of favorable and unfavorable variances, and cases where variances are zero. If you test only with data where all variances are unfavorable, you may not notice even if the sign direction has been implemented in reverse.
Worked Example (Illustrative Numbers)
Here are all the figures so far in one place. These are illustrative numbers set for the explanation in this article and do not represent an actual plant.
| Category | Standard cost (baht) | Actual cost (baht) | Variance (baht, positive = unfavorable) |
|---|---|---|---|
| Direct materials | 100,000 | 109,200 | 9,200 |
| Direct labor | 40,000 | 42,640 | 2,640 |
| Manufacturing overhead | 720,000 | 810,000 | 90,000 |
| Total | 860,000 | 961,840 | 101,840 |
The breakdown of variances is as follows.
| Variance | Calculation | Amount (baht) |
|---|---|---|
| Material price variance | (104 − 100) × 1,050 | 4,200 |
| Material quantity variance | (1,050 − 1,000) × 100 | 5,000 |
| Labor rate variance | (52 − 50) × 820 | 1,640 |
| Labor efficiency variance | (820 − 800) × 50 | 1,000 |
| Fixed overhead spending variance | 520,000 − 500,000 | 20,000 |
| Volume variance | (10,000 − 9,000) × 50 | 50,000 |
| Variable overhead spending variance | 290,000 − 30 × 9,400 | 8,000 |
| Variable overhead efficiency variance | (9,400 − 9,000) × 30 | 12,000 |
| Total | 9,200 + 2,640 + 90,000 | 101,840 |
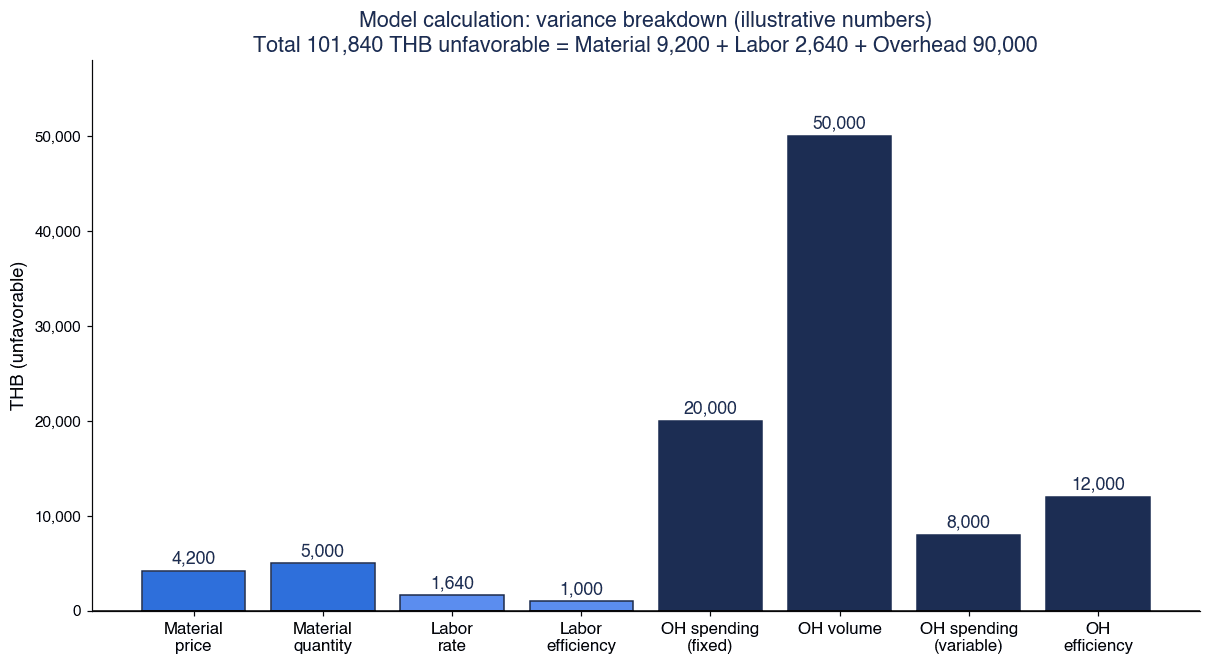
The total of all variances is 101,840 baht (unfavorable). Here is how to read this worked example.
The largest variance is the volume variance of 50,000 baht. It accounts for roughly half of all variances. It is not caused by shop-floor efficiency but by actual output (standard hours for actual output of 9,000 hours) falling below normal capacity (10,000 hours). It is an issue of orders and production planning, and asking the shop floor to improve will not reduce it.
The variances related to shop-floor efficiency are the quantity variance of 5,000, the labor efficiency variance of 1,000 and the overhead efficiency variance of 12,000. Together they total 18,000 baht, less than 20% of the total variance of 101,840 baht.
The variances related to prices and spending are the material price variance of 4,200, the rate variance of 1,640, the variable overhead spending variance of 8,000 and the fixed overhead spending variance of 20,000. Together they total 33,840 baht. Higher material prices, higher wage rates and increased overhead spending are each candidate causes, and purchasing, HR and each department will be asked for explanations.
The total of the three groups is 50,000 + 18,000 + 33,840 = 101,840 baht, matching the total of all variances.
If you reported only that “manufacturing cost was 101,840 baht above standard” without breaking it down, many people would read it as “the shop floor is doing badly.” Breaking it down shows that half of it is an order volume issue, and the part related to shop-floor efficiency stays just under 20%. Collecting variances in a form that can be explained means making it clear in this way “whom to ask about what.”
Note that this worked example does not include payback periods or savings amounts. Making variances visible and reducing costs as a result are separate matters; if you estimate the effect, you need to consider individually which measures to apply to which variances.
In meetings where the results of variance analysis are reflected in production and sales plans for the following months, the outlook for the volume variance becomes an important point of discussion. How to bring a cost perspective into the monthly supply and demand meeting is covered in our article on S&OP implementation.
Frequently Asked Questions
What is a standard costing system?
It is a method in which you determine in advance the cost that should be incurred to make one unit of a product (the standard cost), then capture and analyze the difference from the cost actually incurred (the cost variance) by type. AccountingTools defines it as the practice of substituting an expected cost for an actual cost in the accounting records. It is used for three purposes: cost control, budgeting, and valuation of inventory and cost of goods sold.
What does cost variance analysis tell you?
By splitting the total variance into the material price and quantity variances, the labor rate and efficiency variances, and the manufacturing overhead spending, efficiency and volume variances, you can see whether the cause of a variance lies in “price,” “quantity and time” or “capacity utilization.” This shows you which function to ask for an explanation: purchasing, production, HR, or sales and production planning.
What is the difference between price and quantity variance?
The price variance is the difference in “how much you paid for (or consumed) the material,” calculated as (Actual unit price − Standard unit price) × Actual quantity used. The quantity variance is the difference in “how much you used,” calculated as (Actual quantity used − Standard quantity for actual output) × Standard unit price. In this article’s illustrative worked example, the price variance was 4,200 baht and the quantity variance 5,000 baht, for a total of 9,200 baht (all unfavorable).
Why can the manufacturing overhead volume variance be so large?
When fixed overhead is allocated based on normal capacity, if actual output falls below normal capacity, all of the fixed overhead that could not be absorbed appears as the volume variance. Because fixed overhead cannot be reduced in line with output in the short term, the volume variance becomes large in months when orders fall. In this article’s illustrative worked example, standard hours for actual output were 9,000 hours against normal capacity of 10,000 hours, and the volume variance was 50,000 baht.
How often should you revise standard costs?
According to AccountingTools, many companies update their standards on an annual basis. It also introduces trigger-based approaches that review standards when cost changes exceed a threshold or when variances stay above a certain range for several months. For plants in Thailand, operations become easier if you set minimum wage notifications, Ft revisions by the ERC and large exchange rate movements as triggers separate from the periodic revision.
Can standard costing be used under Thai accounting standards?
Thai Financial Reporting Standards (TFRS) are based on the IFRS framework. Paragraph 21 of IAS 2 permits the standard cost method to be used for convenience if the results approximate actual cost, and requires regular reviews. However, this article was unable to confirm the Thai-language text of TAS 2. Please check with your accountants and audit firm how the framework your company applies (TFRS for PAEs or TFRS for NPAEs) treats this, and how variances should be handled.
How much does a standard costing system cost?
Costs vary greatly depending on the scope (whether it covers only materials and labor or extends to breaking down manufacturing overhead variances), whether you have an existing ERP and what its functions are, and whether a mechanism for collecting actuals is already in place, so a general amount cannot be given. The reliable approach is to fix the variance types, aggregation levels and integration scope in the RFP, then obtain and compare quotes from several vendors.
Summary
- Standard costing is decided less by “building the standards” and more by designing data collection so that variances can be explained
- Split variances into materials (price and quantity), labor (rate and efficiency) and manufacturing overhead (spending, efficiency and volume), and agree on a single set of formulas and signs (such as positive = unfavorable) within the company
- Always compare against “the standard for actual output.” Do not compare against the standard for planned output
- Breaking down variances requires collecting actual quantities used, labor hours and machine hours at the order level, and the success of a system implementation is decided by actual data collection
- Standards rest on moving assumptions such as the minimum wage (337 to 400 baht per day since July 1, 2025), electricity tariffs (average tariff of 3.89 baht/kWh for September to December 2026, national average, VAT excluded; Ft 16.23 satang/kWh) and exchange rates (BOT reference rate of 33.5580 baht/USD on October 9, 2026). Decide the revision frequency and triggers in advance
- IAS 2 permits the standard cost method if the results approximate actual cost and requires regular reviews. Under its approach, unabsorbed fixed overhead caused by low production is treated as a period expense; decide the treatment of variances with your accountants and audit firm
- Compare ERPs from three perspectives: “version control of standards,” “cost estimates and release,” and “variance accounts and level of breakdown”
- Write in the RFP “which variances you want to see, at what level, and when,” and in acceptance testing, verify the recalculation of variances with illustrative data whose answers are known
- In the illustrative worked example, about half of the total variance of 101,840 baht, 50,000 baht, was the volume variance, which was not a shop-floor efficiency problem. Without a breakdown, it would be misread as “the shop floor is doing badly”
TOMAS TECH supports Japanese-affiliated manufacturers in Thailand with implementing production management and cost management systems. Even before you have decided on a system, you are welcome to consult us from stages such as rebuilding your standard costs, organizing the level of variance breakdown, designing actual data collection, and preparing an RFP. Please feel free to reach out via our contact page.
References
- Cost Accounting Standards (Genka Keisan Kijun), Wikibooks transcription (Japanese): https://ja.wikibooks.org/wiki/%E5%8E%9F%E4%BE%A1%E8%A8%88%E7%AE%97%E5%9F%BA%E6%BA%96
- Cost Accounting Standards Section 42, Revision of standard costs, Wikibooks transcription (Japanese): https://ja.wikibooks.org/wiki/%E6%A8%99%E6%BA%96%E5%8E%9F%E4%BE%A1%E3%81%AE%E6%94%B9%E8%A8%82
- Cost Accounting Standards Section 46, Cost variances under a standard costing system, Wikibooks transcription (Japanese): https://ja.wikibooks.org/wiki/%E6%A8%99%E6%BA%96%E5%8E%9F%E4%BE%A1%E8%A8%88%E7%AE%97%E5%88%B6%E5%BA%A6%E3%81%AB%E3%81%8A%E3%81%91%E3%82%8B%E5%8E%9F%E4%BE%A1%E5%B7%AE%E7%95%B0
- Cost Accounting Standards Section 47, Accounting treatment of cost variances, Wikibooks transcription (Japanese): https://ja.wikibooks.org/wiki/%E5%8E%9F%E4%BE%A1%E5%B7%AE%E7%95%B0%E3%81%AE%E4%BC%9A%E8%A8%88%E5%87%A6%E7%90%86
- AccountingTools, Standard costing (2026-01-09): https://www.accountingtools.com/articles/standard-costing
- AccountingTools, Purchase price variance: https://www.accountingtools.com/articles/purchase-price-variance
- AccountingTools, Labor rate variance (2026-07-14): https://www.accountingtools.com/articles/labor-rate-variance
- AccountingTools, Overhead variances (2026-07-26): https://accountingtools.com/articles/overhead-variances
- AccountingTools, Fixed overhead volume variance (2026-01-15): https://www.accountingtools.com/articles/what-is-the-fixed-overhead-volume-variance.html
- AccountingTools, When should I update standard costs? (2026-08-31): https://accountingtools.com/articles/when-should-i-update-standard-costs.html
- OpenStax, Principles of Accounting Volume 2, 8.2 Compute and Evaluate Materials Variances: https://openstax.org/books/principles-managerial-accounting/pages/8-2-compute-and-evaluate-materials-variances
- Sensiba, Standard costing through supply chain disruption (2022-10-26): https://sensiba.com/resources/insights/standard-costing-through-supply-chain-disruption/
- AccountingCoach, Standard costing explanation: https://www.accountingcoach.com/standard-costing/explanation
- IAS 2 Inventories (copy of the IFRS Foundation PDF): https://ktkt.uel.edu.vn/Resources/Docs/SubDomain/ktkt/VanBan/IAS/ias2_en.pdf
- KPMG IFRS Institute, Inventory accounting: IFRS Accounting Standards vs US GAAP (2026-06-01): https://kpmg.com/us/en/articles/2026/inventory-accounting-ifrs-accounting-standards-vs-us-gaap.html
- FlowAccount, What is TFRS (2026-06-15): https://flowaccount.com/blog/what-is-tfrs/
- RSM Thailand, TFRS for NPAEs (Revised 2022): https://www.rsm.global/thailand/insights/thai-financial-reporting-standard-non-publicly-accountable-entities-revised-2022
- Tilleke & Gibbins (2024-12-27): https://www.tilleke.com/insights/thailand-increases-minimum-wage-across-all-provinces
- Forvis Mazars, Payroll Flash News July 2025 (2025-07-08): https://www.forvismazars.com/th/en/insights/doing-business-in-thailand/payroll/forvis-mazars-payroll-flash-news-july-2025
- Thai PBS (2026-03-17): https://www.thaipbs.or.th/news/content/503458
- Thailand Ministry of Labour, Wage Committee meeting No. 6/2569 (2026-06-30): https://www.mol.go.th/news/%E0%B8%9B%E0%B8%A5%E0%B8%B1%E0%B8%94%E0%B9%81%E0%B8%A3%E0%B8%87%E0%B8%87%E0%B8%B2%E0%B8%99-%E0%B8%9B%E0%B8%A3%E0%B8%B0%E0%B8%8A%E0%B8%B8%E0%B8%A1%E0%B8%9A%E0%B8%AD%E0%B8%A3%E0%B9%8C%E0%B8%94%E0%B8%84%E0%B9%88%E0%B8%B2%E0%B8%88%E0%B9%89%E0%B8%B2%E0%B8%87%E0%B8%8A%E0%B8%B8%E0%B8%94%E0%B8%97%E0%B8%B5%E0%B9%88-22-%E0%B8%97%E0%B8%9A%E0%B8%97%E0%B8%A7%E0%B8%99%E0%B8%AD%E0%B8%B1%E0%B8%95%E0%B8%A3%E0%B8%B2%E0%B8%84%E0%B9%88%E0%B8%B2%E0%B8%88%E0%B9%89%E0%B8%B2%E0%B8%87%E0%B8%82%E0%B8%B1%E0%B9%89%E0%B8%99%E0%B8%95%E0%B9%88%E0%B8%B3%E0%B8%9B%E0%B8%B5-2570
- The Bangkok Insight (2025-12-01): https://www.thebangkokinsight.com/news/business/economics/1585975/
- Naewna (public hearing on the Ft for May to August 2026): https://www.naewna.com/business/954792
- ERC Ft public hearing document, September to December 2026: https://www.erc.or.th/web-upload/200xf869baf82be74c18cc110e974eea8d5c/202607/m_publichearing/8776/601/file_download/5e0b74ed380a5f11a4b8537a757b9358.pdf
- The Nation Thailand (2026-08-12): https://www.nationthailand.com/news/40069705
- Bank of Thailand, Rates of Exchange of Commercial Banks in Bangkok Metropolis (2026-10-09): https://app.bot.or.th/BTWS_STAT/statistics/ReportPage.aspx?reportID=123&language=eng
- Trading Economics, Thai Baht: https://tradingeconomics.com/thailand/currency
- The Nation Thailand, MPI June 2026: https://www.nationthailand.com/business/40069104
- JETRO, FY2025 Survey on Business Conditions of Japanese-Affiliated Companies Overseas (Asia and Oceania) (2025-11-26): https://www.jetro.go.jp/ext_images/_Reports/01/231fa237934b5b0c/20250026rev1.pdf
- SAP Learning, Understanding Mark and Release: https://learning.sap.com/courses/product-cost-planning-in-sap-s-4hana/understanding-mark-and-release
- SAP PRESS Blog, The Material Ledger and Actual Costing with SAP S/4HANA: https://blog.sap-press.com/the-material-ledger-and-actual-costing-with-sap-s4hana
- Oracle, Estimating Standard Costs (26A): https://docs.oracle.com/en/cloud/saas/supply-chain-and-manufacturing/26a/fapma/estimating-standard-costs.html
- Oracle, Inventory 25B What’s New (Standard Purchase Cost Variance Summary): https://docs.oracle.com/en/cloud/saas/readiness/scm/25b/inv25b/25B-inventory-wn-f37155.htm
- Microsoft Learn, Manage standard cost updates (updated 2026-09-01): https://learn.microsoft.com/en-us/dynamics365/supply-chain/cost-management/manage-standard-cost-updates
- Odoo 18, Inventory valuation configuration: https://www.odoo.com/documentation/18.0/applications/inventory_and_mrp/inventory/product_management/inventory_valuation/inventory_valuation_config.html


