


When a factory in Thailand asks us about edge computing, the opening question is almost always the same one, namely whether to adopt it or not. As long as the discussion stays inside that yes-or-no frame, the investment tends to inflate and the payback tends to slip. What actually decides payback is a workload-by-workload sort, that is, which processing belongs on equipment at the line and which processing stays in the cloud. This article sets up a model factory in Samut Prakan, splits its processing into three tiers, and works out the payback period for two scenarios. Every figure below is an assumption made for the model factory, not a measured result from a real plant.
What Edge Computing Is and Why Factories Split Work Between Edge and Cloud
Edge computing means processing data close to where the data is created. In a factory, that means an industrial PC beside the line or an IoT gateway inside the control panel. Its counterpart is the centralised cloud approach, where data is sent out to an external data centre first and processed there. Neither is inherently superior. The only real difference is that the nature of the workload determines where it should sit.
Three physical realities are what turn this placement question into money on a factory floor. The first is the round-trip time to a decision. Sending an image or a waveform to the cloud and waiting for the inference result stacks up network round trips on top of server-side processing time. On equipment with a takt time of a few hundred milliseconds, that round trip shows up on the line directly as a late judgement. The second is behaviour when the network drops. When an industrial estate suffers a circuit fault, or when the internal network goes down for maintenance, equipment that depends on the cloud for its judgement faces only two options, which are stopping the line or letting product through with no judgement at all. The third is communication and storage cost that scales with data volume. Images and high-frequency vibration data have a structure where the more you send, the higher the monthly bill.
The cloud, meanwhile, has strengths that are hard to replicate at the edge. It aggregates data across multiple lines and multiple sites, it lets you take temporary hold of the compute capacity needed to retrain an AI model, and it externalises operational work such as software updates and backups. These are workloads that need volume and sustained operation rather than speed, and handing them to a small box on the factory floor tends to cost more, not less. It is true that the commonly cited benefits of edge deployment in manufacturing are lower latency, reduced data traffic, and autonomous operation on the floor, but those benefits apply strictly to workloads that genuinely need speed and autonomy.
| Aspect | Processing on the floor (edge) | Processing in the cloud |
|---|---|---|
| Round trip to a decision | Easy to keep within a few tens of milliseconds | Network and server round trips accumulate |
| When the network drops | Judgement continues | Judgement stops, or product flows unjudged |
| Cost as data volume grows | Rises in steps with the number of devices | Rises monthly in proportion to traffic and storage |
| Software updates | Every device has to be updated | One central update covers everything |
| Cross-site aggregation | You have to build site-to-site linkage yourself | Available as a standard feature |
| Retraining AI models | You end up owning training compute in house | Capacity secured only when you need it |
Read that table and it becomes obvious that any design leaning entirely one way is unnatural. The top half favours the edge and the bottom half favours the cloud. A factory system is a place where workloads of fundamentally different character live side by side, and how you allocate that coexistence is the substance of the design work.
One boundary is worth stating up front. This article deals only with what happens after the data has been captured. The upstream design question of which route to use to pull data out of PLCs and sensors is covered in four routes for PLC data collection, so if you are still choosing communication standards and protocols, start there. This article handles only the question of where the captured data gets processed.
Why Framing It as Edge or Cloud Leads to the Wrong Investment Decision
Frame the question as a binary choice and the review will always drift to one of the two extremes. On one side is full on-premise conversion, where “adopt edge” gets read as “own everything inside the factory”. On the other is the status quo, where the verdict is “too early for us” and the cloud approach continues. These two look like opposites, yet they share the same mistake. Neither distinguishes between the natures of the workloads, and both lump everything together by the location of the container.
Suppose a review starts from the motivation that cloud costs are too high and the work should come back on premise. That motivation is legitimate in itself, but move everything inside the factory without examining the cost breakdown and you end up owning monthly aggregation and a handful of annual model retraining runs on your own servers. Those workloads do not need speed, so moving them to the edge will not make a single judgement on the floor one millisecond faster. What will certainly increase is servers, storage, power, air conditioning, and the hours of the people who run them. That is the shape of investment piling up on a layer that carries no benefit.
The reverse case, deciding that the cloud works fine so the status quo is acceptable, often just means the losses caused by late judgement are invisible. If a 300 to 800 millisecond round trip is shifting judgement timing enough to cause escaped defects or excessive rejects, that is a cost occurring every month. It is simply hard to notice because it never appears on an invoice.
To avoid the binary, this article sorts workloads against the following three criteria.
| Criterion | Question to ask on the floor | Condition that points to the edge |
|---|---|---|
| Tolerable time to a decision | Within how many milliseconds does this workload have to answer to be in time | The tolerance sits within a few seconds |
| Tolerance for a network outage | While the network is down, is it acceptable to stop production | It cannot stop, or cannot run unjudged |
| Data volume and traffic cost | Will the data volume grow, and does cost scale with volume | Images or high-frequency waveforms that keep growing |
Any workload that matches even one of the three is worth placing at the edge, and any workload matching none of the three will be cheaper in the cloud. The order matters, and the important part is not starting from cost. Start from cost and the only thing in view is the large cloud invoice, and workloads that never needed speed get dragged into the factory alongside it.
Looking at the factory data platform as a whole, the foundation is your supervisory control platform selection and connection design. We cover that in selecting a SCADA and OT platform, but that article devotes only a few lines to edge computing, so treat this one as the deep dive.
Sorting Workloads Into Three Tiers, Namely Real-Time Control, Floor Optimisation, and Management and Learning

Apply the three criteria from the previous section to real factory workloads and they fall into roughly three layers. In this article we call them Tier 1 through Tier 3.
| Tier | Name | Required response time | Representative workloads | Placement principle |
|---|---|---|---|---|
| Tier 1 | Real-time control and pass/fail judgement | Tens of milliseconds to a few seconds | Pass/fail decisions by visual inspection AI, robot motion correction, safety stop decisions | Always the edge |
| Tier 2 | Floor optimisation | Minutes to hours | Micro-stoppage detection, live utilisation display, feature extraction for predictive maintenance | Works either way |
| Tier 3 | Management and learning | Days to weeks | Trend analysis across lines and sites, AI model retraining, monthly report aggregation | Suits the cloud |
This sort is decided not by device performance or price, but by what happens when the answer arrives late. Here is what that means tier by tier.
Tier 1 shows up on the line when the answer is late
Tier 1 covers workloads where a late answer produces a physical result the moment it happens. On equipment with a takt time of a few hundred milliseconds, a visual inspection AI that takes 300 to 800 milliseconds longer to return a verdict has already let the workpiece move to the next process in the meantime. Robot motion correction and safety stop decisions behave the same way. Put a network link in the middle of these and the state of that link becomes directly tied to product quality and safety. That is why the principle for Tier 1 is to design for edge placement without even running the cost-benefit case. Accuracy design and data handling for AI visual inspection itself are covered in analysing AI visual inspection data.
Tier 2 placement depends on your operating policy
Tier 2 covers workloads where an answer within minutes or hours is enough. Neither micro-stoppage detection nor a live utilisation display will turn a product defective because it arrived a few minutes late. Functionally, therefore, the cloud works. Where opinions divide is what happens during an outage. A factory that can accept the utilisation display going dark while the line is down is fine on the cloud, and a factory that cannot accept losing the evidence for that window should place the workload at the edge. For workloads such as feature extraction from vibration sensors, where sending every raw waveform makes traffic explode, a middle path works well, namely doing the extraction at the edge and sending only the results to the cloud. This is almost exactly the architecture we describe in designing a predictive maintenance system.
Pulling Tier 3 to the edge adds cost and nothing else
Tier 3 covers workloads where an answer within days or weeks is sufficient. Trend analysis across lines, AI model retraining, and monthly report aggregation all sit here. In exchange for not needing speed, they need large volumes of data and temporarily large compute capacity. Carrying that inside the factory means an aggregation server, storage, a training GPU, and people to run all of it. No speed benefit is created and cost alone increases, which is the standard ending when Tier 3 gets pulled to the edge.
A mapping table so the three tiers and the five layers do not get confused
There is a second use of the word layer in this article, namely the five-layer breakdown of deployment cost in the next section. The three processing tiers and the five cost layers are different things, so here is how they relate.
| Category | What it separates | Count | When you use it |
|---|---|---|---|
| Tier 1 to Tier 3 | The nature of the workload itself, meaning time tolerance, outage tolerance, and data volume | 3 | Deciding which workloads go to the edge |
| Cost layers 1 to 5 | The nature of the spending, meaning hardware, installation, porting, integration, and training | 5 | Estimating how much it will cost |
Decide to move Tier 1 to the edge and that single decision generates cost in all five layers. Decide instead to move everything through Tier 3 and the amount in each of those same five layers swells. Think of the processing tiers and the cost layers as a multiplication, not an addition.
What Edge Computing Deployment Costs, Broken Into Five Layers
Model factory assumptions
From here on we talk money. To keep the discussion concrete, we set up a model factory with the following conditions. To repeat the point, these are assumptions built for a calculation, not measured values from a real plant.
| Item | Setting |
|---|---|
| Location | Samut Prakan province |
| Industry | Japanese-owned electronic component assembly plant |
| Number of lines | 30 lines |
| Current state | Every line already runs cloud API based AI visual inspection for pass/fail judgement |
| Processing method | Images are sent to the cloud and the inference result is awaited |
| Latency | 300 to 800 milliseconds round trip |
This factory already has AI visual inspection running and has no major complaints about accuracy. The only question on the table is where the inference happens.
The status quo costs money even at zero investment
As a starting point for comparison, here is the annual cost of continuing the status quo. Investment is zero, but cost is not.
| Item | Annual amount (THB) | Basis |
|---|---|---|
| Cloud service fees | 1,296,000 | 30 lines x 3,600 THB per month x 12 months |
| Losses from escaped misjudgements | 892,800 | 0.4 cases per line per month x 30 lines x 6,200 THB per case x 12 months |
The escaped misjudgement figure needs a caveat. The 6,200 THB per case is an assumed cost covering customer complaint handling and a shipment hold, and it is not a measured value from any real plant. That unit cost changes by orders of magnitude depending on industry and customer. In sectors such as automotive components, where a single escape triggers a process audit, this figure is nowhere near enough. For products where the issue can be absorbed internally, it is far too high. When you apply this calculation to your own plant, replace this number with your measured value first. As the sensitivity analysis below shows, the monthly cloud fee and this unit cost are the two variables that move the payback period the most.
The five-layer cost breakdown
Estimate the cost of going to the edge on hardware alone and you will fall short every time. We cover the framework for breaking IoT deployment cost into five layers in detail in the five-layer breakdown of factory IoT cost, and the same structure applies to edge deployment. Moving only Tier 1, meaning the visual inspection AI inference, across all 30 lines produces the following breakdown.
| Layer | Content | Amount (THB) | Share | Basis |
|---|---|---|---|---|
| Layer 1 | Edge devices | 1,140,000 | 47.11% | 30 units x 38,000 THB |
| Layer 2 | Installation and wiring | 270,000 | 11.16% | 30 units x 9,000 THB, including dust and moisture protection |
| Layer 3 | Porting the inference model | 420,000 | 17.36% | Compressing, quantising, and tuning the existing cloud inference model |
| Layer 4 | Redesigning cloud integration | 380,000 | 15.70% | Rebuilding the pipeline to send metadata only, with images sent only on anomalies |
| Layer 5 | Training and documentation | 210,000 | 8.68% | Operating manuals and floor training |
The total is 2,420,000 THB. Because of rounding, the shares do not add up to exactly 100%.
The part of this breakdown that gets argued over every time is layers 3 to 5. Hardware and installation leave something physical behind, so they are accepted easily, while porting, redesign, and training leave nothing visible and are therefore the first items cut when the estimate has to come down. Yet those three layers are each tied directly to a benefit. Skip the layer 3 porting and a model built for the cloud will not hit the expected speed on edge hardware, so the latency reduction that justified the project never materialises. Skip the layer 4 redesign and you are left with a configuration that still ships every image to the cloud even though inference now runs at the edge, which guts the traffic cost saving described below. Skip the layer 5 training and the floor cannot isolate the cause when judgement starts behaving oddly, and the decision to revert to the cloud approach follows. Cut a layer that carries a benefit and you are left with the investment and none of the benefit. If something has to be cut, phasing the layer 1 device count across stages is the healthier option.
Comparing Payback, Tier 1 Only at the Edge Versus Everything On Premise
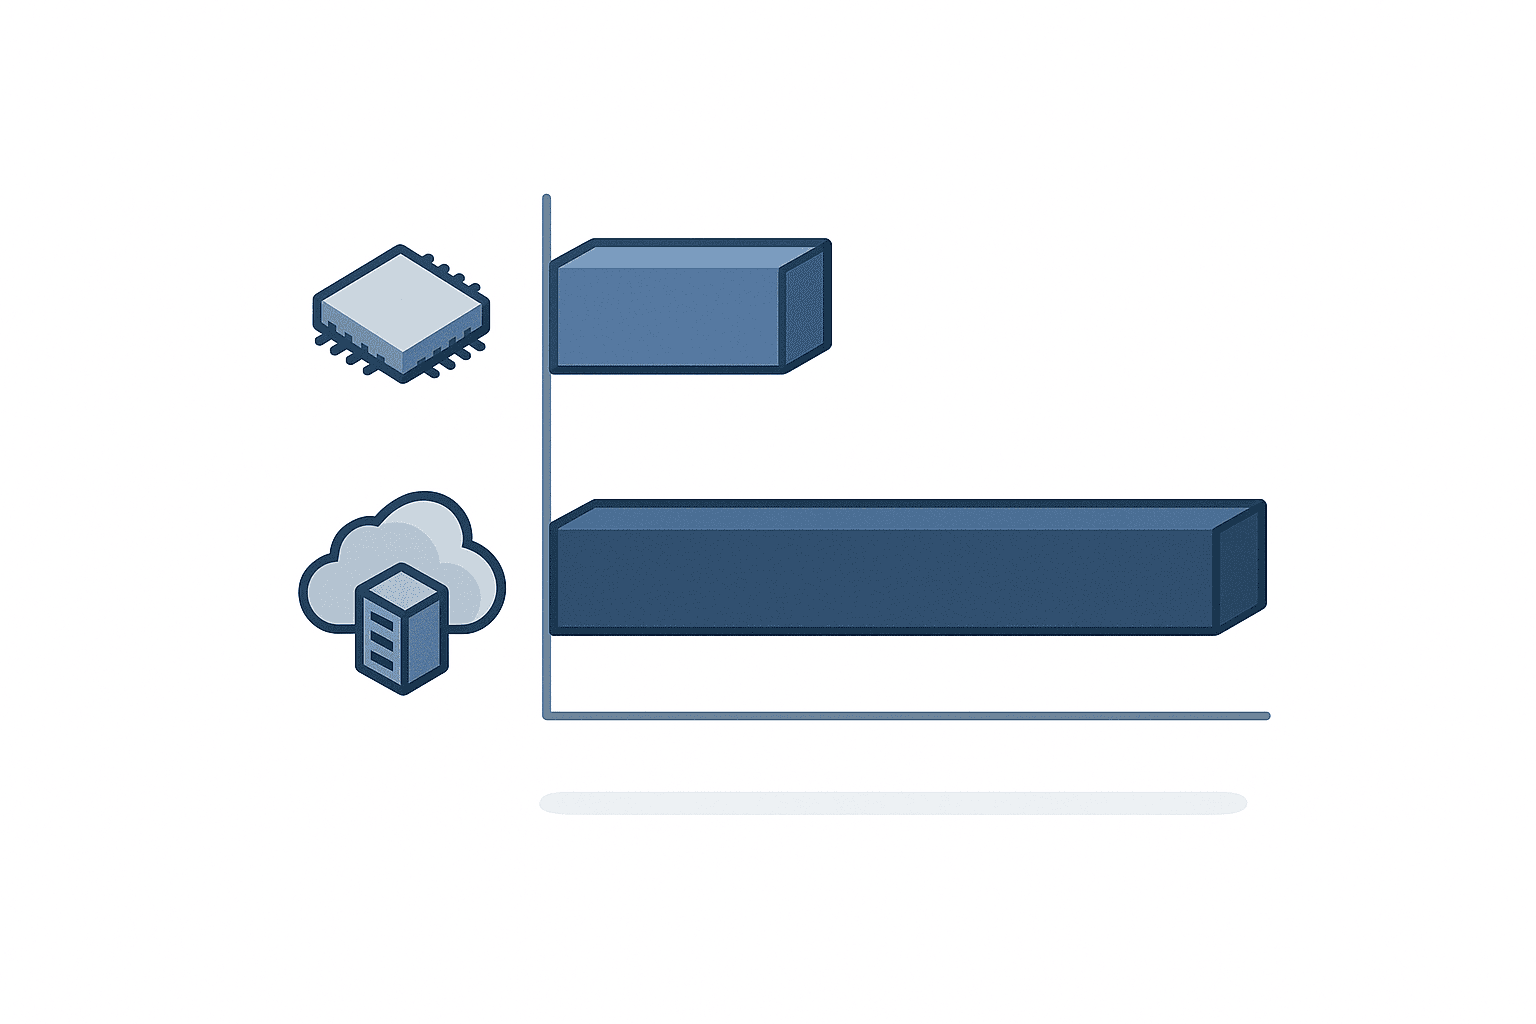
We set two scenarios against the same model factory. Both cover all 30 lines, and we line up investment, annual operating cost, annual benefit, net benefit, and payback period in the same frame.
Scenario A, moving only Tier 1 to the edge
Only the visual inspection AI inference moves to an edge device beside each line, while Tier 2 and Tier 3 continue to run in the cloud. Investment is the five-layer total from the previous section, 2,420,000 THB.
Annual operating cost consists of edge device maintenance at 30 units x 4,500 THB, giving 135,000 THB, plus the reduced cloud fee at 30 lines x 600 THB per month x 12 months, giving 216,000 THB, for a total of 351,000 THB. The pivot of this scenario is that you do not abandon the cloud, you change what you send it to mostly metadata, and the fee falls as a result.
Annual benefit has two components. The first is the cloud cost reduction. The current 1,296,000 THB becomes 216,000 THB, so the saving is 1,080,000 THB. The second is the reduction in escaped misjudgements. Assuming millisecond-level judgement brings escapes down from 0.4 to 0.05 cases per line per month, residual losses are 30 lines x 0.05 cases x 6,200 THB x 12 months, giving 111,600 THB, so the saving is 892,800 THB minus 111,600 THB, which is 781,200 THB. Total benefit comes to 1,861,200 THB.
Net benefit is the annual benefit of 1,861,200 THB minus the annual operating cost of 351,000 THB, giving 1,510,200 THB. Payback is the 2,420,000 THB investment divided by that net benefit, which is 1.60 years.
One accounting note. This calculation books the residual cloud fee of 216,000 THB on the operating cost side. The benefit figure of 1,080,000 THB has already had the residual subtracted, so the residual is effectively deducted twice, which makes Scenario A conservative by that amount. Scenario A’s payback therefore comes out slower than a fully consistent calculation would give. Scenario B below subtracts its 50,000 THB residual only on the benefit side, so the A versus B comparison is being run on terms unfavourable to A, which is the option we recommend. Each sensitivity case below uses the same treatment. The conclusion holds regardless.
Scenario B, consolidating Tier 1 through Tier 3 inside the factory
This configuration minimises cloud connectivity and completes inference, aggregation, and training entirely within the factory. The investment breaks down as follows.
| Layer | Content | Amount (THB) | Breakdown |
|---|---|---|---|
| Layer 1 | Inference devices and aggregation server | 2,120,000 | 30 inference devices at 1,140,000 plus a server and storage set at 980,000 |
| Layer 2 | Installation and server room upgrade | 530,000 | Installation and wiring at 270,000 plus server room power and cooling upgrade at 260,000 |
| Layer 3 | Model porting and MLOps platform | 1,310,000 | Model porting at 420,000 plus training GPU server and MLOps platform build at 890,000 |
| Layer 4 | Cross-site aggregation and disaster recovery | 610,000 | Building in house what the cloud used to provide |
| Layer 5 | Training and in-house operations capability | 550,000 | Training and manuals at 210,000 plus staff training and shift design for 24-hour monitoring at 340,000 |
Total investment is 5,120,000 THB. Layer 4 rises from 380,000 THB in Scenario A to 610,000 THB because cross-site aggregation and backup, which came as standard cloud features, now have to be rebuilt in house. Stop using the cloud and somebody has to build the functions you stopped using.
Annual operating cost consists of device maintenance at 135,000 THB, server and storage maintenance at 300,000 THB, and MLOps operations labour equivalent to 480,000 THB, for a total of 915,000 THB. Cloud spend falls to almost nothing, but in-house operating cost accumulates in its place.
Annual benefit has three components. Cloud cost falls to 50,000 THB for external integration only, so the saving is 1,246,000 THB. The escaped misjudgement reduction is a Tier 1 benefit, so it follows the same logic and the same amount as Scenario A, 781,200 THB. On top of that, consolidating Tier 3 in house is conservatively credited with 250,000 THB of additional predictive-maintenance-style savings from analysis across multiple lines. The total is 2,277,200 THB.
Net benefit is 2,277,200 THB minus 915,000 THB, giving 1,362,200 THB, and payback is 5,120,000 THB divided by 1,362,200 THB, which is 3.76 years.
The heart of the comparison, 2.12 times the investment for 0.90 times the net benefit
Here are the two scenarios side by side.
| Item | Scenario A, Tier 1 at the edge only | Scenario B, Tier 1 to 3 fully on premise |
|---|---|---|
| Investment (THB) | 2,420,000 | 5,120,000 |
| Annual operating cost (THB) | 351,000 | 915,000 |
| Annual benefit (THB) | 1,861,200 | 2,277,200 |
| Net benefit (THB) | 1,510,200 | 1,362,200 |
| Payback | 1.60 years | 3.76 years |
Investment in B is 2.12 times that of A. Yet net benefit in B is smaller, at 0.90 times A, which is roughly 10% less. Looking only at gross annual benefit, B is 416,000 THB ahead, but operating cost climbs faster than that.
Why does this happen. Most of the additional 2,700,000 THB invested in B goes to moving Tier 3, meaning aggregation and retraining, inside the factory. Tier 3 does not need speed, so moving it to the edge makes no judgement faster. Annual operating cost rises from 351,000 THB to 915,000 THB, an increase of 564,000 THB. That breaks down as server maintenance of 300,000 THB and MLOps operations of 480,000 THB being newly added, offset by the residual cloud fee of 216,000 THB that Scenario A booked as operating cost being absorbed into the benefit calculation in Scenario B, leaving a net increase of 564,000 THB. Against that, the additional benefit obtained is a further cloud cost reduction of 166,000 THB plus the cross-site benefit of 250,000 THB, totalling only 416,000 THB. Because the 416,000 THB of extra benefit falls short of the 564,000 THB of extra operating cost, net benefit drops by 148,000 THB. That is what happens when you stack operating-cost-heavy investment onto a layer where the benefit is thin.
The principle here is plain. What decides the payback of edge computing is neither the performance of the edge hardware nor the number of units, but where you draw the line on how far into the tiers you pull work to the edge. Stop the line at Tier 1 and it is 1.60 years. Extend it to Tier 3 and it is 3.76 years. Two plans described with the same phrase, going to the edge, differ by more than a factor of two in payback. Making the abandonment of the cloud an objective in itself is how you lose money, and that is the conclusion of this article.
Sensitivity Analysis, How Payback Moves When the Assumptions Break
The 1.60 year figure for Scenario A rests on several assumptions. Here we check whether the conclusion changes when those assumptions break. All of the following are calculated on Scenario A.
| Case | Assumption that breaks | Annual benefit (THB) | Net benefit (THB) | Payback |
|---|---|---|---|---|
| Base | Assumptions hold | 1,861,200 | 1,510,200 | 1.60 years |
| Case 1 | Escape unit cost is actually half, 6,200 falls to 3,100 THB | 1,470,600 | 1,119,600 | 2.16 years |
| Case 2 | Cloud bandwidth saving reaches only half of the assumption | 1,321,200 | 970,200 | 2.49 years |
| Case 3 | Latency is not an issue, so the escape benefit is zero | 1,080,000 | 729,000 | 3.32 years |
Case 1 is where the complaint handling cost was underestimated. Halve the unit cost and the current loss becomes 446,400 THB, the post-edge residual becomes 55,800 THB, and the saving shrinks to 390,600 THB. Payback becomes 2.16 years, 35% longer than the base case. The investment decision itself does not change when the assumption moves, but depending on your internal hurdle rate it may land on the borderline.
Case 2 is where the layer 4 cloud integration redesign is only half done and some image traffic remains. If the cloud cost saving reaches only 540,000 THB, half of 1,080,000 THB, payback stretches to 2.49 years. This is precisely the case referred to earlier when we said skipping layer 4 erodes the traffic cost saving. What deserves attention here is that Case 1 and Case 2 affect different benefits. Revising the unit cost does not touch the cloud cost saving, and getting the traffic volume wrong does not touch the escape reduction. If you run sensitivity by applying a single coefficient uniformly to every benefit, the conclusion will swing much further than reality warrants.
Case 3 matters most. On lines where takt time is several seconds or more and a 300 to 800 millisecond round trip causes no actual harm, the escape reduction benefit simply does not exist. All that remains is the 1,080,000 THB cloud cost saving, giving a net benefit of 729,000 THB and payback of 3.32 years. It still pays back in a little over three years, but that is a benefit from reducing traffic rather than a benefit from going to the edge. Part of the same effect can be had through much cheaper measures, such as lowering the resolution of transmitted images or reducing transmission frequency.
Some factories should not prioritise going to the edge
To be honest about it, there are definitely factories that should push edge deployment down their priority list. Equipment with a takt time of several seconds or more, where cloud round-trip latency does no real damage, or a factory where escaped misjudgements produce only a handful of complaints a year. Where those conditions apply, the benefit of going to the edge is thin and the investment priority is low. That factory, or that line, is not where you should start.
In those cases, what deserves attention first is more basic improvement work, such as making visible the processes where no data is being captured at all, or recording downtime. Edge computing is an investment that works only where speed converts into money, and it is not a technology that helps every factory equally. Screening which of your own lines fall into Case 3 is the real first step in the investment decision.
Conditions to Watch When Deploying in a Thai Factory
If you are considering edge deployment in Thailand, you need to look at the local telecom regulatory picture and the capital investment environment alongside the technical requirements. Here is what can be confirmed as of August 2026.
The NBTC spectrum allocation plan for private 5G
Thailand’s NBTC, the National Broadcasting and Telecommunications Commission, has outlined a plan to allocate 100 MHz within the 4.8 GHz band free of charge for private 5G use by factories and industrial estate operators. The plan covers enterprises, factories, and industrial estate operators, is limited to non-commercial internal use, and reportedly does not permit roaming with existing commercial 5G networks on the 2.6 GHz band. Coverage frames the plan as support for the spread of network slicing and edge computing.
The important caveat is that this plan was reported as of September 2025, and as of August 2026 no official launch date has been announced. Building an equipment plan on the assumption that it will be usable during 2026 is therefore something to avoid. When you review wireless architecture inside the plant, the realistic approach is to design around wired connections and Wi-Fi, which are reliably available today, while leaving spare capacity in cable runs and racks so that private 5G remains a future option. Edge deployment stands on its own without private 5G. If anything, the more processing you move to the edge, the less you depend on external bandwidth.
What the trade show calendar suggests about the market
IME2026, an industrial trade fair positioned around strengthening manufacturing ties between Thailand and China, was held in Bangkok in July 2026. We have not been able to confirm individual exhibitors or deployment cases from primary sources, but the fact that trade shows themed on industrial automation and factory digitalisation continue to be held in Thailand is itself an indication that investment in this field is not a passing phase.
Deciding on edge deployment while utilisation is low
According to Matichon’s reporting of figures released by the Office of Industrial Economics under Thailand’s Ministry of Industry, the manufacturing production index was down 3.10% year on year as of June 2026. Average capacity utilisation for the second quarter of 2026 was 57.47%. With utilisation below 60%, caution about capital investment is a natural stance. As of August 2026 the July index has not yet been released, so June is the most recent confirmed figure.
There are two ways to look at edge deployment while utilisation is low. One is that a slow period is exactly when installation and testing time is easiest to secure. Installing edge devices across 30 lines will inevitably touch processes that cannot be stopped during full production. The other is that low utilisation erodes the benefit figures themselves. The calculations in this article are based on line count, but the actual saving depends on the number of units that flow through. We have taken a conservative approach to the accounting, but viewed through a production volume lens, Scenario A’s 1.60 year payback is an optimistic number if utilisation stays at 57.47%. This too is something to check by working the figures back through your own actual production volumes.
Summary, The Numbers to Measure First
Here is the conclusion. Edge computing is not a technology you decide on by asking whether to adopt it. Sort your workloads into Tier 1 through Tier 3 against three criteria, namely time tolerance, outage tolerance, and data volume, and place only Tier 1 at the edge. That is the fastest payback in our model factory calculation.
In the model factory’s numbers, Scenario A, moving only Tier 1 to the edge, delivers a net benefit of 1,510,200 THB against an investment of 2,420,000 THB, paying back in 1.60 years. Scenario B, consolidating everything through Tier 3 inside the factory, delivers a net benefit of 1,362,200 THB against an investment of 5,120,000 THB, paying back in 3.76 years. Investment rises to 2.12 times while net benefit falls to 0.90 times. This is where the paradox appears, namely that making the abandonment of the cloud an objective in itself costs you money.
With that established, there are four numbers we would ask you to measure before you begin. The first is the takt time of the target line, because if it runs to several seconds or more, edge deployment drops down the priority list. The second is the measured round-trip latency of your cloud API, which is the evidence for whether judgement is arriving in time. The third is your monthly cloud spend, which sets the ceiling on possible savings. The fourth is your actual count of escaped misjudgements and the real cost of each one. As the sensitivity analysis showed, the third and fourth are what move the payback period the most. Once you have those four, you can make the decision simply by substituting your own values into the tables in this article.
Before You Start Evaluating Edge
Which of your lines are genuinely Tier 1, and how much of your current cloud spend is actually addressable, cannot be settled from drawings and specifications alone. It takes a look at real takt times and real escape records. TOMAS TECH supports production management and OT/IoT deployment for Japanese-owned factories in Thailand, and we are happy to talk at the evaluation stage, before you have decided whether to proceed at all. It is entirely acceptable to come to us only wanting to see what the tables in this article look like with your own numbers in them. Please get in touch here whenever it suits you.
Frequently Asked Questions
What is edge computing and how does it differ from the cloud
Edge computing processes data close to where it is created, which in a factory means an industrial PC or gateway beside the line. The differences from the cloud approach come down to three things, namely the round-trip time to a decision, whether processing continues when the network drops, and how cost grows as data volume grows. Workloads that need speed and autonomy suit the edge, and workloads that need volume and sustained operation suit the cloud, so a design that leans entirely one way is usually not optimal.
How much does edge computing deployment cost
In our model factory calculation covering 30 lines, moving only the visual inspection AI inference to the edge totalled 2,420,000 THB. That breaks down into 1,140,000 THB for edge devices, 270,000 THB for installation and wiring, 420,000 THB for porting the inference model, 380,000 THB for redesigning cloud integration, and 210,000 THB for training and documentation. Hardware accounts for only 47.11% of the total, while the intangible items of porting, redesign, and training account for 41.74%. Amounts vary with line count and existing architecture, so treat these as indicative.
Should every workload be placed at the edge
No. In the model factory calculation, consolidating Tier 1 through Tier 3 inside the factory takes the investment to 5,120,000 THB, which is 2.12 times the cost of moving only Tier 1. Against that, the net benefit is 1,362,200 THB, roughly 10% less than the 1,510,200 THB delivered by moving Tier 1 alone. Aggregation and retraining do not need speed, so moving them to the edge produces no benefit, while fixed costs such as server maintenance and MLOps operations recur every year.
What does it take to migrate from cloud AI visual inspection to the edge
Three things, broadly. The first is tuning, meaning compressing and quantising the model so it runs on edge hardware, and skipping this means you will not get the speed you expected. The second is redesigning the data pipeline so that metadata alone is sent in normal operation and images are sent only when an anomaly occurs, and skipping this means no traffic cost saving materialises. The third is floor training, because you need people inside the plant who can isolate the cause when judgement starts behaving oddly. The migration itself changes only the location, leaving the existing inspection logic intact, so rebuilding accuracy from scratch is usually unnecessary.
What should we watch out for when deploying edge computing in a Thai factory
Three points. First, the free spectrum allocation for private 5G planned by the NBTC has no officially announced launch date as of August 2026, so avoid equipment plans that assume it. Second, edge hardware has to handle dust, moisture, and temperature conditions as a baseline, and our calculation allows 9,000 THB per unit for installation on that basis. Third, low utilisation erodes the benefit figures, so given the 57.47% average capacity utilisation in the second quarter of 2026, we recommend working the benefits back through your own actual production volumes.
References
- Benefits of edge computing for manufacturing, KOTO ONLINE, confirmed as of August 2026
- What edge computing is, with factory use cases, TMC System column, confirmed as of August 2026
- Criteria for choosing between edge and cloud, XIMIX column, confirmed as of August 2026
- Thailand NBTC plan to allocate 100 MHz of the 4.8 GHz band for private 5G free of charge, MEA Tech Watch, reported September 2025, launch date not announced
- Supplementary coverage of the same plan, TeckNexus, confirmed as of August 2026
- Manufacturing production index and capacity utilisation from Thailand’s Office of Industrial Economics for June 2026 and the second quarter of 2026, Matichon, secondary reporting of an OIE release
- Coverage of IME2026 in Bangkok, an industrial trade fair positioned around deepening manufacturing ties between Thailand and China, TimesTech, held July 2026
- Comparison of edge and cloud AI vision inspection, Overview.ai, confirmed as of August 2026
- PLC and sensor ingestion over OPC-UA and edge gateway architecture, iFactory, confirmed as of August 2026
- Edge computing trends in smart factories in 2026, Avassa, confirmed as of August 2026


