


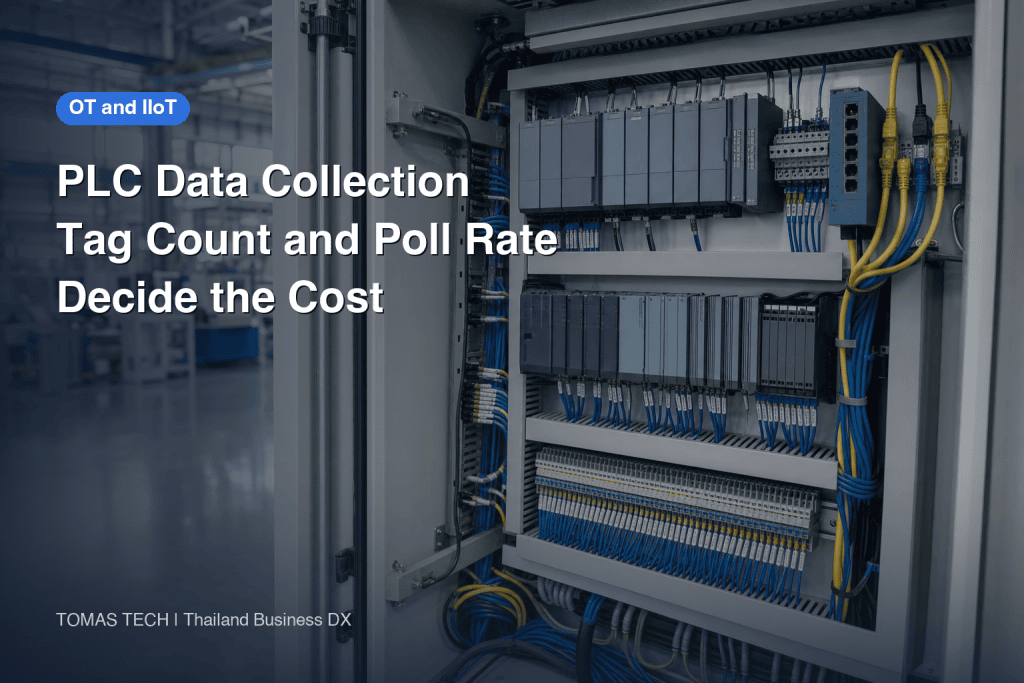
“Can you collect data from this machine’s PLC?” We have never once been able to answer that question with a straight yes or no. What PLC data collection actually decides is not whether it is possible, but which of four routes the job goes down. Fix the route and almost everything else follows automatically: the cost, the ceiling on what values you can get, and what you need to ask the machine builder. And when quotes for the same job differ by an order of magnitude, the real cause is not the choice between OPC UA and Modbus. It is three things. Tag count, polling interval, and the machine builder’s warranty.
What PLC data collection really decides is the route
You put the quotes side by side and, for the same plant and the same number of machines, one is two or three times another. This is not unusual. The difference is often explained away as a difference in protocol, but open up the line items and it usually is not. Each vendor has assumed a different route.
There are only four routes. Read an existing Ethernet-capable PLC directly. Use the OPC UA server function built into the PLC. Add a converter to an old PLC that only has a serial port. Or leave the PLC completely alone and measure from outside. That is the whole list. It is normal for all four to coexist inside a single plant, which is why “can our factory do data collection?” is a question asked at the wrong level of granularity. The route is decided one machine at a time, and each route carries its own unit price and its own ceiling.
For the overall approach to factory IoT and the question of where to start, we have set that out in the big picture of factory IoT monitoring implementation. This article drills into one point inside that picture, getting values out of the PLC, down to the level of routes and money.
Route 1 – reading an existing Ethernet PLC directly (MC Protocol, FINS, S7, EtherNet/IP)
This is the highest-volume route in factories today, in Thailand and everywhere else. The PLC already has an Ethernet port, and an IIoT gateway or an edge device talks to it using the vendor’s own protocol to read the PLC’s device memory directly.
- Mitsubishi Electric MELSEC series – MC Protocol
- Omron – FINS
- Siemens – S7 (S7comm)
- Rockwell Automation – EtherNet/IP (CIP)
In each case the request looks like “read 10 words starting at D100” or “read this named tag,” and what comes back is the value the PLC already holds.
The biggest advantage of this route is that you can start without touching the ladder program. From the PLC’s point of view a read is just an external access request, so you can pull values out of a machine that is running right now without changing a single rung of the existing control logic. Being able to start without stopping a live line has real practical value.
The drawback is that the meaning of a tag is not machine-readable. Nothing anywhere in the PLC says what D100 holds. That knowledge lives in a design document, in a ladder comment, or in the memory of a veteran maintenance technician. To the gateway, D100 is just a 16-bit integer. It cannot tell whether the unit is milliseconds or seconds, whether the production count is cumulative or for the current shift, or whether a value of zero means “stopped” or “communication is down.”
Building that mapping of meaning is the real workload of route 1. It is what sits behind the single line in a quotation that says “configuration.” If you are taking four variables per machine, then for each of those four addresses somebody has to confirm the meaning, the unit, the data type and the update timing, and record it in a tag list. Different machines use different addresses, and even the same PLC model from the same manufacturer will be allocated differently by different machine builders. Skip this step and you end up with collection working perfectly while nobody in the building can interpret the numbers on the dashboard.
One prerequisite for this route is that the PLC is reachable on the plant network. In factories where the control network is separated from the business network, you need a design decision about where the boundary sits and where the gateway goes. We cover the network side in industrial networks and wireless LAN in the factory.
Route 2 – using the PLC’s built-in OPC UA server
Recent mid-range and high-end PLCs ship with an OPC UA server function built in. It is usually enabled through an option unit or a licence key, and once enabled the PLC itself behaves as an OPC UA server, letting external clients browse its address space. OPC UA is internationally standardised as IEC 62541.
The decisive difference from route 1 is that you get metadata along with the value.
| What comes with the value | Content |
|---|---|
| Data type | Integer, floating point or boolean |
| Unit | Engineering unit description |
| Timestamp | When the value is from (source and server timestamps) |
| Quality (status) | Whether the value can be trusted, or whether there is a comms fault or an out-of-range condition |
Some of what a human was copying into a tag list by hand under route 1 now sits on the server side in machine-readable form. That is the main reason to choose OPC UA. Quality (status) in particular pays off in operation, because when a value is zero the receiving side can tell “genuinely zero” from “could not read it.” Route 1 cannot make that distinction, and a comms dropout can be plotted on the chart as a production count of zero.
OPC UA also has subscriptions. A client can register an interest along the lines of “notify me when this variable changes beyond the deadband,” and while nothing changes, no traffic is generated. Compared with polling, where you keep asking at a fixed interval, quiet tags consume neither network nor CPU. That difference becomes significant as the tag count grows.
There are three drawbacks. The first is CPU load. The OPC UA server runs on the PLC’s CPU and shares resources with the control scan, so on a live line you need to check how scan time changes before and after enabling it. The second is licence cost. On many models enabling the function requires a paid licence, and that stacks up per machine. The third is that it is limited to certain models. A PLC installed ten or twenty years ago simply does not have the function.
On standardisation at the field level, the OPC Foundation is working on OPC UA FX (Field eXchange). According to published information, the Controller-to-Controller (C2C) specification is complete, and as of June 2026 a release candidate for the Controller-to-Device (C2D) extension is being prepared. C2D targets the integration of motion devices, remote I/O, sensors and actuators. An interoperability (IOP) event was held at Beckhoff’s Berlin office from 16 to 19 February 2026, and a multi-vendor demo wall is reported to be in preparation for SPS 2026. The timing of a formal release and the version number have not been published, so for a project you are planning now, avoid building the design around C2D. What you can rely on today is the existing OPC UA server function.
Route 3 – adding a converter to a serial-only legacy PLC
PLCs with no Ethernet port, offering only RS-232C or RS-485. There are still a great many of them in operating factories. Here you add a unit inside the panel that converts serial to Modbus TCP or similar.
Modbus is simple to implement, widely supported, and the converters are cheap. In exchange there are three constraints that come from the nature of the protocol.
First, it is polling only. The master asks, the slave answers. That round trip is the only way to get a value. There is no mechanism for the device to tell you when something changed, so “keep asking at a short interval” is the only way not to miss anything.
Second, how you read changes the speed by an order of magnitude. Reading a block of consecutive registers in a single request is a completely different proposition from repeating single-point reads one at a time. Batching into blocks is overwhelmingly faster. On a serial bus like RS-485, the time for one round trip and contention on the bus set the speed ceiling, so reducing the number of requests is the only lever you have. In most projects where somebody says “Modbus is slow,” the protocol is not slow; the reads have simply been built as a loop of single-point requests. This design depends on whether the registers are laid out in a contiguous block, so as with route 1, the tag list of what lives at which address has to come first.
Third, plain Modbus has no authentication, no authorisation and no encryption. Anyone who can reach it on the network can read the registers, and depending on the implementation, write to them. Since you are building a bridge from the control network into the business network, this has to be part of the design. Configuring the gateway as read-only, segmenting with VLANs, making everything downstream of the converter one-way: measures of that kind are required. We have set out how to protect the OT side of a plant in OT security for factories in Thailand.
Route 4 – measuring from outside without touching the PLC
Standalone machines with no PLC, manual machines, and machines that cannot be touched because of the machine builder’s warranty. For these three, measuring from outside is the only option.
There are three common methods.
- Tapping the stack light (signal tower) signals – branch off the green, amber and red lamp signals and read them to determine running, stopped or fault. You are only branching existing wiring, so nothing changes on the PLC side.
- Counting with a photoelectric sensor – place a sensor where finished parts or workpieces pass, and count passes as the production quantity.
- Current sensors – measure spindle or motor current and treat the time above a threshold as running time. A clamp-on type can be fitted without cutting into the wiring.
What this route gives you is running/stopped and production count, and no further. Stop reason codes are not available. You can see that the red lamp came on, but not whether it was a jammed workpiece, a material shortage or a heater fault. Nor can you break down the cycle time into “so many seconds machining, so many seconds transfer.” From outside you see only the result; the internal state of the machine is invisible.
Route 4 should therefore not be thought of as a degraded version of the others. The set of variables it produces is simply different. That is why, in the model plant below, group D’s four machines are counted at two variables each rather than four. For component selection and installation know-how on this route, see IoT enablement and retrofit for legacy equipment, and for the production count question specifically, automating production counting.
Putting the four routes side by side:
| Route 1 direct read | Route 2 OPC UA | Route 3 converter | Route 4 external | |
|---|---|---|---|---|
| Applies to | PLC with built-in Ethernet | OPC UA capable PLC | Serial-only PLC | No PLC, or cannot be touched |
| Ladder modification | Not normally required | Not normally required (enabling is) | Not normally required | Not required |
| Variables available | Everything in the ladder | Same, plus type, unit, timestamp, quality | Everything in the ladder | Running/stopped, production count |
| Main constraint | Tag meaning is not machine-readable | CPU load, licence, model support | Polling only, no authentication | No stop reasons, no breakdown |

Three things no change of protocol will get you
Once the route is settled, there are still situations that end in “we cannot get it.” This is the most practical part of the article. The following three are not solved by changing protocol and not solved by buying a more powerful gateway.
Reason 1 – the value you want is not in the ladder
This is the most common dead end by far.
Suppose someone asks for defect reason codes. The operator picks a reason on the HMI, the value lands in some device in the PLC, and you go looking for it on that assumption. It is not there. The reason it is not there is that nobody ever wrote it in the ladder. A machine can detect a defective part and stop without anyone having implemented logic to classify and encode the reason, because nobody asked for it.
A value that does not exist cannot be read by any protocol. This is not a communications problem, it is a design problem, and so the fix is not on the communications side either. It is a functional addition to the ladder. For in-house machines that means your own engineers; for machines supplied by a machine builder it means a modification request to that builder. Cost, lead time, and on a machine that is running, a stoppage to coordinate.
In a quotation review, this is the first fork that separates “yes we can” from “no we cannot.” When we receive an enquiry about data collection, the first thing we check is exactly this: is that value in the ladder today? If it is not, the project is no longer a data collection project; it is a project that contains a PLC program modification. How to run that modification when it goes to an outside party is covered in outsourcing PLC program development.
As a practical workaround, deciding not to collect what does not exist is a perfectly legitimate choice. Even without stop reason codes, if you have running/stopped, production count and cycle time, you know when each stoppage happened and how long it lasted. Push reason entry onto a tablet as manual input for now, and decide whether the modification is worth it once you have data. Taken in that order, you avoid paying for a modification up front and then discovering that the codes were never used.
Reason 2 – the polling interval is coarser than the scan cycle
The second one is about time. You need the numbers in front of you to get a feel for it.
A PLC repeats input read, logic execution and output update at high speed. One pass is the scan cycle, and depending on program size, machines running at around 10 ms are commonplace. The polling interval on the collection side, meanwhile, is often set to 1,000 ms (one second) for reasons of tag count and network load.
1,000 ms ÷ 10 ms = 100 times. The collection side is looking at the value once for every 100 scans the PLC performs.
What does that coarseness cost you? Take a process with a 30-second cycle time measured at a one-second interval. The start and the end of the cycle each carry up to one second of missed time. So the measurement error is up to ±1 second, which against 30 seconds is 3.33%. That is fine for watching day-to-day trends. It is not enough to verify an improvement worth less than one second per cycle.
Short stoppages are the more serious case.
| Length of stoppage | Caught at a one-second interval? |
|---|---|
| 20 seconds | Yes (it spans multiple polls) |
| 3 seconds | Can be missed as a matter of principle |
A 20-second stoppage will be sampled in the stopped state several times at a one-second interval, so it is recorded reliably. A three-second stoppage, however, can start and finish between two samples, so the machine recovers without the stopped state ever being observed. When somebody says they want to see micro-stoppages and you hand them a generic one-second configuration, the result is that the very thing they wanted to see is the one thing that drops out.
There are only two answers. Raise the collection rate, or have the PLC do the counting. The first one runs into the fact that traffic and server load are set by tag count multiplied by rate, so with many tags it stops being realistic. The second is a ladder modification, as in reason 1, but if the PLC accumulates stoppage count and stoppage time at scan-cycle resolution and the collection side simply reads those accumulators once a second, the coarse interval no longer matters. The principle is to move the measurement closer to the PLC. How to reflect micro-stoppages in OEE on the operational side is covered in micro-stoppages and how to think about OEE.
Reason 3 – machine builder warranty and permission to modify
The third is not a technical problem but a contractual one. And in an operating factory it is usually the strongest constraint of the three.
Machines delivered by a machine builder almost always come with restrictions on modification. The catch is that the scope is not always limited to rewriting the ladder. Even when you only intend to read, the work can turn out to include:
- Adding a communications module (using a slot in the panel)
- Changing the PLC’s communication parameters (station number, IP address, opening a port)
- Enabling the OPC UA server function and installing the licence
- Adding wiring inside the panel and drilling the panel door
How much of that falls inside the warranty depends on the contract and on the builder’s policy. Some builders will say reading only is no problem. Others will say that adding a communications module has to be done by their own people.
There is a technical point to confirm as well. External communication requests land on the PLC’s scan time. On a machine with little control headroom, polling a large number of tags at a short interval can extend the scan time enough to affect the control cycle. That is a judgement only the machine builder can make.
In practice, then, confirmation with the machine builder goes at the very front of the schedule. It is not unusual for an answer to take several weeks, and if the answer is “our own technicians will attend site,” that labour lands in the quotation. The reason the model calculation below carries 35,000 THB per machine of machine builder labour on route 2 is that this is the reality. With that one line in or out, the per-machine cost of route 2 moves from 25,000 THB to 60,000 THB.

The three variables that split quotes by an order of magnitude – tag count, polling interval, warranty
Let us pull everything so far together into three variables, seen from the quotation side. When vendors’ numbers do not line up, the cause is almost always one of these three.
Variable 1, tag count. The total number of variables you collect. Not the number of machines. The same eight machines are 8 tags at one variable each and 32 tags at four variables each. And the licensing of most collection and visualisation software is priced in tiers based on that count.
This article’s model conditions use the following tiers.
| Tag count | Collection server and visualisation software |
|---|---|
| 50 tags or fewer | 180,000 THB |
| 51 to 250 tags | 250,000 THB |
The boundary sits between 50 and 51. At 50 tags it is 180,000 THB; at 51 tags it is 250,000 THB. There is a discontinuity here where one extra tag adds 70,000 THB.
This is not a theoretical point. Option A below comes to 8 machines × 4 variables = 32 tags, which fits inside the 50-tags-or-fewer tier, while Option B comes to 20 machines × 4 variables plus 4 machines × 2 variables = 80 + 8 = 88 tags and moves up into the 51 to 250 tier. Quite separately from the direct increment of adding 16 machines’ worth of gateways and installation work, the software licence tier on its own creates a 70,000 THB difference.
So the question to settle during requirements definition is not “how many machines are we fitting?” but “how many variables per machine, and what is the total tag count?” Go out for competitive quotes without an answer to that, and every vendor will price a different tag count and the comparison will not mean anything.
Variable 2, polling interval. As set out under reason 2, the interval decides accuracy. It also decides cost. Make the interval ten times finer and the data volume per unit time is ten times larger, which hits server storage, network and processing load. On serial systems under route 3, it runs straight into the speed ceiling of the bus.
In practice, a design that does not put every tag on the same interval works well. Variables where you need to catch short changes, such as running/stopped, get a short interval; variables where an accumulated figure is enough, such as a cumulative production count, get a long one. Where OPC UA subscriptions are available, tags that do not change generate no traffic at all.
Variable 3, machine builder warranty and labour. As set out under reason 3. Work that an in-house machine lets you finish yourself becomes a builder labour charge on a machine that was supplied to you. In the model conditions that is 35,000 THB per machine. Put a quote that carries this line item next to one that does not and of course the totals look an order of magnitude apart.
None of the three is about protocol. Choose OPC UA or choose Modbus and the tag count does not change, nor does the warranty clause. The spread in quotes comes from these three variables, not from the standard. For a wider view that splits factory IoT cost into five layers, see breaking factory IoT cost into five layers.
Breaking down cost and payback on a model plant
Now to the money. Every figure below is a calculated estimate under this article’s model conditions, not measured performance from a real site. Unit prices and benefits vary enormously between factories, so read them by substituting your own conditions. What we are trying to show is not the amounts themselves but how the calculation is put together.
Model plant assumptions
| Item | Value |
|---|---|
| Location and sector | Rayong province, Thailand, Japanese-owned, machining and assembly, 220 employees |
| Line operation | 250 days × 2 shifts × 8 hours = 4,000 hours per year |
| Machines in scope | 24 |
| Group A, PLC with built-in Ethernet, in-house machines | 10 |
| Group B, PLC with built-in Ethernet, supplied by machine builder | 6 |
| Group C, serial-only legacy PLC | 4 |
| Group D, no PLC, standalone or manual machines | 4 |
| Variables wanted | 4 per machine (running/stopped, production count, stop reason code, cycle time). Group D only 2 (running/stopped, production count) |
The groups map straight onto the routes. Group A is route 1, group B is route 2 (machine builder supplied, so warranty confirmation and labour cost apply), group C is route 3, group D is route 4. 10 + 6 + 4 + 4 = 24 machines.
Downtime looks like this.
| Item | Value |
|---|---|
| Unplanned downtime per year (all 24 machines) | 380 hours |
| Of which, the 8 bottleneck machines | 240 hours (63.2% of 380 hours) |
| Composition of the 8 bottleneck machines | 5 from group A, 2 from group B, 1 from group C |
| Unplanned stoppage events on the bottleneck machines | 320 per year |
| Average duration per event | 240 hours × 60 minutes ÷ 320 events = 45 minutes |
| Lost profit per hour of downtime | Bottleneck processes 3,200 THB, non-bottleneck processes 0 THB |
That last line is the single most important assumption in this article. Downtime on a non-bottleneck process does not translate into lost profit. If that process stops for an hour, work in progress and spare capacity elsewhere absorb it, and the final shipped quantity does not change. The remaining 16 machines account for 380 − 240 = 140 hours of downtime, and this is why we are not converting those hours into money.
For context, a note on current statistics in Thai manufacturing. Reporting attributed to the Office of Industrial Economics (OIE) at Thailand’s Ministry of Industry puts the manufacturing production index (MPI) for June 2026 at −3.10% year on year, the steepest fall since November 2025, with the second quarter of 2026 at −1.79% and average capacity utilisation at 57.47%. Automotive and petroleum are described as the main drag, while everyday consumer goods such as sugar, detergent, soap and cosmetics are described as recovering.
Reading that 57.47% utilisation figure as “half the equipment is idle, therefore we need data collection” would be a leap. The point that does matter is a different one: when there is slack in utilisation, downtime on non-bottleneck machines is absorbed even more easily than usual. In other words, an investment case for monitoring everything that stacked up during a period of full order books may stop stacking up when utilisation falls. Which processes carry a lost profit of zero moves with the demand environment. Rather than inferring your own numbers from published statistics, confirm them in your own processes.
The benefit estimate (identical for both options)
What changes once you have data? The benefit is that the stoppages themselves get shorter, and it has two components.
| Item | Now | After collection |
|---|---|---|
| Time to detect | 12 minutes | 2 minutes |
| Time to identify the cause | 18 minutes | 8 minutes |
| Total | 30 minutes | 10 minutes |
Detection is the time until somebody notices that the machine has stopped. The 12 minutes today comes from the operator being on another process, the machine not being visible from the control room, and so on. Collect the data and push a notification and it shrinks to 2 minutes. The outcome here depends on how the notification is designed, and we cover recipients and escalation in designing equipment alert notifications.
Identifying the cause is the time from arriving at the machine to working out what happened. With a history of stop reason codes and cycle times you can see on screen what was going on just before, which takes 18 minutes down to 8. Put the other way round, that reduction assumes the stop reason codes are being collected. On machines where only route 4 is available, this 10-minute reduction cannot be expected.
That is 20 minutes per event in total. Multiply by the number of bottleneck events.
- 320 events × 20 minutes = 6,400 minutes per year
- 6,400 minutes ÷ 60 = 106.67 hours per year
- 106.67 hours × 3,200 THB = 341,333 THB per year
- Over five years, 1,706,667 THB
There is something we are deliberately not counting. The reduction in downtime on the 16 non-bottleneck machines. Those should shorten by the same 20 minutes, but since we have set lost profit for those processes at 0 THB per hour, the amount is zero. It does not get added to the benefit.
The temptation to add it is understandable. Count all 24 machines and the benefit number gets bigger and the capex submission goes through more easily. But that number puts a value on having reduced downtime in processes where stopping does not reduce shipments. When you compare it against actuals after go-live, it will never reconcile. There is real qualitative value in the fact that bottlenecks may move in future and that you gain more raw material for improvement work. This calculation simply does not convert that into money.
Option A – narrowing to the 8 bottleneck machines
The scope is 5 machines from group A, 2 from group B and 1 from group C, 8 in total, at 4 variables each.
| Cost item | Calculation | Amount (THB) |
|---|---|---|
| Route 1 (5 machines, group A) | Gateway 45,000 + configuration 15,000 × 5 | 120,000 |
| Route 2 (2 machines, group B) | (Licence 25,000 + builder labour 35,000) × 2 | 120,000 |
| Route 3 (1 machine, group C) | Converter unit 18,000 + installation 9,000 | 27,000 |
| Collection server and visualisation | 32 tags, so the 50-or-fewer tier | 180,000 |
| Network installation | Industrial switches and cabling | 95,000 |
| Initial total | 542,000 |
Tag count is 8 machines × 4 variables = 32 tags, inside the 50-or-fewer tier.
One gateway is enough because this model handles up to 8 nodes per unit. Five machines in group A fit on one. There is a step here: 45,000 THB covers you at 5 machines and at 8 machines alike, and the ninth machine forces a second unit. When you are debating whether to add one more machine, check which side of that step you are on.
Annual operating cost is as follows.
| Item | Amount (THB/year) |
|---|---|
| Software maintenance | 36,000 |
| Connectivity and cloud | 24,000 |
| Tag maintenance and inspection | 30,000 |
| Total | 90,000 |
Over five years:
- Five-year total cost = 542,000 + 90,000 × 5 = 992,000 THB
- Five-year benefit = 1,706,667 THB
- Five-year net benefit = 1,706,667 − 992,000 = 714,667 THB
- Simple payback = 542,000 ÷ (341,333 − 90,000) = 2.16 years (25.9 months)
There is one more ratio in the cost breakdown worth looking at.
| Category | Amount (THB) | Share of initial total |
|---|---|---|
| On the shop floor (routes 1 + 2 + 3) | 267,000 | 49.3% |
| Off the shop floor (collection server + network installation) | 275,000 | 50.7% |
| Initial total | 542,000 | 100% |
Getting the values out of the PLCs on the floor is only half of the initial cost. The other half is the server and the network, which are off the floor entirely. Not knowing this, and spending negotiation time on “can you bring the gateway price down,” buys you a limited amount of movement. In fact the route 1 gateway hardware is 45,000 THB, which does not even reach 10% of the 542,000 THB initial cost.
Option B – fitting all 24 machines
This option fits everything: route 1 on group A’s 10 machines, route 2 on group B’s 6, route 3 on group C’s 4, and route 4 on group D’s 4.
| Cost item | Calculation | Amount (THB) |
|---|---|---|
| Route 1 (10 machines, group A) | Gateway 45,000 × 2 + configuration 15,000 × 10 | 240,000 |
| Route 2 (6 machines, group B) | (25,000 + 35,000) × 6 | 360,000 |
| Route 3 (4 machines, group C) | (18,000 + 9,000) × 4 | 108,000 |
| Route 4 (4 machines, group D) | (External hardware 12,000 + installation 8,000) × 4 | 80,000 |
| Collection server and visualisation | 88 tags, so the 51 to 250 tier | 250,000 |
| Network installation | 165,000 | |
| Initial total | 1,203,000 |
Tag count is 20 machines across groups A to C × 4 variables = 80 tags, plus group D’s 4 machines × 2 variables = 8 tags, for 88 tags in total. That crosses out of the 50-or-fewer tier, so the collection server and visualisation software becomes 250,000 THB. The 70,000 THB difference from Option A is that tier change.
Group A’s 10 machines need 2 gateways, because 10 exceeds the 8-node capacity of one unit.
Annual operating cost:
| Item | Amount (THB/year) |
|---|---|
| Software maintenance | 54,000 |
| Connectivity | 24,000 |
| Tag maintenance | 45,000 |
| Total | 123,000 |
Over five years:
- Five-year total cost = 1,203,000 + 123,000 × 5 = 1,818,000 THB
- Five-year benefit = 1,706,667 THB (the same as Option A)
- Five-year net benefit = 1,706,667 − 1,818,000 = −111,333 THB (a loss)
- Simple payback = 1,203,000 ÷ (341,333 − 123,000) = 5.51 years (66.1 months)
Note that the benefit is identical to Option A. The 16 machines added are non-bottleneck, and lost profit per hour of their downtime is 0 THB. Cost has gone up and not one baht of monetisable benefit has been added.
The gap is 826,000 THB, and it is not the protocol that creates it
The two options side by side:
| Item | Option A, 8 bottleneck machines | Option B, all 24 machines |
|---|---|---|
| Machines in scope | 8 | 24 |
| Tag count | 32 | 88 |
| Initial cost | 542,000 THB | 1,203,000 THB |
| Annual operating cost | 90,000 THB/year | 123,000 THB/year |
| Five-year total cost | 992,000 THB | 1,818,000 THB |
| Five-year benefit | 1,706,667 THB | 1,706,667 THB |
| Five-year net benefit | +714,667 THB | −111,333 THB |
| Simple payback | 2.16 years (25.9 months) | 5.51 years (66.1 months) |
The gap in five-year net benefit is 714,667 − (−111,333) = 826,000 THB.
That 826,000 THB matches the gap in five-year total cost, 1,818,000 − 992,000 = 826,000 THB. Of course it does. The benefit is the same in both options. If the benefit does not move and only the cost grows, the gap in net benefit is exactly the gap in cost.
Here is the one line to put in the approval paper.
What separates Option A from Option B is not the protocol and not the PLC brand. It is only this – when that machine stops, does it genuinely cost you sales?
In a quotation review the discussion tends to concentrate on OPC UA versus Modbus and on which gateway to buy. But under these model conditions, the thing that moved the most money was the choice of which machines to include. Against a gateway unit price of 45,000 THB, narrowing the scope moved 826,000 THB.

Three sensitivity checks
Three checks on how the conclusion moves when the assumptions move. We are not going to manufacture a long list of scenarios to demonstrate that “it works under any assumption.” We would rather put the conditions under which it stops working first.
Sensitivity 1 – lost profit per hour of downtime falls from 3,200 to 1,600 THB.
- Annual benefit = 106.67 hours × 1,600 THB = 170,667 THB per year
- Option A payback = 542,000 ÷ (170,667 − 90,000) = 6.72 years (80.6 months)
Even Option A stops working. It no longer fits inside an investment decision evaluated over five years. The unit value of lost profit moves with utilisation, order backlog and whether production can be shifted elsewhere. Do not carry a payback period calculated at full-capacity rates into a period of weaker demand. The MPI and utilisation movements quoted earlier are indirect evidence that this rate is not a fixed number.
Sensitivity 2 – the reduction in detection and cause identification lands at 10 minutes rather than 20.
- Annual benefit = 320 events × 10 minutes = 3,200 minutes = 53.33 hours, and 53.33 hours × 3,200 THB = 170,667 THB per year
Exactly the same figure as sensitivity 1. The benefit is the product of an hourly rate and a time saving, so halving either factor lands in the same place. The flip side is that there is little point debating these two assumptions independently. If you are testing assumptions in an approval review, asking what the product of the two comes to (hourly rate x time saved) is faster than arguing over each factor in turn.
The realistic reason the saving lands at 10 minutes is on the cause identification side. On machines where the stop reason code is not in the ladder (reason 1), and on machines where only route 4 is available, the 18-minutes-to-8-minutes reduction does not happen. Neglect the reason 1 check and the benefit halves, and that is the mechanism.
Sensitivity 3 – the bottleneck is 4 machines rather than 8.
Reset the assumptions. Bottleneck downtime is 120 hours, event count is 160, the saving is 160 events × 20 minutes = 3,200 minutes = 53.33 hours, and the benefit is 53.33 hours × 3,200 THB = 170,667 THB per year.
If those 4 machines are 3 from group A, 1 from group B and 0 from group C, the initial cost looks like this.
| Cost item | Calculation | Amount (THB) |
|---|---|---|
| Route 1 (3 machines) | 45,000 + 15,000 × 3 | 90,000 |
| Route 2 (1 machine) | 25,000 + 35,000 | 60,000 |
| Route 3 (0 machines) | 0 | |
| Collection server and visualisation | 16 tags, so the 50-or-fewer tier | 180,000 |
| Network installation | 60,000 | |
| Initial total | 390,000 |
Annual operating cost is 70,000 THB.
- Simple payback = 390,000 ÷ (170,667 − 70,000) = 3.87 years (46.5 months)
Here is the paradox. Option A, with 8 machines, pays back in 2.16 years. This option, with 4 machines, pays back in 3.87 years. We halved the scope and the payback got slower.
The reason is fixed cost. The collection server and visualisation software is the same 180,000 THB at 16 tags as at 32 tags. Network installation does not scale exactly with machine count either. The benefit, meanwhile, halves roughly in proportion to the event count. The numerator halves and the denominator does not, so efficiency drops.
So “the tighter the better” is wrong. The correct statement is: narrow to the point where you still gather enough events to dilute the fixed cost. Option A’s 8 machines were the point where the scope packs the most benefit against the fixed cost while staying at 32 tags inside the 180,000 THB tier. Take one machine away and only the benefit falls. Widen the scope instead, and the moment tag count passes 50 the collection server jumps to the 250,000 THB tier, and the moment route 1 exceeds 8 connected machines a second gateway appears. Draw your line with those steps in view.
Five things to check first in a Thai factory
Five items to confirm on site before you go into design. Plan on the same assumptions you would use in a Japanese factory and this is where you stall.
1. Power. Gateways and converter units normally take control power from inside the panel, but there is no guarantee the existing panel has headroom. Check the capacity of the 24 V DC supply unit, the spare breaker positions, and what you are doing about brief supply interruptions. On sites where incoming power quality is unstable, the collection hardware drops out on its own and you get a state where the machine is running but the data has gaps. On a chart, a gap is indistinguishable from a stoppage, which corrupts your utilisation totals. Either fit a UPS, or make sure the collection side can distinguish missing data from a stoppage. One or the other is required.
2. Panel space. Converter units and gateways need somewhere physical to sit. Spare DIN rail, clearance with the panel door closed, and internal panel temperature. In Thai factories, panels sitting in buildings without air conditioning can reach internal temperatures close to the rated limit of the hardware. Check the operating temperature range before anything else in the specification. Where a panel has no room to expand, you end up installing a small extension panel next to it, and that lands in the installation line of the quotation.
3. Network segregation. Where you divide control (OT) from business systems (IT) has to be decided at the point you start collecting. Modbus under route 3 has neither authentication nor encryption, and many of the vendor protocols under route 1 are similarly designed so that anything that can reach the network can read. Placing the gateway at the boundary and sending only what is needed upstream is the baseline arrangement. If you are using an existing wireless LAN, a measured radio survey and coexistence with production traffic go on the list too.
4. Machine builder warranty. As set out under reason 3. Where you have machine builder supplied equipment like group B, the request and the reply take time. Put it at the front of the schedule. Depending on the answer, dropping that particular machine from route 2 to route 4 and measuring from outside is a legitimate decision. You get fewer variables, but you keep the warranty intact and still get running/stopped and production count.
5. Whether the depa 200% deduction is available to you. Thailand has a 200% tax deduction for digitalisation spending by small and medium enterprises. The conditions are as follows.
| Item | Content |
|---|---|
| Eligible entity | A company or registered partnership with paid-up capital of 5 million THB or less and annual income of 30 million THB or less |
| Cap | 300,000 THB |
| Eligible spending | Purchase or rental of software, hardware and smart devices, and digital service fees via a licensed platform |
| Not eligible | General purpose PCs (laptops and desktops) |
| Mandatory condition | The product or service must be depa registered (Thailand Digital Catalog) |
| Deadline | 31 December 2027 |
| Interaction with BOI | It cannot be used for spending by a business receiving BOI corporate income tax exemption, and it cannot be combined with BOI privileges on the same spending |
To be straightforward about it: most Japanese-owned factories operating in Thailand do not meet the SME criteria. Paid-up capital of 5 million THB or less and annual income of 30 million THB or less is not a level that a plant of the size used in this article’s model (220 employees) would normally satisfy. The restriction on spending by businesses receiving BOI privileges is also a condition that often applies in Japanese manufacturing.
On top of that, the cap is 300,000 THB. Against Option A’s initial cost of 542,000 THB, even if it did apply, it would only cover part. It sits better as an item to check if you happen to meet the criteria, rather than something to build into the investment case. For a final determination on eligibility, always confirm with your accounting firm or a tax specialist. What this article can show goes as far as the published criteria and no further.
One further piece of context that affects cost levels. Thailand’s minimum wage was raised to 400 baht per day (372 baht before the revision) from 1 July 2025 in Bangkok and in industrial areas including Chonburi and Rayong, and it has been held at that level into 2026. Nationwide the range is 337 to 400 baht. An operation where people walk the floor to discover stoppages, ask around for the cause, write it on paper and enter it later gets heavier every year by exactly that wage increase. A data collection investment decision is the kind of decision to look at alongside this labour cost trend.
For the wider industrial policy context, the World Bank’s Thailand Economic Monitor of February 2026 carries the theme “Advanced Green Manufacturing for Growth.” The fact that equipment upgrading and digitalisation are on the policy agenda is useful background material for an internal briefing document.
A 90-day sequence
A realistic way to proceed, assuming you take the narrowing approach.
Weeks 1 to 2 – count the downtime you actually had. Gather the stoppage records for the past 12 months and total downtime and event counts by machine. Then split them in two according to whether the stoppage reduced shipped quantity. That classification is the identification of your bottlenecks. If the records end at “adjusted” or “repair complete” and cannot be classified, fixing that comes first. The deliverable at this stage is a single table. If the result is that almost none of your downtime can be monetised, it is legitimate to put the data collection investment on hold. Keeping the process capable of accommodating that branch matters.
Weeks 3 to 4 – sort the machines into groups. Classify the candidate machines by whether they have a PLC, whether they have Ethernet, whether they have an OPC UA server function, and whether they were supplied by a machine builder or built in-house. That classification is the route assignment. At the same time, send out your enquiries to the machine builders this week. Waiting for those answers is the longest lead time in the sequence.
Weeks 5 to 6 – fix the variables and produce the tag count. Decide what to collect for each machine. This is where you carry out the reason 1 check: confirm one by one, from the design documents or from inside the PLC, whether each variable you want actually exists in the ladder. For those that do not, decide whether to modify or to leave them out for now. When this is done, the total tag count is fixed and the software licence tier is settled. This is the week where quotation accuracy changes by an order of magnitude.
Weeks 7 to 8 – assign intervals and settle the configuration. Decide the collection interval per variable. If any variable exists to catch micro-stoppages, decide here whether to raise the rate or have the PLC count. In parallel, confirm gateway quantity and mounting positions, network segments, panel space and power on site. Only at this stage does a quotation match reality.
Weeks 9 to 11 – installation and communications verification. Fit the hardware, confirm communications, and check that the values behave as expected. The verification here is not “did communication succeed” but “does the meaning of the value match.” Operate each machine by hand and check it one at a time: does the production count go up by one, does the running flag drop when you stop the machine, does the cycle time agree with a stopwatch. On route 1 it is not unusual for this exercise to turn up an address that was mapped to the wrong thing.
Weeks 12 to 13 – agree the operating rules. Notification recipients and escalation, the rules for entering stop reason codes, how missing data is handled, and how long data is retained. Stand up a visualisation screen without settling these and nobody will be looking at it in three months. The objective is not to build a screen; it is to shorten a 45-minute stoppage. Write down who does what, and within how many minutes.
You do not need to finish all 24 machines in 90 days. Running one full cycle on a narrowed set and measuring the benefit before expanding to the next group gives you better quotation accuracy and better operating rules on the second lap. The 8 machines in Option A are exactly that first lap.
Frequently asked questions
Does PLC data collection require modifying the ladder program?
For route 1 (direct read of an existing Ethernet PLC) and route 3 (serial conversion), reading existing values does not normally require any ladder modification. Route 2 (OPC UA server function) requires enabling the function and installing a licence, but the control logic itself does not change. Modification becomes necessary when the value you want does not exist in the ladder in the first place. The classic case is the stop reason code: unless somebody has classified it in the ladder and written it to a device, no protocol will read it. Likewise, if you want to reliably catch micro-stoppages shorter than the collection interval, having the PLC do the counting is the realistic answer. For machine builder supplied equipment, checking the warranty clauses comes first.
OPC UA or Modbus TCP – which should we choose?
In most cases it is not a choice; the equipment decides it for you. The OPC UA server function only appears on recent mid-range and high-end models, and an old PLC with nothing but a serial port gives you no option at all. It is normal for different routes to coexist across machines inside one plant.
That said, the difference in character is worth setting out. OPC UA attaches type, unit, timestamp and quality to each value, and subscriptions let you be notified only on change. Modbus is polling only, needs to be designed around block reads of consecutive registers to get any speed, and the bare specification has no authentication and no encryption.
MQTT Sparkplug is sometimes brought into the comparison, but OPC UA and Sparkplug are less competitors than a division of labour. Sparkplug is an Eclipse Foundation specification that adds a standardised topic namespace, typed payloads and birth/death certificates (so the receiving side can always tell whether a device is online) on top of plain MQTT. OPC UA PubSub over MQTT also exists as a combination. Rather than “one or the other,” the arrangement closer to practice is to use them for different layers – one for extracting from the floor, the other for distributing upstream.
Can we collect data from legacy equipment?
Yes, but the range of variables changes. If there is a PLC with a serial port, route 3 (add a converter unit) applies. If there is no PLC at all, as on standalone or manual machines, route 4 applies (tapping the stack light signals, photoelectric sensors, current sensors).
What route 4 gives you is running/stopped and production count, and no further. Stop reason codes and cycle time breakdowns are not available. This is not a limitation of the hardware; it is structural, because you are looking from outside. It is also why group D’s 4 machines in this article’s model plant are counted at two variables rather than four. When someone tells you “we can collect from legacy equipment too,” ask them to spell out the list of variables you will get. Checking at the granularity of variables rather than machine count is the point.
How many IIoT gateways do we need?
It is decided by node capacity and network segmentation, not by machine count. This article’s model conditions assume a unit that handles up to 8 nodes, so Option A’s 5 route 1 machines carry 1 unit (45,000 THB) and Option B’s 10 route 1 machines carry 2 units (90,000 THB). There is a step where one unit covers you at 5 machines and at 8 machines alike, and the ninth machine forces a second unit.
In reality the count can rise for physical reasons on top of that, such as panels being far apart or the network being split into separate segments. Conversely, the gateway unit price is not a large share of the total initial cost. In Option A, out of a 542,000 THB initial cost the gateway hardware is 45,000 THB, while the collection server and visualisation software at 180,000 THB and network installation at 95,000 THB weigh far more heavily. Rather than debating the unit count, first check which side of the licence tier your tag count sits on.
Will PLC data collection let us see micro-stoppages?
It depends on the collection interval. At a one-second polling interval, a 20-second stoppage spans multiple samples and is recorded reliably, while a three-second stoppage can, depending on timing, be over before it is ever observed. If the PLC scan is 10 ms and collection is 1,000 ms, the collection side is looking at 100 times coarser resolution. Measure a process with a 30-second cycle time at a one-second interval and the error is up to ±1 second, or 3.33%.
If you want to reliably catch short micro-stoppages there are two ways. Raise the collection rate, or have the PLC count stoppage occurrences and stoppage time and simply read those accumulators. The second is a ladder modification, but it is reliable because it removes the interval constraint entirely. State “we want to see micro-stoppages” as a requirement about interval, not about protocol. How to reflect the micro-stoppages you catch in OEE is a separate design question.
Summary
PLC data collection is not a binary of “we can” and “we cannot.” What is decided is which of four routes the job goes down: direct read of an existing Ethernet PLC, the OPC UA server function, adding a serial converter, or external measurement that never touches the PLC. Fix the route and the unit price, the range of variables and the questions for the machine builder are all fixed with it. Since it is normal for all four routes to coexist in one plant, do not ask “can we collect here?” but judge it one machine at a time.
Three things are not solved by changing protocol. A value that does not exist in the ladder cannot be read by any protocol. If the collection interval is coarser than the scan cycle, short stoppages drop out as a matter of principle. And the machine builder’s warranty clauses are a contractual question, not a technical one. These three connect directly to the three variables that split quotes by an order of magnitude – tag count, polling interval and warranty.
We costed it out under model conditions. Option A, narrowing to the 8 bottleneck machines, comes to 542,000 THB initial, 992,000 THB over five years, a five-year net benefit of +714,667 THB and payback in 2.16 years. Option B, fitting all 24 machines, comes to 1,203,000 THB initial, 1,818,000 THB over five years, a five-year net benefit of −111,333 THB, which is a loss, and payback in 5.51 years. The gap is 826,000 THB. Since the benefit is the same 1,706,667 THB in both options, that gap is purely the difference in cost.
What separates them is not the protocol and not the PLC brand, but only whether a stoppage on that machine genuinely costs you sales. It is the same reason we did not add the downtime reduction on the 16 non-bottleneck machines into the benefit. Adding it makes the approval easier, but it guarantees the numbers will never reconcile after go-live.
At the same time, tighter is not automatically better. With a bottleneck of 4 machines, an initial cost of 390,000 THB pays back in 3.87 years, slower than the 2.16 years at 8 machines, because the 180,000 THB fixed cost of the collection server stays where it is. The accurate way to put it is narrow to the point where you still gather enough events to dilute the fixed cost.
Change the assumptions and the conclusion changes. If lost profit per hour of downtime goes from 3,200 THB to 1,600 THB, Option A’s payback stretches to 6.72 years and stops working. If the saving lands at 10 minutes rather than 20, the benefit lands at the same 170,667 THB per year. Which is why the first thing to do is not to collect three quotes, but to total the past 12 months of stoppage records by machine and split out which of them reduced shipped quantity. With that one table in hand, the question of which machines to fit answers itself.
Which route applies, and which machines belong in scope, cannot be judged without looking inside the panels and at the downtime history. TOMAS TECH is based in Bangkok and supports manufacturers across factory IT, OT and IoT, and FA. We are happy to be involved before PLC model selection and before the quotation, at the stage of working machine by machine through which route each one falls into and whether the variables you want are actually in the ladder. That includes organising the questions for your machine builders and surveying space and power in the existing panels, all shaped around the situation on your own shop floor. To get in touch, please use our contact page.
References
- OPC Foundation, “Field Level Communications Corner (June 2026)” – completion of C2C for OPC UA FX, preparation status of the C2D extension, the IOP event and activity towards SPS 2026
https://opcconnect.opcfoundation.org/2026/06/field-level-communications-corner-june-2026/
- EMQ, “A Comparison of IIoT Protocols – MQTT Sparkplug vs OPC UA” and HiveMQ, “IIoT Protocols – OPC UA, MQTT, Sparkplug Comparison” – Sparkplug’s topic namespace, typed payloads and birth/death certificates, and the division of labour with OPC UA
https://www.emqx.com/en/blog/a-comparison-of-iiot-protocols-mqtt-sparkplug-vs-opc-ua and https://www.hivemq.com/resources/iiot-protocols-opc-ua-mqtt-sparkplug-comparison/
- Trout Software, “Real-time PLC Data Streaming – OPC UA, Modbus and Modern Integration Patterns” – Modbus polling and block reads, the speed ceiling on serial, and OPC UA subscriptions
- Xinhua (27 July 2026) – Thailand’s manufacturing production index (MPI) for June 2026 at −3.10%, Q2 at −1.79%, average capacity utilisation at 57.47% (sourced to the Office of Industrial Economics, Ministry of Industry)
https://english.news.cn/20260727/f8b7ceb202d04b1f8facbcbf44ed60ce/c.html
- Mahanakorn Partners Group, “Thailand Approves New Tax Incentive to Accelerate SME Digital Transformation” – eligibility for the depa 200% deduction, the 300,000 THB cap, the depa registration requirement and the 31 December 2027 deadline
- JETRO Business Briefing (July 2025) – Thailand’s minimum wage at 400 baht per day in Bangkok and the industrial areas
https://www.jetro.go.jp/biznews/2025/07/b21007a1ac8f7fca.html
- World Bank, “Thailand Economic Monitor February 2026 – Advanced Green Manufacturing for Growth”
- Office of Industrial Economics (OIE), Industrial Indices – the primary source for the MPI


