


Put three vendor quotations for a factory monitoring system side by side and you may find that they cannot be compared at all. All three say SCADA on the cover page, but one of them only records data, one only puts it on a screen, and only the third can actually send an instruction back to the equipment. The honest answer to what is SCADA has far less to do with how the dashboard looks than with whether the system is allowed to write. This article defines exactly where that boundary sits, and uses a costed model of a Japanese-owned plant in Thailand to show which line item grows the moment you cross it.
What SCADA is. Not seeing, but acting
SCADA stands for Supervisory Control and Data Acquisition. Most people read that phrase as a description of watching. Supervisory sounds like observation, data acquisition sounds like collection, and the picture that forms is a large monitor with equipment status tiled across it. The centre of gravity of the definition, though, sits in the word that gets skipped over, which is control. Supervisory control means the system can write values back to the equipment, not merely read them and draw a graph.
That distinction is not wordplay. A read-only system and a write-capable system require different design, different verification, and a different answer to the question of who is accountable when something goes wrong. The worst case for a read-only system is that data is missing. The worst case for a write-capable system is that a machine moves when nobody intended it to. That gap shows up directly in the price.
Despite this, four genuinely different classes of system are sold under the same word. There is the data logger, which collects and stores. There is the visualisation layer, which adds screens and alerts on top. There is SCADA, which can write back to the equipment. And there is SCADA plus MES, which adds order-level instructions and production records. In a brochure these four are almost indistinguishable, because all of them are illustrated with the same photograph of trend charts and utilisation pie charts.
So this article does two things. First it defines the two boundaries that separate the four classes. Then it builds up, line item by line item, what crossing each boundary costs, using a model plant in Chonburi, Thailand. Every baht figure below is a modelled estimate that TOMAS TECH has assembled from real project pricing. None of it is official statistics or industry survey data. Read it as a measuring stick to hold against the quotations on your own desk.
The two boundaries that separate SCADA

What separates the four classes is not the length of the feature list. There are two boundaries at which the character of the system changes, and crossing them changes what the system is, not just what it does. The first boundary is read-only versus write-capable. The second is the second-by-second state of a machine versus the order-by-order record of production.
The first boundary. Read-only or write-capable
A data logger and a visualisation tool read values from PLCs and sensors. They store those values, chart them, and send an email or chat notification when a threshold is crossed. Up to this point the system has done nothing to the equipment. From the machine’s point of view, somebody is standing beside it looking at a gauge.
SCADA crosses that line. An operator presses a button on the screen and a setpoint changes. An alarm is acknowledged and a flag drops on the equipment side. A line stop instruction reaches the controller. The moment write-back exists, the system stops being an observer and becomes a participant.
Participation changes the quality bar. If the screen freezes, the operator cannot operate. If one server goes down, supervision is gone. Without a permission design that prevents mistaken operation, somebody with no authority can change a setpoint on a live line. In the IT world, the acceptable answer to most of this is to restart it and move on. In an OT world where writing is permitted, it is not.
Whether you should cross this boundary is decided by how the work actually runs, not by a wish list of features. If operators already stand in front of the machine and use the physical panel, being able to operate from a screen may add little. If the plant is large and people lose minutes walking to equipment, or if setpoints across several lines need to be aligned from one place, then write access earns its cost.
The second boundary. Seconds of machine state or orders of record
SCADA is for the floor, MES is for management. That is the common explanation, and it is useless for making a decision. The explanation that is usable cuts along the time axis instead.
SCADA deals with the present, measured in seconds. What is the temperature, is the motor turning, is an alarm active. Its subject is equipment, and its resolution is seconds or milliseconds. History accumulates in a historian database, but the core job of the system is to render this instant correctly and, if required, to intervene in it.
MES deals with the record, measured in orders. How many pieces were produced against this work order, which lot of material was consumed, who ran which operation, how many parts fell outside specification. Its subject is the product and the order, and its resolution is the operation step, or at best the minute.
Both are looking at the same machines in the same plant, but because they cut the world differently they need entirely different data structures. SCADA models the world as a set of tags, or signal points. MES models it as a hierarchy of orders and lots. Forcing one product to do both usually makes one of the two feel unnatural. The cost structure and rollout sequence of the MES layer is covered separately in our article on MES implementation cost and rollout, which is worth reading alongside this one if Type 4 is on your list.
Where it sits in the ISA-95 hierarchy
These two boundaries line up almost exactly with the levels of ISA-95, the international reference model for manufacturing information systems. Level 0 is field devices such as sensors and actuators. Level 1 is control, meaning PLCs and DCS. Level 2 is supervision, which is SCADA. Level 3 is manufacturing execution, which is MES. Level 4 is the business system, which is ERP. SCADA sits at Level 2, supervising PLCs and raising alarms. MES sits at Level 3, handling scheduling, work instructions, and production data collection.
The point to hold on to is that this hierarchy is a way of drawing lines of responsibility, not an instruction for buying products. ISA-95 does not say buy a Level 2 product and then buy a Level 3 product. It gives you the vocabulary to separate who is accountable for second-by-second equipment state from who is accountable for order-level results. In practice some products bundle SCADA and MES functions into a single package, and there is nothing wrong with that. What goes wrong is packing both roles onto the same screens while responsibility stays vague and nobody is checking the whole for consistency.
Traditionally, information moved between these levels through point-to-point integrations. MES to ERP, MES to SCADA, SCADA to historian. The more integration links there are, the harder it becomes to predict the blast radius when one of them changes. Cutting responsibility along the hierarchy is what lets you say with confidence that a given change lives at Level 2 and therefore does not touch Level 3. That is the practical value of the model.
Comparing the cost of the four classes
From here the discussion is numerical. The model is a Japanese-owned parts machining plant in Chonburi, Thailand, with 30 machines of which three are main lines, running two shifts, 25 days a month, for 4,800 hours a year. The installed PLC base is mixed, with Mitsubishi, Omron, and Siemens controllers all in service. Today the plant runs on paper daily reports and on people walking the floor to look at stack lights, so there is a long delay between an abnormality occurring and somebody noticing it. Lost output from downtime is costed at 420 baht per minute. To repeat the earlier caution, this is a hypothetical plant modelled by TOMAS TECH, not an average derived from a statistical survey.
Initial cost, annual cost, and five-year total
| Class | What it can do | Initial cost | Annual cost | Five-year total |
|---|---|---|---|---|
| Type 1 — Data logger | Read only. Records for later analysis | 1,200,000 | 120,000 | 1,800,000 |
| Type 2 — Visualisation | Read plus display and notify | 1,700,000 | 350,000 | 3,450,000 |
| Type 3 — SCADA | Read plus write. Operate, alarm, and stop | 5,500,000 | 640,000 | 8,700,000 |
| Type 4 — SCADA plus MES | Type 3 plus order-level instructions and records | 9,700,000 | 1,160,000 | 15,500,000 |
All figures are in Thai baht. Read the table alone and the progression from Type 1 to Type 4 looks orderly, but the increments are anything but uniform. Opening up the breakdown shows exactly where the character of the system changes.
The 1,200,000 initial cost of Type 1 is built up from six edge gateways at 65,000 each, which is 390,000, plus PLC connection and tag definition for 30 machines at 12,000 each, which is 360,000, plus a collection server and historian database at 280,000, plus installation and cabling at 170,000. The annual cost is 10% of the initial figure, or 120,000. There are no screens in this layer. Data accumulates, but somebody has to open a tool and aggregate it to see anything. The cost range of this layer overlaps almost entirely with what we covered in the cost of factory IoT.
Type 2 adds 500,000 to Type 1. That is 20 visualisation screens at 18,000 each, which is 360,000, plus notification integration at 140,000. Its annual cost of 350,000 is the 120,000 maintenance from Type 1, plus 180,000 for visualisation licences and cloud, plus 50,000 for the notification service. This is the point at which the plant can actually see. It is also the limit of what it can do.
Type 3 adds 3,800,000 to Type 2. The breakdown is a SCADA licence for 2,000 tags at 850,000, 35 operator screens at 28,000 each for 980,000, a two-server redundant configuration at 620,000, network zoning with two layer 3 switches and two industrial firewalls including configuration at 540,000, safety review and permission design at 380,000, and verification with written procedures at 430,000. Its annual cost of 640,000 is the 350,000 from Type 2 plus 170,000 of SCADA licence maintenance plus 120,000 for redundancy inspection and recovery drills.
Type 4 adds 4,200,000 to Type 3. The MES itself is 1,800,000, four integration links at 350,000 each come to 1,400,000, and shop floor operating design is 1,000,000. Its annual cost of 1,160,000 is the 640,000 from Type 3 plus 340,000 of MES maintenance plus 180,000 of integration maintenance. Note that integration and operating design together, at 2,400,000, cost more than the MES product itself. An MES does not run standalone. It only produces value once it is connected to SCADA, ERP, quality systems, and shipping.
Comparing what each class actually lets you do
Numbers alone do not support a decision, so it helps to put the four classes into the same situation and watch how each behaves. Take one main line stopping late at night.
With Type 1, somebody opens the data the next morning and discovers the stoppage happened. The material for root cause analysis is there, but the downtime that night is unchanged. With Type 2, a notification reaches the responsible engineer’s phone the moment the line stops. Detection is faster, but the machine stays down until a human arrives and touches the panel. With Type 3, in addition to the notification, an operator can check the state from a screen and, if conditions allow, perform a recovery action remotely. With Type 4, all of that is automatically tied to which work orders slipped by how many pieces and which lots were affected.
Translating that difference into money is the job of the benefit table two sections below. Before that, though, the 3,800,000 that Type 3 adds deserves a much closer look, because that breakdown is the single most important thing in this article.
The moment you allow writing, what grows is not the licence
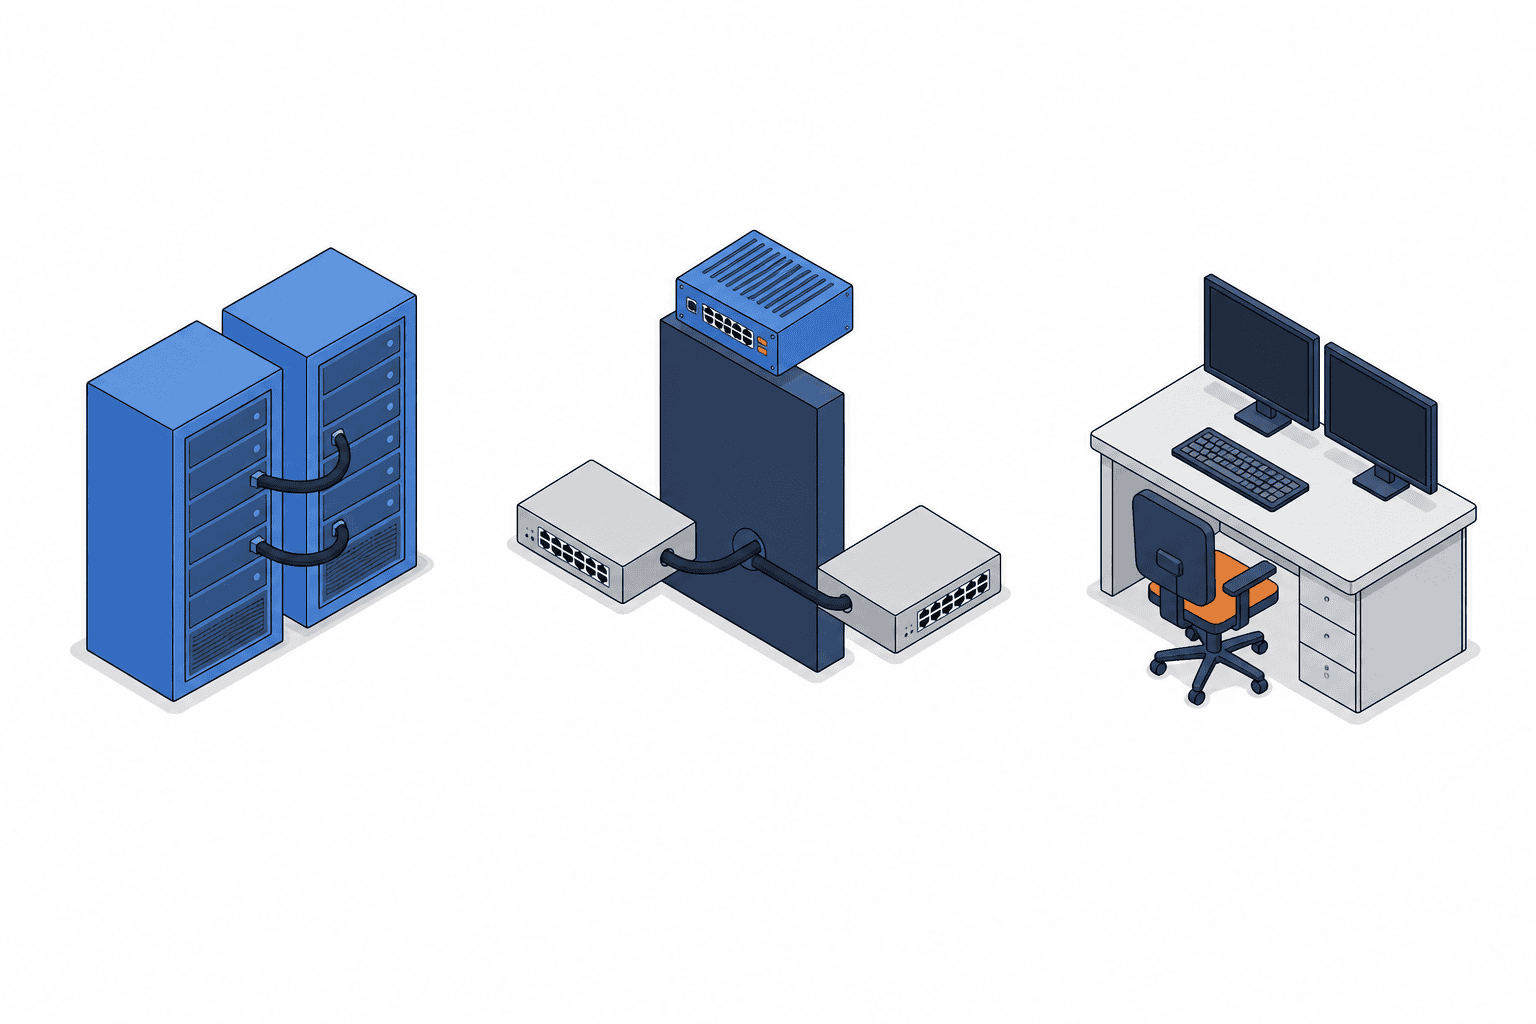
Moving from Type 2 to Type 3 takes the five-year total from 3,450,000 to 8,700,000, which is about 2.5 times as much, since 8,700,000 divided by 3,450,000 is 2.52. Most executives who see that number conclude that SCADA software must be very expensive. Open the breakdown and the story is completely different.
Of the additional 3,800,000, the SCADA licence accounts for only 850,000. The remaining 2,950,000 is operator screens at 980,000, the two-server redundant configuration at 620,000, network zoning at 540,000, safety review and permission design at 380,000, and verification with written procedures at 430,000. Divide 2,950,000 by 3,800,000 and you get 78%. In other words, 78% of the increase is not the price of software. It is the price of being allowed to write to the equipment in your factory.
Each of those five line items exists for a specific reason.
The 35 operator screens at 980,000 are more numerous than the 20 screens in Type 2, and the unit price rises from 18,000 to 28,000, because a screen that writes is designed differently from a screen that displays. It needs a confirmation step to prevent mis-taps, permission-based hiding and showing of controls, defined behaviour when the connection drops mid-operation, and an operation log. None of that is required on a display-only screen. This is not a matter of building the same screen 35 times.
The two-server redundant configuration at 620,000 exists because losing supervision is no longer tolerable. In a read-only layer, half a day of server downtime means a hole in the data. When the server is the operator’s window onto the process, losing it means the operator can do nothing from the screen, and worse, cannot tell whether the equipment is healthy or the supervision has simply died. That inability to distinguish the two is the most dangerous state on a shop floor.
Network zoning at 540,000 exists to stop lateral movement from the IT network into the OT network. Installing SCADA creates a path that did not exist before, a logical route from an office PC to factory equipment. Industrial firewalls and layer 3 switches carve the network into zones and restrict the direction and type of traffic permitted between them. This line item is the design and configuration work for that.
Safety review and permission design at 380,000 is the work of deciding and documenting who may change which value on which machine and in which machine state. It is less a technical task than a consensus-building task, and it crosses production engineering, maintenance, quality, and safety. That is why it takes time.
Verification and written procedures at 430,000 is the work of confirming and recording that writes behave as intended and, just as importantly, that they do not happen under conditions where they must not. A read-only system can be accepted once the charts render. A write-capable system has to demonstrate not only that it could write, but that it could not write when writing was forbidden. The number of test cases is an order of magnitude larger.
The right question is therefore not whether to install SCADA. It is whether this plant genuinely needs to write to its equipment, and if it does, who owns that responsibility. A plant that does not need to write and buys SCADA anyway pays for that 78% and never uses it. Conversely, a plant that does need to write but settles for Type 2 forfeits the largest benefit line entirely, as the next section shows.
Where the benefits come from
Having costed the four classes, the next step is to build up what Types 1, 2, and 3 return each year in the same model plant.
Annual benefit by source
| Source of benefit | Type 1 | Type 2 | Type 3 |
|---|---|---|---|
| Faster detection of abnormalities | 0 | 604,800 | 1,209,600 |
| Automated daily reports and inspection records | 78,000 | 78,000 | 78,000 |
| Early detection of out-of-spec defects | 100,000 | 150,000 | 300,000 |
| Reduced changeover waiting | 0 | 0 | 1,008,000 |
| Total | 178,000 | 832,800 | 2,595,600 |
Each row has a basis. Faster detection of abnormalities assumes 240 abnormal events a year. Type 3 lets an operator confirm the state on screen and act immediately, cutting an average of 12 minutes, so 240 times 12 times 420 gives 1,209,600. Type 2 sends the notification but still depends on a person walking over and operating the panel, so the saving is half that at 6 minutes, or 240 times 6 times 420, giving 604,800. Type 1 only reveals the event afterwards, so it contributes nothing.
Automated daily reports and inspection records is three people at 40 minutes a day over 300 days, which is 600 hours, valued at 130 baht per hour to give 78,000. This benefit accrues as soon as records are captured automatically, so it is identical across all three classes. The same row also shows why data capture alone cannot justify the Type 1 investment.
Early detection of out-of-spec defects is costed at 15,000 baht per incident. Type 3 detects the moment a parameter leaves its window and can intervene, avoiding 20 incidents a year for 300,000. Type 2 requires a person to see the notification and then act, so it avoids 10 incidents for 150,000. Type 1 contributes 100,000 through improvements driven by after-the-fact analysis.
Reduced changeover waiting is 1,200 events a year times 2 minutes times 420, giving 1,008,000. The important detail is that this row exists only for Type 3.
Why Type 2 does not reduce changeover waiting
Plants evaluating the visualisation layer often ask whether adding screens will also shorten changeover waiting. It will not, for a simple reason. Looking at a screen does not send an instruction back to the equipment.
Most changeover waiting takes one of two forms. Either the next operator is slow to notice that the previous step has finished, or a person moves ahead before the equipment-side changeover conditions are met. Type 2 makes both visible, but somebody still has to walk to the machine and use the panel afterwards. The longer the distances between process steps, the more that walking time is the substance of the waiting.
With Type 3, setting the next conditions and issuing a changeover instruction can be done without leaving the desk. What reduces the walking is write access, not display. Visualisation reduces the delay in noticing. SCADA reduces the delay in acting. They are different things, and the second is worth more money. In fact, 1,008,000 of the 2,595,600 that Type 3 returns, roughly 39%, comes from changeover waiting alone.
Why Type 1 does not pay back on its own
The data logger class returns 178,000 a year. Over five years that is 178,000 times 5, or 890,000, against a five-year total of 1,800,000. The five-year net is therefore -910,000. On its own it does not pay back.
That does not make Type 1 pointless. It makes Type 1 a foundation for something built on top of it, and the mistake is expecting a foundation to pay for itself. The edge gateways, the tag definitions, and the historian database all carry forward intact when the plant moves to Type 2 or Type 3. Put the other way round, starting small with a data logger and seeing how it goes is only defensible if there is a real intention to move to Type 2 or Type 3. If the plant looks at the results and stops, the 1,200,000 already spent is never recovered.
Phasing the investment is still a sound decision. But the reason is not that the first phase pays back quickly. It is that tag definition and equipment connection, the most labour-intensive work in the whole project, gets done up front. If that distinction is not shared internally, the budget review a year later will grade the project as showing no results, and the most important next step will be cancelled.
The four classes seen through payback and five-year net
Now cost and benefit meet.
| Class | Five-year total | Annual benefit | Annual net | Payback | Five-year net |
|---|---|---|---|---|---|
| Type 1 — Data logger | 1,800,000 | 178,000 | 58,000 | Does not pay back | -910,000 |
| Type 2 — Visualisation | 3,450,000 | 832,800 | 482,800 | 42 months | 714,000 |
| Type 3 — SCADA | 8,700,000 | 2,595,600 | 1,955,600 | 34 months | 4,278,000 |
| Type 4 — SCADA plus MES | 15,500,000 | 4,095,600 | 2,935,600 | 40 months | 4,978,000 |
Payback is the initial cost divided by the annual net, where the annual net is the annual benefit less the annual cost. Type 2 is 1,700,000 divided by 482,800, or 3.52 years, which is 42 months. Type 3 is 5,500,000 divided by 1,955,600, or 2.81 years, which is 34 months. Type 4 is 9,700,000 divided by 2,935,600, or 3.30 years, which is 40 months. The five-year nets are 832,800 times 5 minus 3,450,000, giving 714,000 for Type 2, then 2,595,600 times 5, or 12,978,000, minus 8,700,000, giving 4,278,000 for Type 3, and 4,095,600 times 5, or 20,478,000, minus 15,500,000, giving 4,978,000 for Type 4.
The 4,095,600 annual benefit of Type 4 is the 2,595,600 of Type 3 plus 1,500,000 attributable to MES. That splits into 480,000 from eliminating manual entry of production records, 420,000 from removing progress chasing and expediting, and 600,000 from being able to bound the scope of a non-conforming lot. The last of those rarely appears on a business case, yet when a market defect surfaces it decides how narrowly you can restrict a shipment hold. Its real value is decision speed rather than the number itself.
The relationship that deserves the most attention in this table is the one between Type 3 and Type 4. Type 4 returns 700,000 more over five years, but it pays back six months later, at 40 months against 34. Moving from Type 3 to Type 4 is therefore not a decision to add features. It is a decision to push payback further out in exchange for a larger total return.
That difference is decisive in an internal approval process. If head office caps the acceptable payback period, whether 40 months clears the bar determines the answer. If the company evaluates on cumulative five-year benefit instead, Type 4 wins. The same figures produce opposite conclusions depending on which metric is applied, which is why you should establish which metric your own company decides on before you start comparing quotations.
For completeness, Type 2 does produce a positive five-year net of 714,000, but the gap to Type 3 is 3,564,000. If the only reason for choosing Type 2 is that it is cheaper, that choice gives up 3,564,000 baht of return over five years. Type 2 is the right answer when the plant genuinely has little need to write, or when the organisation is not yet able to carry the responsibility that writing brings.
Choosing the protocol. OPC UA and MQTT Sparkplug B
Any SCADA architecture discussion eventually reaches the question of OPC UA versus MQTT Sparkplug B. Here too, asking which one is better is the wrong framing.
OPC UA is a client-server request-response model in which the client queries the server for values. It is polling-based at heart, and its strength is a standardised information model that gives industrial data defined meaning. It suits communication that stays inside the plant, such as the link between SCADA and PLCs, where you need to fetch well-defined data continuously and reliably.
MQTT Sparkplug B is a publish-subscribe model mediated by a broker, transmitting only when a value changes, an approach known as report by exception. For the same underlying data it moves less traffic, and it makes it far easier to consolidate many sites and many devices onto a single broker.
What matters most in practice is the direction the firewall has to open. With a broker, the device side only needs a one-way outbound connection to the broker, so the plant firewall never has to accept inbound connections from outside. Compared with a request-response design in which an external client reaches into a server inside the plant, there are fewer holes and simpler rules. The moment a requirement appears to view several sites from head office, that difference becomes an operational burden you can measure.
The selection rule follows directly. It depends on which side of the boundary you are on. Inside the plant network, between SCADA and control equipment, use OPC UA. For the path leaving the plant towards head office, cloud, or other sites, use MQTT Sparkplug B. That combination is the natural one, and architectures that use both are common. Forcing everything onto a single protocol and then straining at the boundary tends to cost more in operation later.
The OT security you must settle before allowing writes
IEC 62443, the security standard for industrial control systems, was written for IACS, meaning industrial automation and control systems such as SCADA, DCS, and PLCs. The reason IT security standards cannot simply be carried across is that OT starts from different premises. Availability comes first, legacy equipment is still in active service, and there are long stretches during which patching is impossible. The standard is built around the question of how to defend a world in which applying the latest patch is not an available move.
At its centre sits the concept of zones and conduits. Assets with similar risk characteristics are grouped into a zone, and traffic between zones is restricted to conduits, which are narrowly defined pathways. Of all the measures available to stop lateral movement from the IT network, this separation is the most effective. Even where a device cannot be patched, restricting the routes that can reach it lowers the risk substantially.
Installing SCADA creates routes that did not exist beforehand. There are three of them in particular. The first is remote maintenance, the path by which a vendor connects from Japan or from outside Thailand to fix screens or logic. The second is USB, the physical path used to move engineering tools and backups. The third is the engineering workstation itself, the laptop that can rewrite PLC programs. All three remain no matter how robustly the SCADA platform itself is built.
On the cost side, these countermeasures correspond to the 540,000 for network zoning and the 380,000 for safety review and permission design, a combined 920,000. That is roughly a quarter of the 3,800,000 added between Type 2 and Type 3. Cut that money and you change what Type 3 is, because you are installing a system that can write without installing the means to control writing. The physical network design behind this, in particular architectures that include wireless segments, is covered in detail in our article on factory wireless LAN and industrial network design. Zone boundaries cannot be separated from wireless segment design, so the two are best decided together.
Where to put the edge

Edge processing is now a baseline assumption in smart factory design, because handling data close to where it is generated reduces both latency and dependence on the network link. Yet many projects proceed with only a vague idea of what stays at the edge and what goes upstream.
There is one criterion. Decisions measured in seconds close on the floor. Only aggregations measured in minutes or longer go upstream. Alarm evaluation, threshold monitoring, and anything touching interlocks must not make a round trip to the cloud. The problem is not the latency of the round trip so much as what happens when the link drops halfway through it. Conversely, daily utilisation, monthly downtime analysis by machine, and cross-site comparison have no reason to live on the floor.
What matters most at a site in Thailand is an architecture in which the equipment keeps running when the link goes down. Industrial estate connectivity is generally stable, but outages from lightning in the rainy season or from construction work do happen. Give the edge a buffer and several hours of blocked upstream transmission cost you nothing, because the backlog catches up once the link returns. Without that buffer, the data for the outage window is simply gone and that day’s utilisation cannot be calculated.
The six edge gateways at 65,000 each, totalling 390,000, that appear in Type 1 of the model assume 30 machines grouped five to a gateway. Raising the number of machines per gateway reduces the unit count but widens the blast radius of a single failure. In practice this grouping should follow the line boundaries and the maintenance team’s areas of responsibility. Consolidating onto two gateways because it is cheaper can mean that one failure blinds all three main lines at once.
What is different about doing this in Thailand
Everything so far holds as general practice. Several points, however, differ from Japan when the work is done in Thailand.
Start with the investment climate. According to the Thailand Board of Investment, applications in the first half of 2026 reached 1,299 projects worth 1.473 trillion baht, a 37% increase year on year, with digital industries accounting for 1.115 trillion baht. Machinery, automation, and robotics accounted for 82 projects worth 13.093 billion baht, while smart and sustainable measures numbered 132, worth 17.158 billion baht. The roughly 1,300 approved projects are expected to create more than 82,000 jobs for Thai nationals.
What that tells you is that automation investment is clearly rising, and that most of it is going into equipment. Robots and machine tools are easy to get approved individually and their effect is easy to explain. The platform that ties them together, SCADA and MES, tends to be treated as something to think about once the machines are in, and so it gets deferred. The result is a plant full of new equipment whose utilisation is still tallied on paper daily reports. There are genuinely situations where tying together the 30 machines you already have, as in the model, returns more than adding another 10.
Next is people. Thai plants tend to leave maintenance and engineering to the vendor. If adding one SCADA screen or changing one threshold means calling the vendor every time, every change carries a wait, and eventually nobody bothers to request changes at all. The screens drift out of line with reality and the floor goes back to the whiteboard. This is not a technology problem. It is a design problem caused by never deciding at contract time who edits the screens.
Language is another local issue. Operator screens are in Thai, maintenance and production engineering work in English or Thai, and Japanese managers and head office read Japanese. The same applies to written procedures. Unless the screens are designed on the assumption that three languages will be maintained, you end up with terminology that has drifted in one language only. The effective rule is to build a glossary first and to allow screen labels to be drawn only from the glossary. Unifying terminology takes more effort than the translation itself.
Finally, the indicators head office wants to see and the screens the floor uses are different products. Head office wants monthly overall equipment effectiveness and comparison between sites, and daily refresh is plenty. The floor uses the alarms of this instant and the next changeover, and needs refresh in seconds. Trying to satisfy both on one screen produces something neither can use. Share the data source, separate the screens. That is the straightforward conclusion.
Seven things to settle before comparing quotations
Decide the following seven points internally before you go out for quotations. Without them, each vendor will quote against different assumptions and the prices will not be comparable.
1. The scope of write access. Which parameters on which machines may be changed from a screen. Not every parameter on every machine, but a concrete list. This has the largest effect on price.
2. How tags are counted. SCADA licensing is usually driven by tag count, and the model assumes 2,000 tags at 850,000. But the definition of a tag varies by product. Does one physical I/O point count as one, are calculated values included, or are only historised points counted. Unless every vendor quotes against the same definition, comparison is meaningless.
3. The number of screens and who edits them. The model assumes 35 screens, but more important than the count is who owns changes after go-live. Does the contract let you edit in house, or must the vendor do it, and if so at what unit price.
4. The redundancy level and the recovery time objective. Two servers or not, which failures trigger an automatic switchover, and how many minutes that switchover takes. Fix the recovery time objective first and the redundancy level follows automatically.
5. How zones are divided and which routes exist. Where the IT and OT boundary sits and through which route remote maintenance enters. Decide this late and you will be rebuilding the network after go-live.
6. Log retention period and ownership. What is retained for how many years. Is it a quality record or merely an operating log. Retention drives storage cost directly. Ownership here means who decides whether that data may leave the company.
7. The unit price and response time for post-go-live change requests. SCADA is not finished at handover. When the line changes, the screens change. Whether the per-request price and the time from request to start are written into the contract determines how the system is used three years later.
Frequently asked questions
What is SCADA?
It is a system for supervisory control and data acquisition. Beyond collecting and displaying equipment state, the centre of the definition is the ability to write values back to the equipment and operate it. Having screens is not the qualifying condition. Being able to write back is.
What is the difference between SCADA and MES?
They differ in time axis and subject. SCADA handles the present state of equipment in seconds. MES handles production records at the level of orders. In ISA-95 terms, SCADA is Level 2 and MES is Level 3. In money terms, the model puts the SCADA class at a five-year total of 8,700,000 and the SCADA plus MES class at 15,500,000.
How is this different from a data logger or a visualisation tool?
Read-only versus write-capable. The data logger and visualisation classes only read from equipment and never act on it. The SCADA class can write. Crossing that boundary adds 3,800,000 of initial cost in the model, of which the SCADA licence is only 850,000. The remaining 2,950,000, or 78%, is the cost of permitting writes safely.
How much does SCADA cost?
It varies widely with scale and requirements, so there is no single answer, but for the 30-machine model plant the estimate is 5,500,000 initial, 640,000 annually, and 8,700,000 over five years. This is a TOMAS TECH model, not published statistics. When reading your own quotation, look past the total and ask what sits inside it besides the licence.
Should I choose OPC UA or MQTT?
Neither is simply correct. The natural split is OPC UA inside the plant network and MQTT Sparkplug B for the path leaving the plant for upper layers. Because the broker approach needs only a one-way outbound connection from the device side, several sites can be consolidated without opening inbound holes in the firewall.
Can SCADA run on a mixed base of older PLCs?
Yes. The model plant itself assumes a mix of Mitsubishi, Omron, and Siemens, and budgets 30 machines at 12,000 each, or 360,000, for PLC connection and tag definition. Machines that need protocol conversion, or that have no communication port at all, will require external sensors or signal tapping. That work is covered concretely in our article on IoT retrofit for legacy equipment. In practice the mix itself is less troublesome than the mismatched response speeds of equipment from different generations.
What is different about installing SCADA in Thailand compared with Japan?
Three things. Screens and procedures must be maintained in three languages. Leaving maintenance changes to the vendor lets the screens drift away from reality. And the design must assume link outages and hold data at the edge. Capital investment itself is active, as the Board of Investment figures show, but the platform that ties equipment together tends to be deferred.
Summary
What separates SCADA from a data logger is not how attractive the screens are. It is whether the system can write to the equipment. What separates SCADA from MES is the time axis, the second-by-second present of a machine versus the order-by-order record of production. At the moment you cross either boundary, cost rises not as an increment of features but as an increment of responsibility.
In the model plant, moving from the visualisation class at a five-year total of 3,450,000 to the SCADA class at 8,700,000 multiplies the five-year total by about 2.5, yet of the 3,800,000 added, the SCADA licence is only 850,000. The remaining 2,950,000, which is 78%, is screens, redundancy, network zoning, safety review, and verification. In other words, it is the cost of being permitted to write to the equipment in your factory.
So the question to work on is not whether to install SCADA. It is whether this plant needs to write to its equipment, and if it does, who owns that responsibility. A plant that does not need to write and buys SCADA pays that 78% and never uses it. A plant that does need to write and stops at the visualisation class never sees its largest benefit, the 1,008,000 from reduced changeover waiting. And the step from Type 3 to Type 4 is not a decision to add features. It is a decision to add 700,000 of five-year net in exchange for pushing payback out by six months.
TOMAS TECH is happy to discuss nothing more than where to draw the line on write access, if that is the stage you are at. There is no need to be ready for quotations, and it is perfectly reasonable to start from the question of whether your plant needs write access at all. Given your existing PLC configuration and how the lines actually run, we can usually indicate on the spot which of the four classes is the realistic landing point. Get in touch through our contact form.
References
- Nation Thailand, “BOI says first-half investment tops B1.47tn as digital and data centre projects pour into Thailand”, 23 July 2026
https://www.nationthailand.com/business/economy/40068948
First-half 2026 applications reached 1,299 projects worth 1.473 trillion baht, up 37% year on year, with digital industries at 1.115 trillion baht, machinery, automation and robotics at 82 projects worth 13.093 billion baht, and 132 smart and sustainable measures worth 17.158 billion baht. The roughly 1,300 approved projects are expected to create more than 82,000 jobs for Thai nationals. Cited here to establish the scale of automation investment in Thailand.
- HiveMQ, “A Comparison of OPC UA and MQTT Sparkplug”
https://www.hivemq.com/resources/iiot-protocols-opc-ua-mqtt-sparkplug-comparison/
Referenced for the characterisation of OPC UA as a client-server polling model and Sparkplug B as broker-mediated publish-subscribe that transmits only on change, and for the point that the broker approach needs only a one-way outbound connection from the device side, which simplifies firewall configuration.
- Fortinet, “IEC 62443 Standard”
https://www.fortinet.com/resources/cyberglossary/iec-62443
Referenced for the point that IEC 62443 is a family of industrial control standards targeting IACS, namely SCADA, DCS and PLCs, and that it is built around OT premises such as availability first, the presence of legacy equipment, and constraints on patching.
- PLC Programming, “ISA-95 Explained — Levels, Models & MES Integration”
https://plcprogramming.io/blog/isa-95-explained
Referenced for the ISA-95 level definitions, in which SCADA sits at Level 2 supervising PLCs and raising alarms, while MES sits at Level 3 handling scheduling, work instructions and production data collection.
- MachineCDN, “ISA-95 and IIoT Integration — Bridging IT and OT in Modern Manufacturing”
https://www.machinecdn.com/blog/isa-95-iiot-integration/
Referenced for the observation that information has traditionally flowed through point-to-point integrations between MES and ERP, MES and SCADA, and SCADA and the historian, and that ISA-95 defines boundaries of ownership rather than dictating product selection.
- Avassa, “Edge Computing in Manufacturing — 2026 Smart Factory Guide”
https://avassa.io/articles/smart-factories-edge-computing-manufacturing/
Referenced for the point that edge processing is now a baseline assumption for smart factories, that processing at the source reduces latency and dependence on the network link, and that OPC UA, MQTT and ISA-95 carry the connection to existing industrial infrastructure.


