


Excess inventory reduction should not start with disposal
At the back of the warehouse there are pallets that have not moved for years. At every stocktake they are counted, the quantity is recorded, and they are put back where they were. Everyone says “we might use it someday,” and no one decides to dispose of it. At Japanese-affiliated factories in Thailand that have been asked by their parent company to reduce excess inventory, this is not an unusual sight.
As the fiscal year end approaches, Accounting asks, “Should we book a write-down on this inventory?” Production control answers, “If we can throw it away, we want to.” Purchasing then replies, “These are raw materials imported duty-free under BOI, so we cannot just throw them away.” On top of that came the floods of late September 2026, and the factory suddenly also had to decide how to handle raw materials and products that had been under water.
This article is a practical guide for plant managers and staff in production control, purchasing, the warehouse and accounting at Japanese-affiliated automotive parts, electronic components, plastic molding, metal processing and food factories in Ayutthaya, Chonburi, Rayong and the Bangkok area. It sets out how to measure the excess inventory you already have, in what order to reduce it, how to dispose of it and what your system should hold.
First, here is a summary of the argument of this article.
If you start excess inventory reduction with disposal, only the numbers improve, and the inventory piles up again.
Disposal (write-downs and destruction) improves days inventory outstanding in one go. However, very little cash comes back from disposal. And if the sources that created the excess inventory (order lots and MOQ, swings in customer forecasts, obsolescence due to design changes) remain, the same amount will pile up again the following year.
That is why the sequence has 4 stages:
- (1) Define and measure: separate excess inventory, slow-moving inventory and non-moving inventory, classify them by inventory age (aging) based on the receipt date and by the last issue date, and assign an owner to each item
- (2) Stop the sources: review ordering rules, lots and the exit plan for items that become obsolete due to design changes
- (3) Dispose of inventory by the book: proceed with the accounting write-down, the tax destruction procedure, BOI approval and balance adjustment for duty-free raw materials, and Free Zone permission, each according to its own procedure
- (4) Build it into the system: have the ERP or inventory management system hold the disposal register and the aging
There is one more important point. The cash that comes back only once when you reduce inventory and the reduction in holding cost that continues every year need to be counted as separate things. The model calculation in the second half shows this difference with figures.
Note that this article does not recommend specific products or rank them. Product functions are introduced as described in each vendor’s official documentation (that is, as vendor claims). This article is also not legal, tax or accounting advice. Accounting standards, Revenue Department orders and BOI and IEAT announcements are only introduced in the sense of “this is what it sets out” or “this is how the material explains it.” Be sure to check how your own company should handle these matters with your accounting auditor, tax advisor, BOI and IEAT. The inventory amounts, costs, hours and effects in the calculation are all hypothetical figures created for this article.
Why factories in Thailand should revisit excess inventory now
Orders are strong, but business sentiment remains weak
The latest figures for Thai manufacturing do not point in the same direction.
According to Trading Economics, the S&P Global Thailand Manufacturing PMI was 54.3 in September 2026 (53.8 in August), the highest level since December 2025. It was reported that output expanded at the fastest pace in 9 months and new orders grew at the strongest rate in 6 months.
On the other hand, the Bank of Thailand (BOT) Business Sentiment Index (BSI) was 48.1 in September 2026 (49.8 in August), below 50 for the 9th consecutive month. According to the same report, sentiment in the automotive industry worsened, and automotive parts makers in particular said that “the increase in EV imports reduced demand for domestically produced parts.”
The PMI and the BSI are indicators with different survey bodies and different scopes. It is not a question of which one is right. What can be read from them, however, is that while some companies feel strong orders, many companies continue to feel weak sentiment.
Demand is moving in different directions by industry
According to The Nation, Thai exports rose 24.3% year on year in August 2026, driven mainly by growth in electronics on the back of AI-related demand. On the other hand, it was reported that exports of “automobiles and parts,” “machinery and parts” and “motorcycles and parts” declined in the same month.
As for automobile production, according to a Reuters report, production in August 2026 was 124,646 units, up 10.9% year on year. However, while domestic sales rose 25.59%, exports fell 2.04%. The Federation of Thai Industries (FTI) forecasts a 3.33% decline in automobile production for the full year 2026, citing the drop in exports due to the situation in the Middle East.
When the direction of demand splits by industry and by month, whatever is misread remains as inventory. At electronic components factories, materials ordered in larger quantities for sudden production increases tend to stay in the warehouse, and at automotive parts factories, parts and materials left over after customer forecasts were cut tend to stay there.
Even large North American companies built up inventory to prepare for tariffs
Inventory piling up is not only a Thai issue. According to a study released by The Hackett Group on October 5, 2026 (1,000 large non-financial companies in North America, results for fiscal year 2025), days inventory outstanding (DIO) worsened by 0.6 days, and the inventory improvement opportunity rose 6% from the previous year to USD 616 billion. The reason given was that companies kept holding buffer inventory to prepare for tariff risk, supply chain uncertainty and the diversification of sourcing.
However, this study covers only large companies in North America. It cannot be used as a benchmark for factories in Thailand or ASEAN, or for mid-sized factories. In addition, primary surveys of excess inventory ratios or of days inventory outstanding by industry limited to manufacturing in Thailand or ASEAN could not be found in our research for this article.
The floods of late September added the handling of flood-damaged inventory
Floods hit in late September 2026. According to a Reuters report, Bangkok received 320 mm of rain (a normal month’s worth for September) over 3 days in late September and was designated a disaster area. Toyota temporarily suspended 4 plants because parts deliveries were disrupted.
According to The Nation, the FTI provisionally put the direct losses to manufacturing at about 1.018 billion baht (USD 30.4 million). At the Amata City Chonburi industrial estate, a levee broke and at least 34 factories were damaged. A weekly report by Krungsri Research (early October 2026) estimated the production losses and business disruption caused by the floods at 17 billion to 39 billion baht.
The figures listed here all have different scopes and definitions. They cannot be added together or applied to your own company. What this article wants to say is this: now that the direction of demand has split, inventory piles up easily and even the handling of flood-damaged inventory has been added, it is a good time to review the mechanism for “measuring, reducing and disposing of inventory by the book.”
Excess inventory vs. slow-moving inventory vs. non-moving inventory
Use the 3 terms separately
On the shop floor, “excess inventory,” “slow-moving inventory” and “non-moving inventory” tend to be used to mean almost the same thing. However, because the countermeasures differ, discussions go faster when they are used separately. This article uses them as follows. This is not a definition from a source but the way this article organizes the terms.
| Category | Meaning in this article | Main countermeasures |
|---|---|---|
| Excess inventory | The quantity that exceeds your own policy (target inventory or reorder point) | Stop ordering, reduce procurement, review lots |
| Slow-moving inventory | Inventory with little movement over a certain period | Reuse in-house, return to the supplier, discounted sales |
| Non-moving inventory | Inventory with no receipts and no issues at all over a certain period | Disposal decision (sale, donation, destruction, disposal via a licensed contractor) |
Excess inventory is a term about “quantity,” while slow-moving and non-moving inventory are terms about “time.” For example, even an item that is issued every day is excess inventory if you hold 3 times its target inventory. Conversely, even if the quantity is small, an item that has not moved at all for 1 year is non-moving inventory.
The basis for judging something as “excess” is the target inventory for that item. How to set the target inventory itself is organized in Optimal Inventory Level Management 2026 | The 5 Layers First. This article deals with the “exit” side, reducing and disposing of the amount that has exceeded that target.
Decide the day thresholds yourself
The number of days that separates slow-moving inventory from non-moving inventory is a threshold you decide yourself, for example “91 to 365 days is slow-moving and over 365 days is non-moving.” An industry standard number of days could not be confirmed in our research for this article.
When deciding the thresholds, consider the nature of the items. It is fine to change the thresholds by item group, for example shorter for food and chemicals with expiry dates and longer for maintenance parts that are used for a long time. What matters is to keep using the thresholds you have decided on the same basis every month. If you change the thresholds from month to month, you can no longer compare the trend.
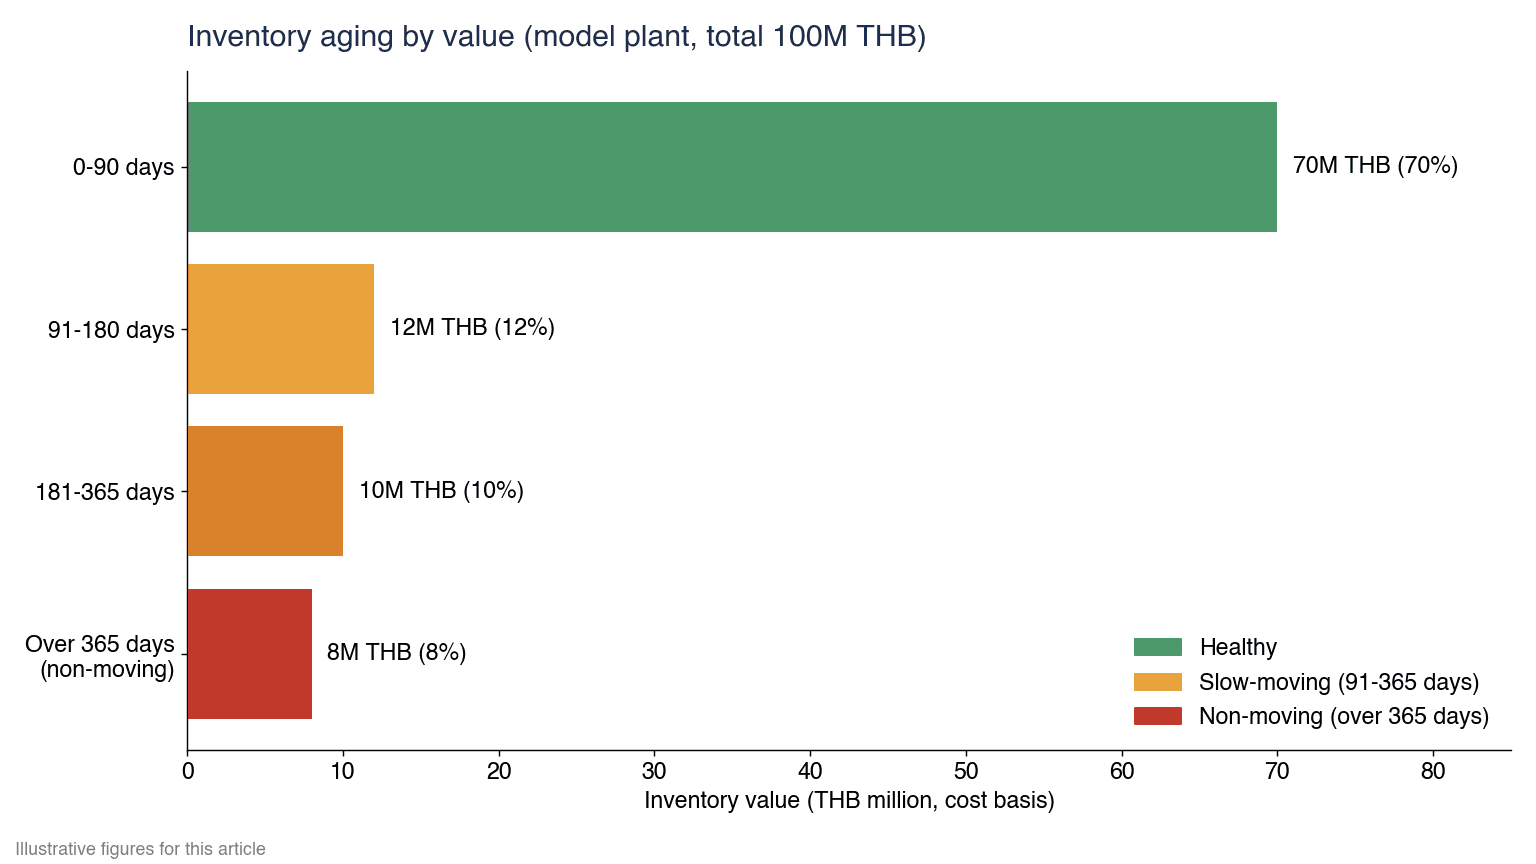
Figure 1 shows the inventory value of the hypothetical factory used in the model calculation in the second half, arranged by inventory age bracket. 0 to 90 days is 70,000,000 THB, 91 to 180 days is 12,000,000 THB, 181 to 365 days is 10,000,000 THB and non-moving inventory over 365 days is 8,000,000 THB, for a total of 100,000,000 THB (all hypothetical figures).
Inventory turnover and days inventory outstanding: the indicators to measure first
Days inventory outstanding (DIO) and inventory turnover
The first indicators to align when moving forward with excess inventory reduction are days inventory outstanding and inventory turnover. In the explanation by the Corporate Finance Institute, days inventory outstanding (DIO) is calculated with the following formula.
- Days inventory outstanding (DIO) = (average inventory / cost of goods sold) x number of days in the period
- Average inventory = (beginning inventory + ending inventory) / 2
Inventory turnover is calculated as cost of goods sold / average inventory. DIO gives the same value as 365 / inventory turnover.
According to the same explanation, a high DIO indicates the possibility of weak sales or excessive purchasing, worsens cash flow and increases the risk of obsolescence. It also states that DIO varies greatly by industry, so comparing across industries is not appropriate. Compare your own figures not with other companies’ averages but with your own past trend and with the targets for each item group.
At the hypothetical factory used in the calculation in the second half, annual cost of goods sold is 400,000,000 THB and average inventory is 100,000,000 THB. In this case, DIO is 100,000,000 / 400,000,000 x 365 ≈ about 91 days (91.25 days), and inventory turnover is 4.0 times.
Look at GMROI (gross margin return on inventory investment) as a ratio
Another indicator is GMROI (gross margin return on inventory investment). In Fathom’s explanation, GMROI is calculated as “annualized gross margin / average inventory cost,” and a value above 1 shows that the gross margin per unit of cost invested in inventory exceeds the inventory cost. In the example in the same explanation, gross margin of USD 30,000 / average inventory cost of USD 20,500 = about 1.46.
However, GMROI is an indicator that originally has been used in retail. A benchmark value for manufacturing could not be found in our research for this article. If you use it in manufacturing, it is suited to comparing ratios by item group within your own company and finding “item groups with a lot of inventory but small gross margin.”
How to use the 4 indicators
| Indicator | Calculation | What it shows | Caution |
|---|---|---|---|
| Days inventory outstanding (DIO) | Average inventory / cost of goods sold x days | How many days of inventory there are | Do not compare across industries |
| Inventory turnover | Cost of goods sold / average inventory | How many times it turns over in a year | DIO = 365 / turnover |
| Inventory age (aging) | Bracketed by days elapsed since the receipt date or the last issue date | Which inventory is old | Decide the day thresholds yourself |
| GMROI | Annualized gross margin / average inventory cost | How much gross margin the inventory generates | An indicator that originated in retail. Compare as a ratio within your own company |
DIO and inventory turnover tell you “the overall quantity,” inventory age tells you “where it is old,” and GMROI tells you “where inventory is not earning.” If you set a target for inventory turnover improvement, we recommend tracking not only overall DIO but also the value in each inventory age bracket.
How to build an aging table
2 views: the receipt date basis and the movement basis
There are broadly 2 ways to look at inventory age (aging).
The first is the view based on the receipt date. It brackets inventory by how many days have passed since it was received. According to Microsoft’s official documentation, the aging report in Dynamics 365 Business Central ages the quantity and value of inventory on hand by receipt date (posting date) and classifies it into periods of equal length.
The second is the view based on movement (receipts and issues). It judges by the days elapsed since the last issue date or by the quantity received and issued over a certain period. According to SAP Help (S/4HANA 1610), SAP’s lowest value determination based on movement rate calculates the movement rate as “total quantity of receipts or issues / stock quantity x 100” and treats items below a preset threshold as slow-moving or non-moving.
If you look only at the receipt date basis, an item that is issued a little every day but still has an old lot remaining is judged as “old.” If you look only at the movement basis, you can easily miss an item that was recently received in bulk and has not been issued at all since then. In practice, it is sensible to give the aging table columns for both the inventory age based on receipt date and the last issue date.
Columns to give the aging table
Build the aging table at the level of item x lot x location. With columns like the following, you can use it as is in the monthly review.
| Column | Content | Use |
|---|---|---|
| Item code, item name, item group | Item identification | Totals by item group |
| Lot, receipt date | Inventory age based on receipt date | Judging the bracket (0 to 90 days and so on) |
| Last issue date, issue quantity over the past 12 months | Movement basis | Judging slow-moving or non-moving |
| Location | Warehouse, shelf, external warehouse, Free Zone, bonded warehouse | Separating storage cost and procedures |
| Quantity, unit cost, value (cost) | Inventory value | Sorting in descending order of value |
| Cause | Order lot, forecast swing, design change, quality hold and so on | Countermeasures at the source |
| Owner | Owner for each item | Making clear who “decides” on disposal |
| BOI duty-free category | Whether it is a duty-free raw material under BOI Section 36(1) | Branching of the disposal procedure |
| Disposal status | Not yet judged, on hold, disposal application in progress, disposed | Progress management |
There are 2 key points.
The first is to sort in descending order of value. At factories with many items, you cannot look at every item with the same intensity. Starting from the top by value, decide the owner and the next action.
The second is to never leave the owner column blank. The state in which “no one decides to dispose of it” often arises because no one has been assigned to decide. If you decide the owner from the cause, for example Purchasing for raw materials it procured, production control and design for parts that became obsolete due to a design change, and Sales for products left over from swings in customer forecasts, discussions move forward more easily.
Correct the books first, then build the aging
The aging table assumes that book inventory matches physical inventory. If inventory that exists in the books but not physically is put forward for a disposal decision as “non-moving inventory,” the quantities will stop matching partway through the procedure. Correct the differences between the books and physical inventory before making disposal decisions. The causes of and countermeasures for differences between book and physical inventory are explained in Inventory Discrepancy: Causes and Solutions for Thai Factories.
5 sources of excess inventory
When thinking about how to reduce inventory in manufacturing, you need to look at “why it piled up” before disposal. As a general matter, the sources of excess inventory can be divided into the following 5.
Source 1: order lots and MOQ
If the supplier’s minimum order quantity (MOQ) or your own order lot is too large compared with actual usage, an amount that cannot be used up remains after every order. As a result of buying in large lots to lower the unit price, you may lose more than the unit price difference through the storage cost of the leftover amount and the loss on the amount that finally becomes obsolete.
Source 2: swings in customer forecasts and demand forecasts
When customer forecasts drop or your own forecast is wrong, materials already procured and partly made products remain. The mechanism for realigning forecast and plan swings every month is covered in S&OP Implementation for Thai Factories: PSI Planning, Monthly Cycle and RFP.
In a small survey by Talking Logistics of 24 supply chain and logistics executives (conducted in December 2025, manufacturing, retail and distribution, region not stated), half of the respondents named “poor forecasting and planning” as the main cause of excess inventory. However, because it is a small survey of 24 people, keep it as a reference for the tendency only and do not use it as a benchmark for levels.
Source 3: design changes and obsolescence (EOL)
When there is a design change or a product reaches end of life (EOL), old-specification parts and raw materials all become unusable at once. If production ends without deciding the quantity of the last procurement, old-specification parts remain in the warehouse and become non-moving inventory as they are.
Source 4: quality holds and returns left untouched
Items put on hold because of quality problems and items returned by customers may stay in the warehouse waiting for a decision. If no deadline is set for holds, years can pass while they are still “awaiting a decision.”
Source 5: importing up to the full BOI maximum stock (Max Stock) allowance
BOI duty-free raw materials have a maximum stock (Max Stock) allowance. A seminar presentation by the BOI Chiang Mai office (June 2023) explains that Max Stock is calculated from the formula within a range “not exceeding 4 months of production capacity.” If you import up to the full allowance just because the allowance exists, the amount that could not be used up remains as duty-free raw materials, and a BOI procedure is required when disposing of it. The operation of Max Stock and RMTS write-offs is covered in detail in BOI Raw Material Inventory in Thailand – RMTS Write-Off and Max Stock by Design.
Master data to look at for each source
Sources 1 and 2 can also arise because the master data used to calculate procurement (lead times, lots, safety stock and so on) is out of date. Managing the freshness of master data is organized in MRP System 2026: What Stops It Is Master Data Freshness, Not the Engine. In addition, when the issuing order is not followed and old lots remain at the back, this also causes expiry and obsolescence. For issuing rules, see FIFO Inventory Management System 2026: Thailand Guide.
Countermeasures that stop the sources
Review reorder points and target inventory
The first thing to review is reorder points and target inventory. If items with large values line up in the slow-moving band (91 to 365 days in this article) in the aging table, the reorder point or target inventory for those items may be too large compared with actual usage. Recalculate the target inventory from actual issues over the past 12 months.
Negotiate MOQ and order lots
If the supplier’s MOQ or order lot is too large, consider negotiating smaller lots or deliveries split into several shipments. Even if the unit price goes up a little, when you compare including the storage cost of the leftover amount and the final loss, smaller lots can be cheaper in total.
Create an EOL exit plan
Once a design change or end of production is decided, create an “exit plan” at that point.
- Last procurement: decide the quantity of the last procurement of old-specification parts and raw materials from the remaining production volume
- Use-up plan: decide in which products’ production and by when the inventory on hand will be used up
- Handling of what remains: decide before the end of production whether to return it to the supplier, reuse it for other products or dispose of it
If production ends without an exit plan, old-specification inventory stays as “we might use it someday” and becomes non-moving inventory.
Set a deadline rule for items on quality hold
Set a decision deadline for items on quality hold and for returns. For example, decide the deadline and the person who decides, such as “within 30 days from the hold, decide whether to rework, return or dispose.” Make items past the deadline come up automatically on the agenda of the monthly review.
Be careful not to cut too much
If you cut inventory too much, stockouts increase instead. When lowering target inventory, look at the demand variability and lead time of each item and secure safety stock. Safety stock and reorder point calculations are explained in AI Inventory Optimization | Safety Stock and Reorder Points, and mechanisms to prevent stockouts in Stockout Prevention System 2026: Five-Layer Factory Design.
Dead stock disposal: options and order
Arrange by recovery amount and procedural burden
Once countermeasures at the source have started, move ahead with disposing of the non-moving inventory you already have. The basic approach is to consider the disposal options starting with those where the recoverable amount is large and the procedure is light.
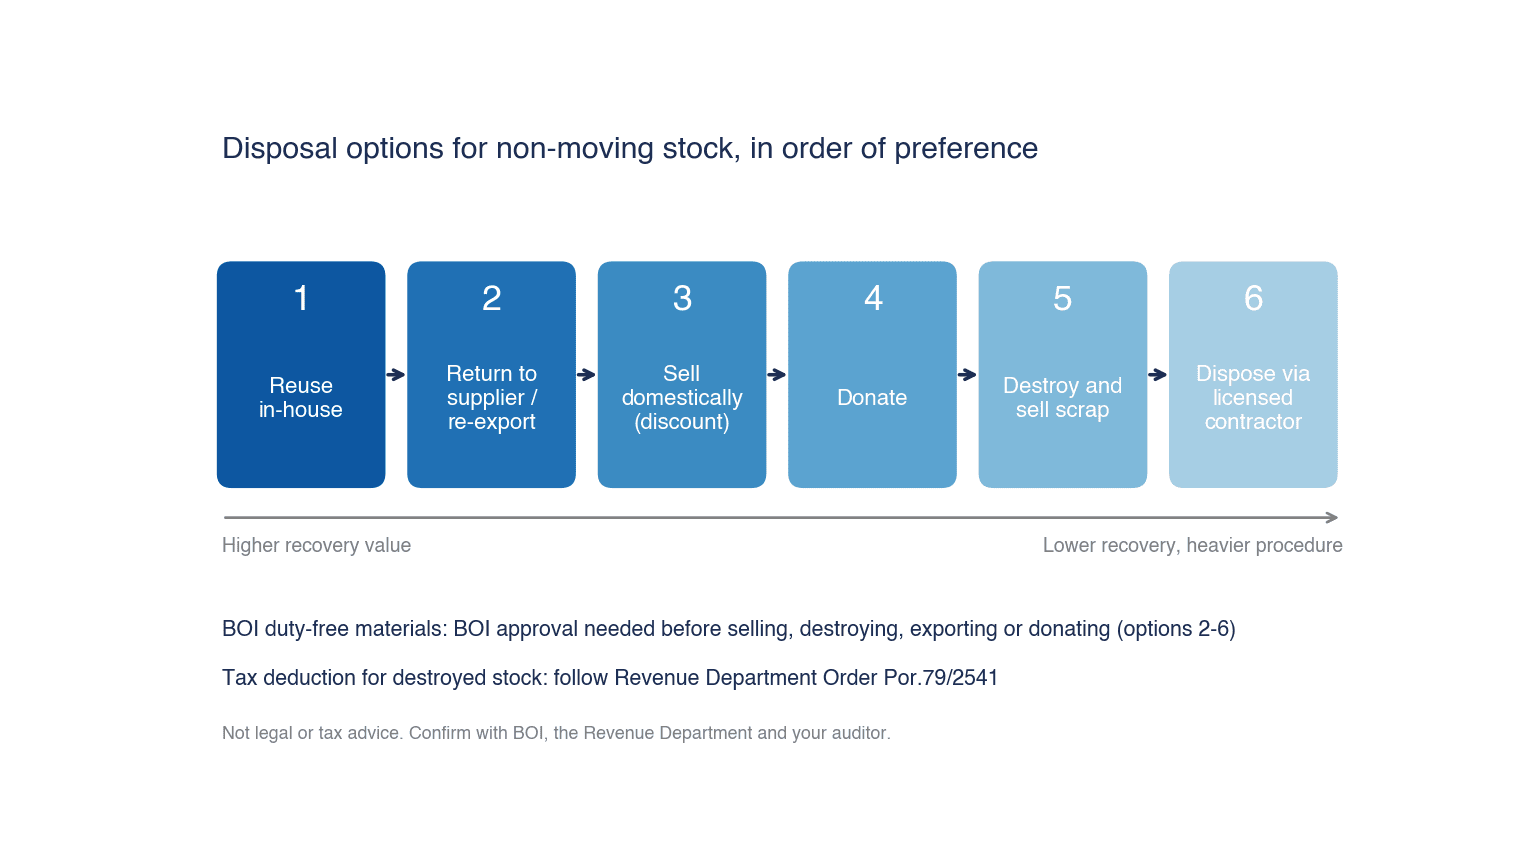
Figure 2 arranges, from left to right, the order in which disposal options are considered.
| Order | Option | Recovery amount | Procedural burden | Caution |
|---|---|---|---|---|
| 1 | Reuse in-house | Large (the value of the cost can be used) | Light | Check whether it can be used for other products or at other sites |
| 2 | Return to the supplier, send back overseas | Medium to large | Medium | Negotiation with the supplier. Sending BOI raw materials back overseas requires prior permission |
| 3 | Sell domestically (at a discount) | Medium | Medium | BOI raw materials may require tax payment |
| 4 | Donate | None | Medium | For BOI raw materials, there are conditions on the recipient |
| 5 | Destroy and sell the scrap | Small | Heavy | Tax destruction procedure; for BOI raw materials, BOI approval |
| 6 | Dispose via a licensed contractor | None (costs are incurred) | Heavy | Keep proof of completed disposal |
For BOI duty-free raw materials, the procedure changes with every option
What needs attention here is that, for duty-free raw materials under BOI Section 36(1), options 2 to 6 in the table above (sending back, sale, donation, destruction, disposal via a licensed contractor) require BOI approval and balance adjustment, and in some cases tax payment. According to BOI materials, sale, destruction, export and donation all require prior BOI approval. Check the handling of duty-free raw materials with BOI, including reuse in-house. This is explained in detail later in the chapter “BOI raw material scrap and disposal of surplus (Por.5/2543).”
A procedure is required for a tax deduction
The other point to note is tax. It has been explained that, to make the cost of destroying obsolete inventory deductible for corporate income tax, you need to follow the procedure in a Revenue Department order. If you throw items away without following the procedure, they may not be deductible. This is also explained in a later chapter.
How to think about the inventory write-down (NRV)
The lower of cost and net realizable value (NRV)
From here, the procedures related to disposal under accounting, tax, BOI and the Free Zone are introduced in turn. To repeat, this is not legal, tax or accounting advice. Check how your own company should handle these matters with your accounting auditor and tax advisor.
According to the IFRS Foundation’s summary of the standard, IAS 2 (Inventories) measures inventories at “the lower of cost and net realizable value (NRV).” Net realizable value (NRV) is “the estimated selling price in the ordinary course of business less the estimated costs of completion and the estimated costs necessary to make the sale.” The amount of any write-down of inventories to NRV and all losses of inventories are recognized as an expense in the period the write-down or loss occurs.
In other words, inventory whose expected selling price has dropped, or whose costs to sell have increased, needs to have its book value lowered.
An example under the Thai standard for non-publicly accountable entities
Under the Thai accounting standard for non-publicly accountable entities (TFRS for NPAEs) as well, inventories are written down to the lower of cost and NRV. The Forvis Mazars explanation includes the following example.
| Item | Amount (baht) |
|---|---|
| Cost | 50,000 |
| Estimated selling price | 68,000 |
| Estimated cost to complete | 25,000 |
| Estimated costs necessary to sell | 2,250 |
| NRV (68,000 – 25,000 – 2,250) | 40,750 |
| Write-down (50,000 – 40,750) | 9,250 |
In this example, even though the selling price exceeds the cost, NRV falls below cost once the costs to complete and sell are deducted. Therefore, a write-down of 9,250 baht is required.
Note that TFRS for NPAEs was revised in 2022 and applies to accounting periods beginning on or after January 1, 2023 (according to Forvis Mazars). The article explaining the example above is from 2014. For the detailed treatment of write-downs (such as the treatment of raw materials and the treatment when value recovers after a write-down), check the provisions of the revised standard with your accounting auditor. TFRS and TAS, used by listed companies and others, were revised based on translations of IFRS (2023 edition) and apply to accounting periods beginning on or after January 1, 2024.
Even after a write-down, the inventory stays in the warehouse
What should be understood here is that even if you book a write-down, the inventory itself stays in the warehouse. The book value goes down, but the storage space and the stocktake workload remain. And, as explained in the next chapter, it has been explained that booking a write-down alone does not make it deductible for tax purposes. Do not think that “we booked a write-down, so disposal is done.”
Tax: the gap between write-downs and deductions, and the destruction procedure (Por.79/2541)
What the Revenue Code sets out
This chapter is not legal or tax advice either. Check how your own company should handle these matters with your tax advisor.
According to the English translation of the Revenue Code by the Thai Revenue Department, Section 65 bis (6) sets out that “the value of inventory on the last day of the accounting period shall be computed at cost or market price, whichever is lower.” Once a method for computing cost has been adopted, it cannot be changed without the approval of the Director-General. On the other hand, Section 65 ter (1) sets out that reserves are not deductible (with exceptions for insurance and financial institutions).
Reserves are not deductible, and destruction is deductible if the procedure is followed
According to Forvis Mazars’ explanation (July 2022), reserves for obsolete inventory are not deductible for corporate income tax under Section 65 ter (1). The cost of obsolete inventory is said to be deductible “only if it is sold or destroyed in accordance with the rules, procedures and conditions of Revenue Department Order ป.79/2541 (November 3, 1998; hereafter written as Por.79/2541 in this article).” It is explained that destruction that does not follow this order cannot be deducted.
According to the same explanation, a Revenue Department ruling (KorKhor 0706/308, January 15, 2008) states that inventory destroyed in accordance with this order is not deemed a sale for VAT purposes. The same accounting firm also explains that lost inventory is treated as a deemed sale for VAT purposes.
In other words, the accounting write-down and the tax deduction can differ in timing. The general way to organize this is to think that even if a write-down is booked, the tax deduction comes once the destruction or sale procedure is complete. Check individual judgments with your tax advisor.
What Por.79/2541 contains
Por.79/2541 is a practical guideline on the destruction of spoilage, deteriorated goods, defective goods, out-of-fashion goods, expired goods and scrap (of which (3.2) was amended by Por.84/2542 and has applied since May 13, 1999).
Item 1 of the order defines the following terms.
- Normal spoilage: spoilage that arises in an efficient production process within the normal rate set for the process. Under Item 2, the cost of normal spoilage is included in the product cost of good products
- Abnormal spoilage: spoilage that arises in excess of the normal rate
- Scrap: residual material that arises from some manufacturing processes, is measurable and has a small recovery value
Item 3 sets out, by company category, the conditions for treating the cost of abnormal spoilage, deteriorated goods, defective goods, out-of-fashion goods, expired goods and scrap as a deductible expense in “the accounting period in which they are destroyed.”
| Category | Applies to | Main conditions set out by the order |
|---|---|---|
| (1) | Companies in an export processing zone (a zone within an IEAT industrial estate) | Follow the destruction method set by IEAT. Invite the auditor to witness the destruction, or prepare a destruction report and notify the auditor, and attach the auditor’s written certification to the balance sheet |
| (2) | BOI-promoted companies that import raw materials used in production for export, where the quantity is under BOI control | Destruction of raw materials follows the conditions set by BOI. As in (1), attach the auditor’s witnessing (or report) and written certification. Destruction of items other than raw materials follows (3) |
| (3.1) | Companies other than (1) and (2): items that by nature cannot be stored (food, pharmaceuticals, chemicals and so on) | Inspect the damage under conditions set by each company and obtain approval from the authorized person. After destruction is approved, at least the staff of the warehouse, accounting, and sales or internal audit (if any) witness and sign, and the auditor is invited as a witness. There is no need to ask for a Revenue Department officer to witness |
| (3.2) | Companies other than (1) and (2): items that by nature can be stored and can be destroyed together | Follow (3.1), and in addition notify the competent area revenue office or provincial revenue office at least 30 days before the destruction date. The revenue office may send an officer to witness. If destruction is carried out under the supervision of a government agency, there is no need to ask for a revenue office officer to witness |
(3.1) also sets out requirements on records. For returns, a return receipt is needed showing the date of receipt, quantity, item and item number, reason for return, original order number, and the signatures of the returning customer and the receiving employee. In addition, while items are stored awaiting destruction, the warehouse staff count and sign for them and notify accounting.
Points to note in practice
The points to note in practice from this order are as follows.
- When destroying storable items together, you need to notify the revenue office at least 30 days before the destruction date, so set the destruction date 30 days or more after the notification date
- Secure the schedules of the witnesses (warehouse, accounting, sales or internal audit, auditor) first
- Keep records from before destruction, such as return receipts and signatures for quantities during storage
- For BOI duty-free raw materials, the BOI procedure in the next chapter is required in addition to the Revenue Department procedure
BOI raw material scrap and disposal of surplus (Por.5/2543)
“We cannot throw it away” because approval is required
This chapter is not legal or tax advice either. Check how your own company should handle these matters with BOI and your tax advisor.
Raw materials imported with import duty exempted under BOI Section 36(1) cannot be thrown away on your own company’s judgment alone just because they are surplus or damaged. Announcement of the Office of the Board of Investment Por.5/2543 (July 24, 2000) sets out the conditions and procedures for losses and scrap of raw materials under Section 36(1) (based on the unofficial English translation). Hereafter, this article writes it as “Por.5/2543.”
Definitions of loss and scrap
Por.5/2543 defines “loss” and “scrap” as follows.
- Loss: (3.1) raw materials that are defective, off-specification or unusable for their original purpose (before use, or left over from production), (3.2) processing losses, (3.3) defective or off-specification products and parts made from them
- Scrap: loss that has been destroyed to the point that it no longer retains its original form
Apply before disposal and adjust the balance after disposal
Item 5 of Por.5/2543 sets out the following regarding applications for balance adjustment.
- Apply to BOI for permission to sell, destroy, export or donate
- Submit a list of losses (type, quantity or weight, value, cause)
- Keep the losses and scrap for inspection by BOI and others
- Destruction is carried out by a method approved and controlled by BOI or a person designated by BOI, and scrap is disposed of in a way that does not cause environmental damage
- Donations are of a type that can be used in the recipient’s activities, and a receipt is obtained from the recipient
- Exports receive prior approval
After approval, once destruction, donation or export has been carried out, submit the details and evidence to BOI and adjust the balance (Item 6). The balance can be adjusted while remaining duty-free when the items are destroyed by an approved method, exported abroad, or donated to a government agency or an approved charity (Item 7).
The basis for tax payment when selling domestically
When selling or transferring domestically (Item 9), tax payment is required. The basis for tax payment differs by type of loss.
| Type of loss | Treatment when selling or transferring domestically (Item 9 of Por.5/2543) |
|---|---|
| Losses outside the formula (defective or off-specification raw materials and products) | Adjust the balance with evidence of tax paid at the duty rate, condition and price as of the import date |
| Losses within the formula (processing losses) | Adjusted with evidence of product exports. When selling or transferring, pay tax at the current duty rate based on their condition (the BOI seminar presentation explains that tax is paid in “the condition of scrap”) |
| Scrap with commercial value | Adjust with evidence of tax paid at the current duty rate based on the condition of the scrap |
Note that Item 11 of Por.5/2543 sets out that the conditions of the announcement are general and are treated as guidelines. Issues that cannot be decided are to be decided by the Secretary General (Item 12).
Current practice as explained in the BOI seminar presentation
The seminar presentation by the BOI Chiang Mai office (June 2023) explains current practice as follows.
- Losses outside the formula are disposed of by export abroad, by destruction and domestic sale of the scrap (if the scrap has commercial value, tax is paid in the condition of scrap before sale), or by donation
- The destruction flow is (1) apply for approval of the destruction method, (2) list the raw materials and quantities to be destroyed, (3) destroy by the approved method, (4) if there is commercial value, compile the types and quantities and tax them, (5) apply for balance adjustment and tax payment
- Inspection and certification are carried out by agent inspectors recognized by BOI
- If the scrap has commercial value, there is sales income and it is taxed in the condition of scrap. If it has no commercial value, there is neither sale nor taxation
- If the scrap after destruction is disposed of by a method set by the Ministry of Industry and a contractor licensed by the Ministry of Industry issues a certificate of completed disposal, it is deemed to have “no commercial value”
- Donation recipients are government agencies, charities and institutions recognized by BOI
- Sending raw materials back overseas requires permission before export, and if they are exported before permission, the balance cannot be adjusted
- Taking raw materials or products outside the business premises requires prior permission
The same presentation also describes surcharges and penalties when paying tax on raw materials not used for export. Because the amounts vary with individual circumstances, this article does not calculate them. Check them in the BOI materials and with your tax advisor.
Special measures for flood-damaged raw materials
In response to the floods of late September 2026, BOI announced support measures for promoted companies affected by the floods in a press release (168/2569, September 29, 2026). There are 3 measures:
- Exemption from import duty when importing machinery to replace damaged machinery
- Balance adjustment of damaged machinery and raw materials “without tax burden”
- Permission to increase production capacity in line with machinery purchased or replacement machinery
The conditions are that the business premises are in an area designated as a flood disaster zone and that the application is made, with evidence of the damage, within 6 months from the day the flood ended. “The day the flood ended” is the day on which the flood was deemed to have ended, for example in the disaster zone announcement. For details such as the scope of eligible raw materials and the required documents, check the BOI announcement referenced in the press release and contact BOI.
When handling flood-damaged inventory, it is important to keep evidence of the damage (photos, quantity records, the location affected) before disposal. Because there is a fixed deadline, check the schedule first so that the application deadline does not pass while you are waiting for a disposal decision.
Relationship with RMTS operation
What has been covered here is the disposal procedure for when duty-free raw materials are “surplus, damaged or unusable.” For day-to-day RMTS write-offs, Max Stock management and the operation of reconciling the books, see BOI Raw Material Inventory in Thailand – RMTS Write-Off and Max Stock by Design.
Disposing of inventory in an IEAT Free Zone or a bonded warehouse
Taking goods out of an IEAT Free Zone requires permission
This chapter is not legal advice either. Check how your own company should handle these matters with IEAT and customs.
A notification of the IEAT Board of Directors (notified on June 10, 2008, Royal Gazette June 30, 2008) sets out the rules, procedures and forms for permission to take goods out of an IEAT Free Zone. The purposes of taking goods out are divided into (1) export, (2) domestic use or sale, (3) transfer to an operator with tax privileges, (4) destruction, (5) other temporary purposes and (6) general purposes.
Taking goods out for the purpose of destruction is permitted case by case, only when the IEAT Governor or a person appointed by the Governor judges that “destruction outside the Free Zone is appropriate.” It must also not conflict with the rules, procedures and conditions set by the Director-General of Customs. Permission for export or domestic sale is valid within 2 calendar years, and a report is to be made to IEAT within the 15th of the following month.
Inventory in bonded warehouses
According to the Thai Customs “Tax Incentives Guidebook” (2021), the current customs law is B.E.2560 (2017). “Deteriorated, destroyed, damaged or lost goods” taken out of a bonded warehouse are processed with Declaration P, and violations are subject to penalties under the customs law. The storage period is 2 years from the import date for a bonded warehouse (a 1-year extension is possible), and within 2 years from the first storage date for a Duty Free Zone (extension is possible in accordance with customs rules).
Because inventory in a bonded warehouse or a Duty Free Zone has a storage period deadline, and taking goods out of a Free Zone also requires permission, it is important to hold “Free Zone” and “bonded” categories in the aging table so that inventory close to its deadline can be picked up early.
Where the scrap goes after destruction
If the scrap after destruction is disposed of by a licensed contractor by a method set by the Ministry of Industry, records are needed until disposal is completed. How to track the scrap from handover to the disposal contractor until disposal is completed is explained in Industrial Waste Management System 2026 | Tracking Waste to Final Disposal. This article covers the disposal decision and the records on the inventory side.
Systems needed for slow-moving inventory management: the disposal register and aging
Align 4 procedures in 1 disposal register
As we have seen, the disposal of non-moving inventory involves 4 procedures: accounting (write-down), tax (destruction procedure), BOI (approval and balance adjustment) and the Free Zone (IEAT permission). Each one differs in the records required, the schedule and the person who approves.
If these are managed separately in Excel files and paper documents, gaps such as “the write-down is done, but the destruction procedure is not yet” or “destruction is done, but the BOI balance adjustment is not yet” tend to occur. That is why the requirement for the system is to give the ERP or inventory management system a “disposal register” so that the status of the 4 procedures can be tracked in 1 register.
Requirements for the system
| Requirement | Content | Reason |
|---|---|---|
| Automatic calculation of aging brackets | Bracket by both inventory age based on receipt date and last issue date | Track the trend on the same basis every month |
| Owner by item | Hold an owner for each item or lot | Make clear who decides on disposal |
| Disposal status | Record each stage: application, approval, execution, evidence | Track the progress of procedures |
| Witness signatures and photo attachments | Attach witness signatures for destruction and photos before and after destruction | Used for the Revenue Department procedure and the auditor’s certification |
| Linking BOI approval numbers and balance adjustment | Hold the BOI approval number and the status of balance adjustment in the disposal register | Match BOI procedures with inventory records |
| Managing the difference between write-down and tax deduction | Hold the accounting write-down amount and the timing of the tax deduction separately | Track the gap between accounting and tax |
| Free Zone and bonded categories | Hold the category on the location and manage the storage period deadline | IEAT and customs procedures and deadlines |
| Audit log | Record who changed what and when | Prepare for audits and checks by the authorities |
Product examples (vendor claims)
The following are examples of functions described in each vendor’s official documentation. All of them are vendor claims, not recommendations or rankings. Prices are not published, so they are not stated.
- SAP S/4HANA (Fiori app “Slow or Non-Moving Materials”): According to SAP Learning (a course on S/4HANA Cloud Private Edition), this is an analytics app that extracts materials with little or no consumption over a certain period and shows the capital tied up in slow-moving stock. It is explained that, based on the results, decisions are made such as clearance sales, moving stock to sites where there is demand, and approving the scrapping of obsolete items
- SAP lowest value determination based on movement rate (S/4HANA 1610 help, an older version): According to the official documentation, this function judges slow-moving or non-moving items from the movement rate and thresholds and applies the devaluation percentage set for each devaluation category
- Microsoft Dynamics 365 Business Central (Item Age Composition by Quantity and Value Excel): According to Microsoft Learn, this is a report that ages the quantity and value of inventory on hand by receipt date (posting date) and can be filtered by location and item. The Excel layout was introduced in Business Central 2026 release wave 1. Listed uses include identifying slow-moving inventory, planning markdowns and promotions, and calculating inventory turnover and days of inventory
- Microsoft Dynamics 365 Supply Chain Management (inventory aging report storage): According to the archived release notes (2019 release wave 2), the results of an aging report run can be saved under a name, displayed as a list or chart, and exported externally via data entities
- Odoo 19 (Scrap in Inventory): According to the Odoo 19 official documentation, items that are damaged or defective and cannot be repaired are removed from stock with a scrap order and moved to the virtual “Inventory Loss” location. If a loss account is configured, it is reflected in profit and loss, and the history can be checked in the list of scrap orders
These functions support part of the aging totals and disposal records. However, how far Thailand-specific procedures such as BOI approval numbers, the 30-day advance notification to the Revenue Department, witness signatures and IEAT permission can be held with standard functions needs to be checked in a demo for each product. How to proceed with system selection in general is explained in Inventory Management System Implementation: Thailand RFP, Cost and Acceptance Guide.
Model calculation of costs and effects (hypothetical figures)
Assumed factory and assumptions
From here, the costs and effects of excess inventory reduction are calculated with hypothetical figures. All of the following figures are hypothetical figures created for this article. They are not prices of real companies or products. Use them as “the shape of the formula” when you do your own calculation.
The assumed factory is a Japanese-affiliated automotive parts and electronic components factory in Thailand with about 2,000 items.
| Assumption | Value (assumed) |
|---|---|
| Annual cost of goods sold | 400,000,000 THB |
| Average inventory (raw materials + work in process + finished goods, at cost) | 100,000,000 THB |
| Inventory holding cost rate | 12% per year (cost of capital 5% + storage, handling, insurance and stocktake labor 7%) |
| Current write-down and disposal losses (the amount that newly becomes obsolete or expired each year) | 3,000,000 THB per year |
| Hourly rate | 300 THB |
The 12% inventory holding cost rate does not include obsolescence or write-downs. The reduction in write-down and disposal losses is counted only in effect 3, explained later. This is to avoid counting it twice.
The value by inventory age is as shown in Figure 1.
| Inventory age | Value (THB) | Share |
|---|---|---|
| 0 to 90 days | 70,000,000 | 70% |
| 91 to 180 days | 12,000,000 | 12% |
| 181 to 365 days | 10,000,000 | 10% |
| Over 365 days (non-moving inventory) | 8,000,000 | 8% |
| Total | 100,000,000 | 100% |
In this article, the 22,000,000 THB of 91 to 365 days (12,000,000 + 10,000,000) is called the “slow-moving band.”
BOI duty-free raw materials and Free Zone items are excluded from the calculation because their procedures and tax payments vary case by case. The reduction in corporate income tax from deductions (the tax effect) is also excluded from the calculation.
One-time items (not included in annual effects)
First, the items that occur only once are organized.
Disposal of 8,000,000 THB of non-moving inventory: Of this, 2,000,000 THB (at cost) is sold domestically at 40% of cost, recovering 800,000 THB. The remaining 6,000,000 THB is destroyed, and destruction and disposal costs are assumed to be 150,000 THB.
- One-time impact on profit and loss (if no write-down has been booked yet): 8,000,000 – 800,000 + 150,000 = a loss of 7,350,000 THB. If a write-down has already been booked, it is smaller by that amount
- One-time cash: 800,000 – 150,000 = +650,000 THB
Reduction of the slow-moving band (configuration A): Reducing the 22,000,000 THB slow-moving band by 25% means that 22,000,000 x 25% = 5,500,000 THB of cash comes back only once. In the annual effects, only the holding cost (12%, including cost of capital) that was being incurred on the reduced inventory is counted, not this 5,500,000 THB.
KPI improvement and cash improvement do not match
After configuration A, average inventory becomes 100,000,000 – 8,000,000 – 5,500,000 = 86,500,000 THB.
- Days inventory outstanding (DIO): currently about 91 days (91.25 days) → 86,500,000 / 400,000,000 x 365 ≈ about 79 days (78.93 days)
- Inventory turnover: 4.0 times → 400,000,000 / 86,500,000 ≈ about 4.6 times (4.62 times)
What we want you to note here is that of the improvement from 91 days to 79 days, the part due to disposing of non-moving inventory only reduced inventory on the books. The cash that came back from disposing of 8,000,000 THB of non-moving inventory is only 650,000 THB. The improvement in the DIO KPI and the improvement in cash do not match. Be careful not to explain the DIO improvement as “cash came back” in reports to the parent company.
Configuration A: review of definitions, aging table, disposal rules and ordering rules + Excel / BI
Configuration A is a configuration that proceeds with the inventory definitions, the aging table and BI dashboard, the disposal procedure manual, the review of ordering rules and training, using Excel and BI. Costs are assumed to be 600,000 THB initially and 120,000 THB per year.
There are 3 effects.
- Effect 1: storage-related costs after disposing of non-moving inventory: 8,000,000 x 7% = 560,000 THB. This applies only if costs such as external warehouse rent actually go down. Adding the cost of capital on the 650,000 THB of cash that actually came back from disposal (recovery 800,000 – disposal cost 150,000), 650,000 x 5% = 32,500 THB, the total is 592,500 THB per year. The book value of 8,000,000 THB of non-moving inventory multiplied by the 5% cost of capital is not counted. That cash does not come back, so counting it would be double counting
- Effect 2: 25% reduction of the slow-moving band: 5,500,000 x 12% = 660,000 THB per year
- Effect 3: 20% reduction in write-down and disposal losses: This is the effect of countermeasures at the source, such as EOL exit plans. It is counted as a separate measure from the review of ordering rules in effect 2. 3,000,000 x 20% = 600,000 THB per year
The total effect is 592,500 + 660,000 + 600,000 = 1,852,500 THB per year. The net effect after subtracting the annual cost of 120,000 THB is 1,852,500 – 120,000 = 1,732,500 THB per year, and the payback period is 600,000 / 1,732,500 ≈ about 0.35 years (about 4 months).
The numerator of the payback period is only the 600,000 THB implementation cost of configuration A. The 150,000 THB disposal cost for non-moving inventory and the one-time loss of 7,350,000 THB are not included in the payback period calculation. These are shown separately above as one-time items.
Configuration B: adding the inventory system’s disposal register, aging and ERP integration (incremental)
Configuration B is a configuration that, after completing configuration A, adds the inventory system’s aging function, a disposal register and integration with the ERP. It is evaluated by the increment over configuration A (additional costs and additional effects). Additional costs are assumed to be 3,000,000 THB initially and 600,000 THB per year.
The additional effects are as follows.
- Additional reduction of the slow-moving band: an additional reduction equal to 15% of the original slow-moving band of 22,000,000 THB. This is not 15% of the 16,500,000 THB remaining after configuration A, but 15% of the original slow-moving band of 22,000,000 THB. 22,000,000 x 15% = 3,300,000 THB, and its holding cost is 3,300,000 x 12% = 396,000 THB per year
- Additional reduction of write-down and disposal losses: a further reduction of 10% of the base amount of 3,000,000 THB. 3,000,000 x 10% = 300,000 THB per year
- Reduction of manual work: aging totals and preparing disposal documents go from 40 hours to 10 hours per month. The 30 hours saved x 12 months x 300 THB = 108,000 THB per year
The total additional effect is 396,000 + 300,000 + 108,000 = 804,000 THB per year. The net effect of the addition after subtracting the additional annual cost of 600,000 THB is 804,000 – 600,000 = 204,000 THB per year, and the payback period for the additional initial cost is 3,000,000 / 204,000 ≈ about 14.7 years. At a factory of this size, the addition in configuration B effectively does not pay back.
Sensitivity: a company with 3 times the average inventory
Consider a company with 3 times the average inventory, 300,000,000 THB (the same inventory age ratios, and write-down and disposal losses also 3 times, at 9,000,000 THB per year). The slow-moving band becomes 66,000,000 THB.
- Additional reduction of the slow-moving band: 66,000,000 x 15% x 12% = 1,188,000 THB per year
- Additional reduction of write-down and disposal losses: 9,000,000 x 10% = 900,000 THB per year
- Reduction of manual work: 108,000 THB per year (unchanged)
The total additional effect is 1,188,000 + 900,000 + 108,000 = 2,196,000 THB per year, the net effect of the addition is 2,196,000 – 600,000 = 1,596,000 THB per year, and the payback period is 3,000,000 / 1,596,000 ≈ about 1.9 years.
In this sensitivity calculation, for simplicity, the additional costs of configuration B (3,000,000 THB initially and 600,000 THB per year) and the effect of reducing manual work (108,000 THB) are kept unchanged and are not scaled to the size of inventory.
Notes on avoiding double counting
This calculation avoids double counting in the following 4 ways.
- (a) Cash that comes back only once from reducing inventory (5,500,000 THB from the slow-moving band and 650,000 THB from disposal) is not included in the annual effects
- (b) The “saving” obtained by multiplying the 8,000,000 THB book value of non-moving inventory by the cost of capital is not counted, because that cash does not come back
- (c) Obsolescence is not included in the inventory holding cost rate, and the reduction in write-down and disposal losses is counted only in effect 3. However, because effect 2 (reducing the slow-moving band by reviewing ordering rules) also has room to reduce future write-downs, effects 2 and 3 may partly overlap. In this calculation, effect 3 is an assumption set as the effect of a measure separate from effect 2, such as EOL exit plans. The size of the overlap is not addressed in this calculation
- (d) The one-time loss of 7,350,000 THB from disposal is not subtracted from the annual effects. It is shown separately as a one-time item
Items excluded from the calculation are the tax effect, tax payment and balance adjustment for BOI duty-free raw materials, Free Zone items, opportunity loss from stockouts, and the value of using warehouse space for other purposes.
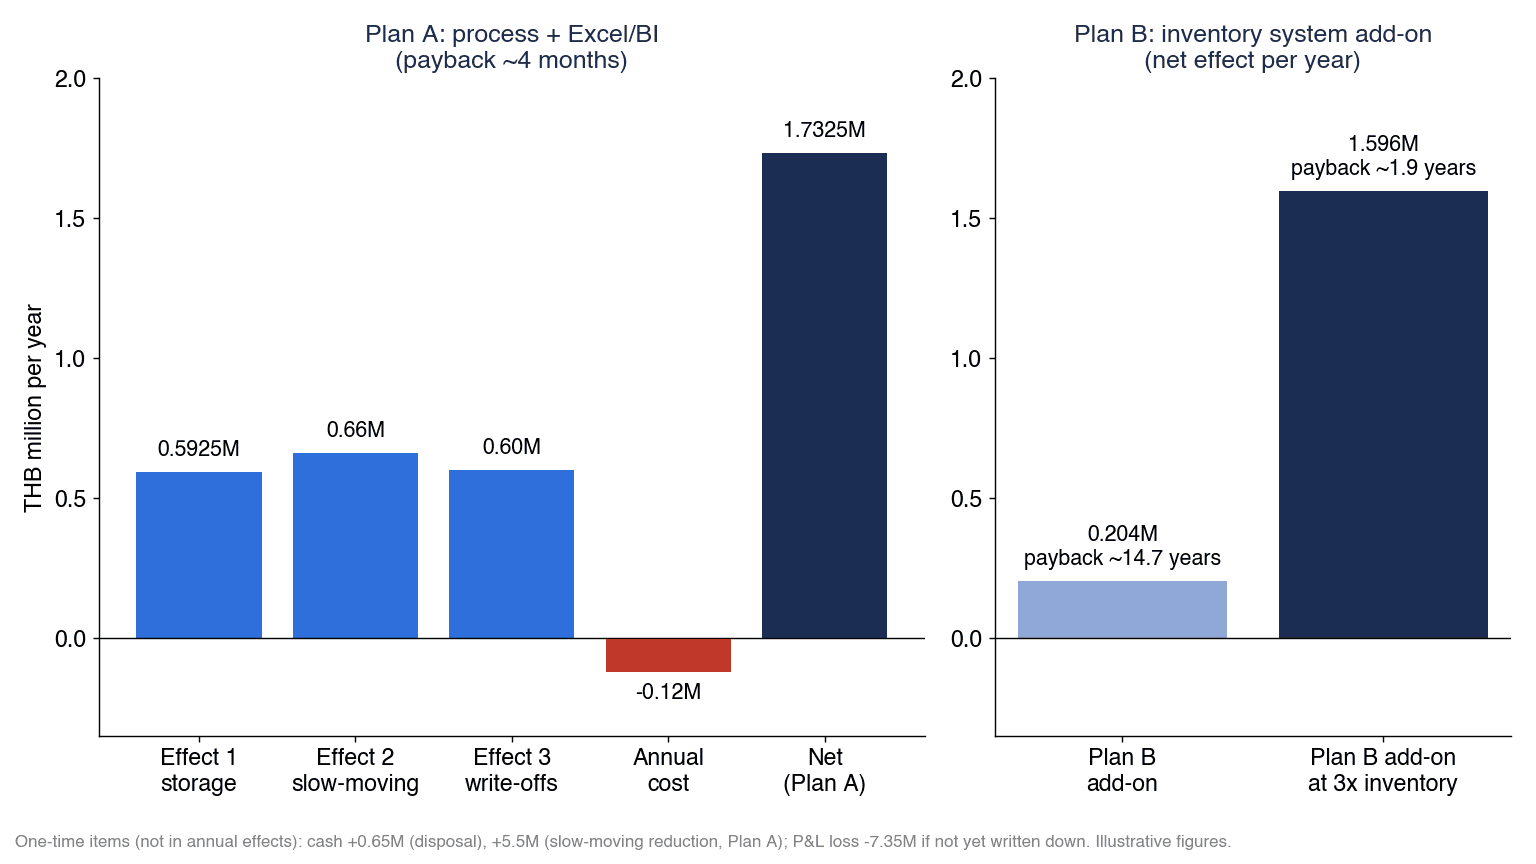
Summary of the calculation
| Item | Configuration A | Configuration B (addition) | Configuration B (addition, 3 times the inventory) |
|---|---|---|---|
| Initial cost | 600,000 | 3,000,000 | 3,000,000 |
| Annual cost | 120,000 | 600,000 | 600,000 |
| Effect 1: storage-related costs after disposing of non-moving inventory | 592,500 | – | – |
| Effect 2: reduction of the slow-moving band (holding cost) | 660,000 | 396,000 | 1,188,000 |
| Effect 3: reduction of write-down and disposal losses | 600,000 | 300,000 | 900,000 |
| Reduction of manual work | – | 108,000 | 108,000 |
| Total effect | 1,852,500 | 804,000 | 2,196,000 |
| Net effect (total effect – annual cost) | 1,732,500 | 204,000 | 1,596,000 |
| Payback period | About 0.35 years (about 4 months) | About 14.7 years | About 1.9 years |
(Unit: THB. Annual figures are per year. All are hypothetical figures.)
| One-time items (configuration A) | Amount (THB) |
|---|---|
| Cash from disposing of non-moving inventory | +650,000 |
| Cash from reducing the slow-moving band | +5,500,000 |
| Impact on profit and loss from disposing of non-moving inventory (if no write-down has been booked yet) | -7,350,000 |
Figure 3 sets out how configuration A’s effect 1 of 592,500, effect 2 of 660,000 and effect 3 of 600,000 and the annual cost of -120,000 lead to a net effect of 1,732,500 (payback about 4 months), alongside the net effect of configuration B’s addition of 204,000 (payback about 14.7 years), the net effect of configuration B’s addition with 3 times the inventory of 1,596,000 (payback about 1.9 years), and the one-time items (cash of +650,000 and +5,500,000, and a loss of -7,350,000).
What can be said from this calculation is as follows. Most of the effect comes from definitions, measurement, countermeasures at the source and disposal rules (configuration A). The disposal register and aging functions of an inventory system are something to consider once inventory size, the number of items and the number of sites are large and the monthly review can no longer be run in Excel. And disposal itself reduces profit once, but leaving the inventory where it is without disposing of it does not bring cash back either.
Excess inventory reduction in 90 days
Days 0 to 30: decide the definitions, aging table and owners
- Decide the definitions of excess inventory, slow-moving inventory and non-moving inventory and the day thresholds for inventory age, by item group
- Check the differences between the books and physical inventory and correct large differences first
- Build an aging table by item x lot x location and sort it in descending order of value
- Decide the owner for each item and fill in the owner column of the aging table
- Create columns for the BOI duty-free raw material, Free Zone and bonded warehouse categories
Days 31 to 60: disposal decisions for non-moving inventory and preparation of procedures
- Starting from the top of non-moving inventory by value, decide the disposal option (reuse, return, sale, donation, destruction, disposal via a licensed contractor)
- Confirm with your accounting auditor whether a write-down is needed and when
- When destroying storable items together, schedule the notification to the revenue office at least 30 days before the destruction date in line with Por.79/2541, and secure the witnesses’ schedules
- For BOI duty-free raw materials, prepare to apply to BOI for approval of sale, destruction, export or donation in line with Por.5/2543
- If you have flood-damaged inventory, keep evidence of the damage and check the application deadline for the BOI support measures (within 6 months from the day the flood ended)
Days 61 to 90: establish countermeasures at the source and the monthly review
- Review reorder points, target inventory and MOQ for items in the slow-moving band
- Create exit plans for items with planned design changes or end of production
- Set decision deadline rules for items on quality hold and returns
- Start a monthly inventory review and check every month the value in each inventory age bracket, the progress of disposal and the status of countermeasures at the source
- Check whether the monthly review can be run in Excel and where it cannot, and finalize the system requirements for the disposal register and aging
Frequently asked questions
What is the difference between excess inventory, slow-moving inventory and non-moving inventory?
This article uses excess inventory to mean “the quantity that exceeds your own policy (target inventory or reorder point),” slow-moving inventory to mean “inventory with little movement over a certain period,” and non-moving inventory to mean “inventory with no receipts or issues at all over a certain period.” Excess inventory is a term about quantity, while slow-moving and non-moving inventory are terms about time. Because an industry standard for the day thresholds could not be confirmed, decide them yourself.
How do you improve inventory turnover?
To improve inventory turnover (cost of goods sold / average inventory), you need to reduce average inventory. However, disposing of non-moving inventory reduces inventory on the books and improves turnover in one go, but very little cash comes back. In this article’s hypothetical calculation, DIO improved from about 91 days to about 79 days and inventory turnover from 4.0 times to about 4.6 times, but the cash that came back from disposing of non-moving inventory was only 650,000 THB. It is important to proceed together with countermeasures at the source, such as reviewing ordering rules and EOL exit plans.
If we book a write-down on non-moving inventory, do we no longer need to throw it away?
Even if you book a write-down, the inventory itself stays in the warehouse, and the storage space and stocktake workload continue. In addition, it has been explained that under Thai tax rules, reserves are not deductible, and the cost of obsolete inventory is deductible only if it is sold or destroyed in accordance with the procedure in Revenue Department Order Por.79/2541. Booking a write-down and making a disposal decision need to proceed separately. Check how your own company should handle these matters with your accounting auditor and tax advisor.
Is inventory deductible if we destroy it?
According to an accounting firm’s explanation, to make the cost of destroying obsolete inventory deductible, you need to follow the rules, procedures and conditions of Por.79/2541, and destruction that does not follow them cannot be deducted. Por.79/2541 sets out requirements such as signatures by witnesses (warehouse, accounting, sales or internal audit, auditor) and, when destroying storable items together, notification to the revenue office at least 30 days in advance. This is not tax advice. Check individual judgments with your tax advisor.
Can we throw away BOI duty-free raw materials?
You cannot throw them away on your own company’s judgment alone. Announcement of the Office of the Board of Investment Por.5/2543 sets out that you need to apply for BOI permission to sell, destroy, export or donate losses and scrap of raw materials under Section 36(1). After disposal, you submit the details and evidence to BOI and adjust the balance. When selling domestically, tax payment is required according to the type of loss. There are BOI support measures for flood-damaged raw materials. Check how your own company should handle these matters with BOI.
Won’t reducing inventory increase stockouts?
If you lower target inventory or reorder points too much, stockouts may increase. When reducing inventory, look at the demand variability and lead time of each item and secure safety stock. Disposal mainly targets non-moving and slow-moving inventory; it does not mean cutting the inventory of fast-moving items across the board.
Do we need a system to manage excess inventory?
You can start with Excel and BI at first. In this article’s hypothetical calculation as well, most of the effect came from definitions, measurement, countermeasures at the source and disposal rules. Once inventory size, the number of items and the number of sites grow and the monthly review and preparation of disposal documents can no longer be run in Excel, consider having the ERP or inventory management system hold the disposal register and aging. The work that could not be run at that point becomes the system requirements as is.
Summary
- If you start excess inventory reduction with disposal, only the numbers improve, and if the sources remain, inventory piles up again.
- The sequence has 4 stages: (1) define and measure, (2) stop the sources, (3) dispose of inventory by the book, (4) build it into the system.
- Excess inventory is a term about “quantity,” while slow-moving and non-moving inventory are terms about “time.” You decide the day thresholds yourself.
- The aging table holds both inventory age based on receipt date and the last issue date, is built by item x lot x location, is sorted in descending order of value, and has an owner assigned.
- The sources are order lots and MOQ, swings in customer forecasts, design changes and obsolescence, quality holds, and importing up to the full BOI Max Stock allowance.
- Disposal involves 4 procedures that move separately: accounting (NRV write-down), tax (Por.79/2541), BOI (Por.5/2543) and the Free Zone (IEAT permission). Even if a write-down is booked, the tax deduction comes once the procedure is complete.
- In the hypothetical calculation, configuration A pays back in about 0.35 years (about 4 months). The addition of a system in configuration B takes about 14.7 years to pay back (effectively does not pay back at this size), and pays back in about 1.9 years for a company with 3 times the inventory.
- Even if DIO improves from about 91 days to about 79 days, the cash that came back from disposing of non-moving inventory is only 650,000 THB. KPI improvement and cash improvement do not match.
- This article is not legal, tax or accounting advice. Check how your own company should handle these matters with your accounting auditor, tax advisor, BOI and IEAT.
We can help even at the stage before choosing a system, such as designing the aging table and disposal rules, or organizing the requirements for how the ERP or inventory management system should hold the disposal register. If you are considering reviewing your inventory in a way that fits the realities of your factory in Thailand, please feel free to contact us through our contact form.
References
- Thailand Manufacturing Sector Hits 9-Month High (Trading Economics)
- Thailand Business Confidence Remains Subdued (Trading Economics)
- Thailand’s August car production rises 10.9% on year (Capital.com / Reuters)
- Thai exports surge 24.3% in August as AI demand lifts electronics (The Nation)
- Thai floods disrupt factories, capital still at risk, PM says (The Star / Reuters)
- Severe Floods Inundate Thai Factories, Causing Over $30m in Direct Losses (The Nation)
- Weekly Economic Review (Krungsri Research)
- The Hackett Group Finds Record $1.94 Trillion Working Capital Opportunity Among North America’s Largest Companies (Finviz / Business Wire)
- How Big is the ‘Zombie Inventory’ Problem? (Talking Logistics)
- Days Inventory Outstanding (DIO) (Corporate Finance Institute)
- Gross Margin Return on Investment: Definition & Formula (Fathom)
- IAS 2 Inventories (IFRS Foundation)
- Write-Down of Inventories to NRV (Forvis Mazars Thailand)
- On the revision of the Thai accounting standard for non-publicly accountable entities (TFRS for NPAEs) (1) (Forvis Mazars, in Japanese)
- Revised and Amended Thai Financial Reporting Standards and Thai Accounting Standards (Forvis Mazars)
- Tax Issues Relating to Trading Inventory (Forvis Mazars Thailand)
- Revenue Code Section 65_76 (The Revenue Department, English translation)
- Revenue Department Order ป.79/2541 (The Revenue Department, in Thai)
- Office of the Board of Investment Announcement No. Por 5/2543 (BOI, unofficial English translation)
- BOI supports flood-affected operators (BOI press release 168/2569, in Thai)
- Use of raw material privileges and practices for losses (BOI Chiang Mai seminar presentation, in Thai)
- Notification of the Board of Directors of the IEAT Re: Permission to Bring Materials out of the IEAT Free Zone (IEAT, English translation)
- Tax Incentives Guidebook (Customs Department)
- Exploring SAP Fiori Apps for Inventory Reporting and Optimization (SAP Learning)
- Lowest Value Determination Based On Movement Rate (SAP Help Portal, S/4HANA 1610)
- Item Age Composition by Quantity and Value Excel (report) (Microsoft Learn)
- Inventory aging report storage (Microsoft Learn, Dynamics 365 Release Plan 2019 wave 2)
- Scrap inventory (Odoo 19.0 Documentation)


