


You have worked through the price bands, compared the major vendors, and sketched out how the vehicles would move through your plant. And yet the approval request still sits unsigned. There is usually one reason for that pause, and it is not a gap in the technical analysis. It is the absence of proof that a plant reasonably similar to yours actually got a result. AGV implementation case studies are what close that last gap. This article does not invent confidential figures or attach company names to numbers that cannot be verified. Instead, it organises the effect patterns that industry reports and vendor-published material do support, sorted by industry and by process. Payback logic and the incentive environment are covered too, always from the perspective of a factory operating in Thailand or elsewhere in ASEAN.
Why case studies are the last piece of the evaluation puzzle
Evaluations of automated material handling tend to follow a predictable order, and case evidence almost always sits at the end of it. It is worth being explicit about why.
The question that survives after definitions, pricing, layout and vendor comparison
Most teams start with definitions. What is an AGV, and how does it differ from an AMR? Then comes cost. What does a vehicle actually run to, and what else has to be bought alongside it? After that comes layout. Will these vehicles genuinely navigate our aisle widths and traffic patterns? Then vendor comparison. Which supplier fits our requirements and our service expectations? By the end of that sequence, most of the material needed for an internal proposal is in hand.
The problem is that having the material does not get the proposal signed. The question that comes back from the decision maker is usually a single sentence.
“So has this actually worked at a plant like ours?”
That is not quite a cost-effectiveness question. It is not asking whether your numbers are defensible. It is asking for precedent under comparable conditions. Definitions, pricing, layout and vendor comparison are all pre-implementation information. Case evidence is the only category that is post-implementation. Needing it last is a natural consequence of the order in which everything else gets answered.
Why this kind of evidence is genuinely hard to find
If you have gone looking for AGV and AMR case studies and come away frustrated, the difficulty is real rather than a reflection of your search skills. Several forces push against publication.
- Material handling automation ties directly to competitive position, so many manufacturers decline to publish layouts or effect figures at all
- Vendor case study pages naturally showcase successes with their own products, and rarely document sites where the fit was poor
- Deployments carried out at Thai and wider ASEAN sites are frequently never written up for a Japanese-language audience at all
- Even where numbers are published, the underlying assumptions, such as shift count, labour cost and vehicle utilisation, are often omitted, which makes the figures impossible to transfer
In other words, the reason you cannot find what you are looking for is that this information does not circulate well in the form of named-company case studies.
This article organises effect patterns rather than named accounts
For that reason, what follows is not a set of company profiles. It is a typology. Drawing only on what industry reports and vendor-published technical material can support, it sets out which vehicle types tend to be deployed in which processes, and which areas of performance tend to move as a result.
There are two reasons to structure it this way. The first is discipline about evidence, since writing company names and figures that cannot be verified helps nobody. The second is that patterns transfer better than results do. Another plant’s percentage reduction is not your answer, but once you can see the structural reason an effect appeared, you can substitute your own conditions and calculate.
For the mechanics of running a deployment and the cost breakdown behind it, see how to approach an AGV or AMR deployment and what it costs. This article picks up where that one leaves off, at the question of what changes once the vehicles are running.
Automated guided vehicle case study patterns by industry
The same acronym covers very different installations. Change the industry and both the vehicle type and the area where benefit shows up change with it. Four industries cover most of the ground.
Automotive parts and assembly, where just-in-time supply is the fit
Automotive component and vehicle assembly lines were among the earliest adopters of AGVs, and the reason is structural. These lines demand that parts never run out at the line-side while also never accumulating there, which suits transport that follows a fixed route on a fixed cycle.
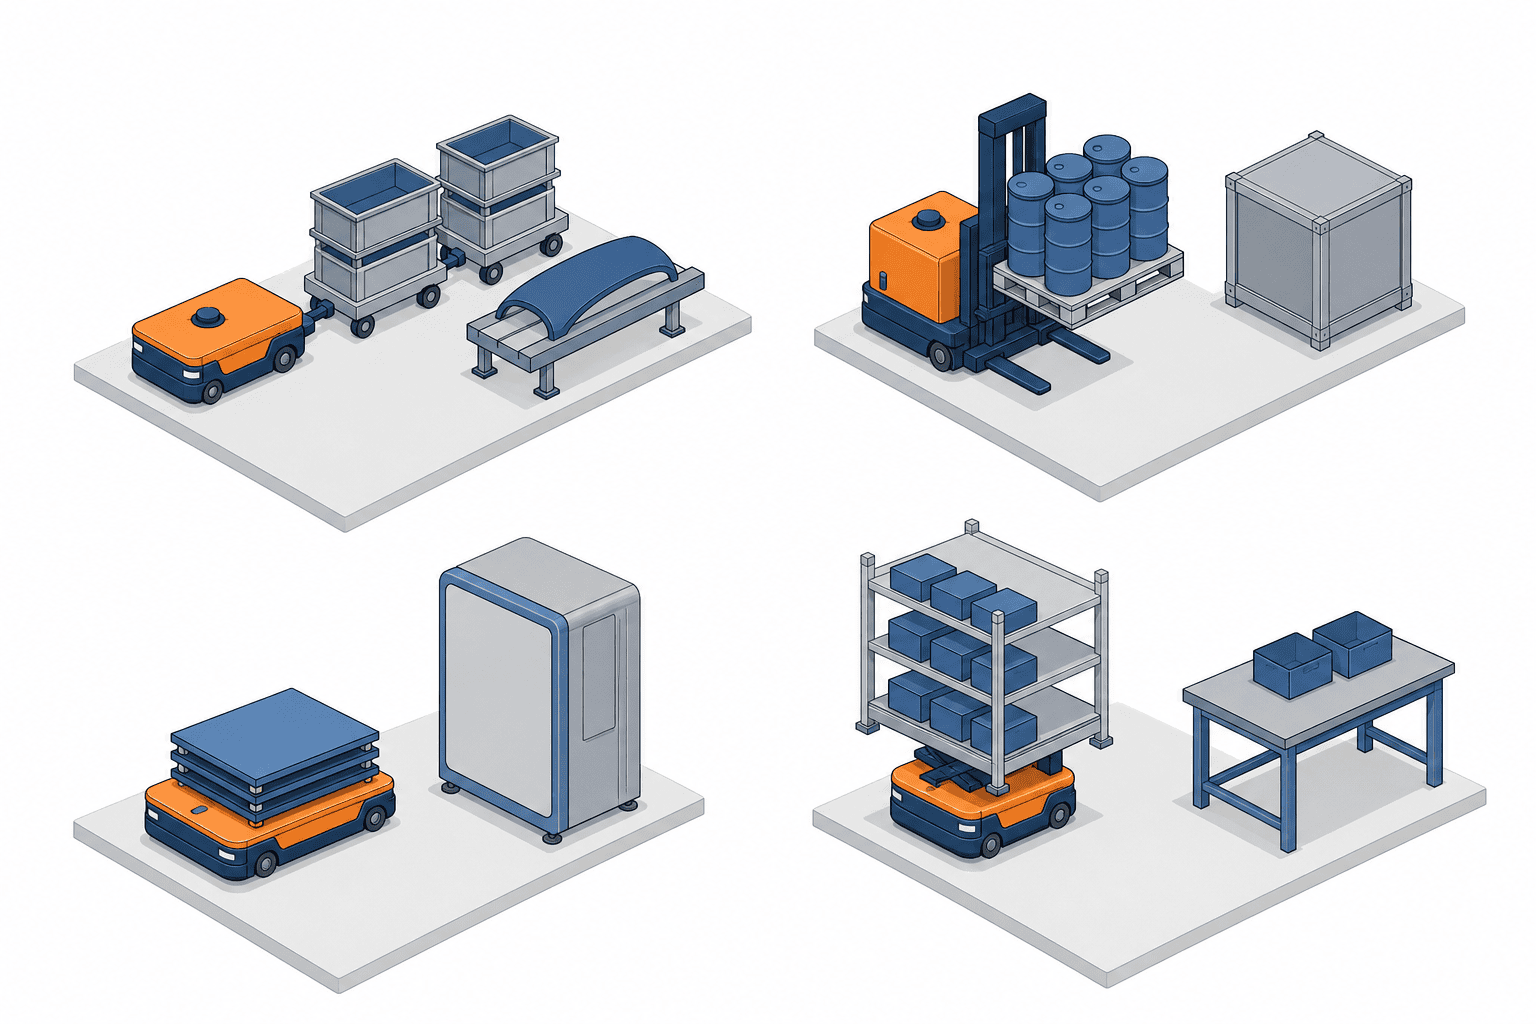
The dominant vehicle type is the tugger, pulling several carts in a train. A typical pattern is a set of carts loaded with parts bins circulating on a route, with empty carts swapped out at the line-side. Where distances between processes are long, or where material moves in full pallets, forklift-type AGVs are used alongside the tuggers.
One of the effect areas reported here is that just-in-time parts supply becomes easier to sustain. When people carry the material, delivery timing depends on whether the assigned operator happens to be free. Automated transport runs to the planned cycle regardless. The knock-on result is that line-side inventory can be held down.
The second reported effect is the redeployment of the people who were doing the transporting. This is not the same thing as headcount reduction. Moving material adds no value to the product, so the effect takes the form of releasing that time into work that requires judgement, such as inspection or changeover.
Food and beverage, where weight and hygiene zoning dominate
Food and beverage plants move a great deal of heavy material, from raw ingredients through to filled and packed product. Here the reported benefit of AGVs and AMRs shows up first as improved safety by removing situations where a person carries or manoeuvres heavy loads. Back injury risk and collisions caused by awkward cart handling are the specific exposures that come down.
On vehicle type, forklift AGVs handling full pallets are common, alongside vehicles fitted with onboard conveyors or roller decks that automate load transfer. The typical configuration receives product from the discharge conveyor at the end of a line without human involvement and carries it to the next process or to the palletising area.
Where transport crosses hygiene zones, reducing human movement is itself an operational advantage, because it cuts the number of door openings between zones and the administrative load of entry and exit procedures.
Semiconductors and electronics, where reducing human movement is the point
Semiconductor and electronic component plants describe the benefit differently from everyone else. Because human movement is itself a source of particles and airborne contamination, automating transport and reducing the number of people walking the floor contributes directly to maintaining cleanliness.
In this industry, then, transport automation is a quality measure before it is a labour measure. Because it is positioned as removing one variable that affects yield, the cost justification is framed differently from other sectors as well.
The vehicles are typically low-profile or conveyor-equipped units carrying wafer cassettes or trays, specified to the relevant cleanliness class. Loads are light, but tolerance for vibration and shock is low, so smoothness of travel and stopping accuracy become the decisive selection criteria.
Warehousing and finished goods dispatch, where walking distance and product mix rule
The product warehouse and dispatch preparation area attached to a plant is where AMR adoption tends to advance fastest within logistics automation. In picking work, a large share of an operator’s time goes into walking between racks and the workstation. Reversing the relationship so that racks or carts come to the person, instead of the person going to the rack, compresses that walking time.
The benefit cited here is flexibility in the face of high-mix low-volume production and short lead time orders. Fixed conveyors and sorters require construction work to rearrange, whereas AMR routes are changed in software. The more frequently your item mix or dispatch pattern shifts, the more that difference matters.
The table below summarises the four industries in terms of vehicle type and where the benefit lands.
| Industry | Vehicle types most used | Where benefit typically appears |
|---|---|---|
| Automotive parts and assembly | Tugger, forklift AGV | Just-in-time supply, lower line-side inventory, redeployment of transport staff |
| Food and beverage | Forklift AGV, conveyor-equipped units | Safety when moving heavy loads, less human movement across hygiene zones |
| Semiconductors and electronics | Low-profile units, conveyor-equipped units | Fewer particles from human movement, more consistent handling quality |
| Warehousing and finished goods dispatch | AMR, rack-carrying units | Shorter walking distance, response to high-mix and short lead times |
If one of those rows resembles your operation, the next lens to apply is the process. Within a single industry, the character of the investment changes depending on which process you automate first.
AMR case study patterns by process
Set the industry axis aside and look at the same evidence by process, and a different set of commonalities appears. Three processes are enough to cover it. An equivalent breakdown for a different technology is available in our article on collaborative robot use cases, and reading the two together gives a fuller picture of how to choose what to automate first.
Site transport, from warehouse to production building
This is movement between buildings on the same site, or from a materials warehouse into the production area. Distances are long, round trips are frequent, and the route may run outdoors or partly outdoors.
The defining characteristic of this process is that transport volume is predictable. Issue slips and the production plan already determine, within reason, what moves when and in what quantity. That makes the effect of automation easier to estimate, which is why site transport is so often chosen as the first application.
The counterweight is environmental. Road surface condition on outdoor stretches, ramp gradients, drainage during the rainy season and integration with shutters and doors all shape vehicle selection. Fix the vehicle before resolving those, and you end up with a route the vehicle cannot actually run.
Warehouse receiving and dispatch, inverting the rack-to-person relationship
This covers put-away on receipt and picking on dispatch. The central idea is the inversion already mentioned, in which racks or goods travel to the operator rather than the operator travelling to the racks.
The benefit divides into two parts. Less walking means more of the shift is available for picking itself, and because the system controls transport timing, the gap in work intensity between peak and quiet periods narrows.
One caution matters more here than anywhere else. The effect in this process depends heavily on how accurately the AMR fleet integrates with the inventory or warehouse management system. If the data on what is stored where does not match physical reality, an AMR simply delivers the wrong rack with great precision. When you read a case study of this process, give the description of host-system integration the same weight as the description of the vehicles.
Inter-line transport, which makes process delay visible
This is the handover of completed work from one process to the next. It is the most granular movement in a plant and the most likely to be handled in whatever way individual operators have got used to.
Automating it produces a secondary effect that is easy to overlook. Delay between processes starts to appear as data, because every transport instruction and every actual movement leaves a record, so it becomes possible to trace after the fact where the waiting is occurring. Work that began as a material handling project can in this way become an entry point for production management improvement.
The offsetting factor is that this process imposes the tightest takt requirements of the three. If transport cannot keep pace with the rate at which the upstream process produces, the line stops. Feasibility therefore has to be judged against peak transport volume, not average volume.
How to think about payback
Payback period is the number everyone wants from a case study. The honest treatment is to give the range, then explain how to read it.
What the 12 to 24 month figure does and does not mean
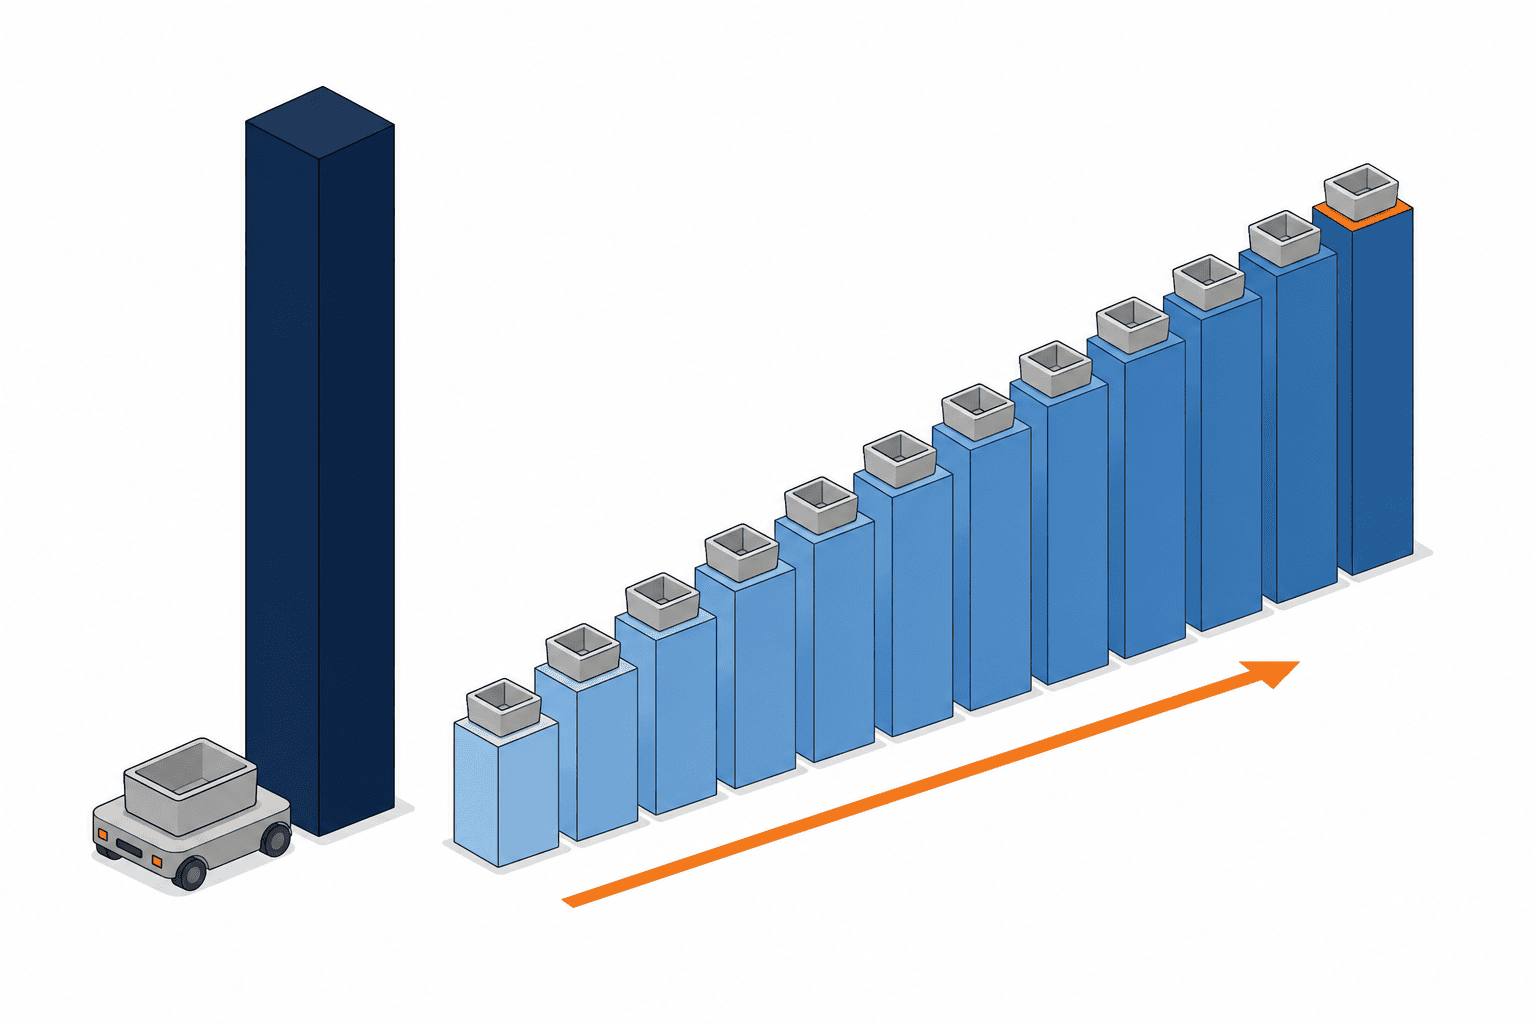
On payback for AGV and AMR investment, several specialist manufacturers and system houses publish the same broad guidance, namely that many sites land somewhere in the region of 12 to 24 months. The same sources add that plants running multiple shifts with high vehicle utilisation tend to sit towards the shorter end of that band.
It would be a mistake, though, to translate this into “AGVs pay for themselves in two years”. The range describes what is commonly observed where conditions are favourable. It is not a guaranteed period. A single-shift operation with low transport frequency and vehicles that spend much of the day idle will naturally take longer.
For internal presentations, the straightforward approach is to quote the range as published industry guidance and then show separately where your own plant is likely to fall within it.
The three variables that move the payback number
Payback discussions go off the rails when the assumptions are not shared. At minimum, state these three.
- Shift count. The same vehicle running two or three shifts accumulates double the daily operating hours or more, which changes recovery speed directly
- Transport labour cost in the target process. How much time currently goes into moving material is the denominator of the whole calculation
- Vehicle utilisation. If vehicles will sit idle for long stretches, the prior question is whether to reduce fleet size or widen the scope of processes covered
Ask a vendor for a payback estimate while any one of those three is unknown, and what comes back is a product of the assumptions the vendor chose to fill the gap.
The trap in converting effects into money
There is a second hazard in translating case evidence to your own site, which is what to do with effects that resist monetisation.
Redeploying transport staff can be expressed in labour cost. Improved safety when handling heavy loads, particle suppression in a semiconductor plant, and layout flexibility for high-mix low-volume production do not convert cleanly into a currency figure.
Build the payback calculation only from the effects you can price, and the investment case skews conservative. Force the unpriceable effects into numbers anyway, and the moment someone asks for the basis, the credibility of the whole presentation drops.
The workable approach is a two-track one. Calculate payback from the monetisable effects, and present the non-monetisable effects separately in qualitative terms. Safety and quality improvements stand as investment rationale in their own right. There is no requirement to compress everything into a single number.
Why the policy environment in Thailand is producing more logistics automation cases
For a plant in Thailand, whether case evidence accumulates is not purely a technology question. The incentive framework and the supply base are both exerting real influence.
BOI measures in 2026 are pushing automation investment forward
The Thailand Board of Investment has introduced a package for 2026 known as Smart and Sustainable Industry. It grants corporate income tax relief for upgrades to machinery and equipment, automation and robotics deployments included.
Of the published conditions, these are the ones worth having in front of you at the evaluation stage.
- Relief is capped in principle at 50% of the qualifying investment
- Where 30% or more of the automation and robotics machinery is linked to Thai-manufactured content, the cap rises to 100%
- Qualifying investment starts at a minimum of 1 million baht, excluding land and working capital
- Implementation must be completed within 3 years of certificate issuance
- Applications opened on 15 January 2026, and many of the measures are time-limited to the end of 2027
The fact that the cap moves with Thai-manufactured content has a direct bearing on sourcing. Two vehicles with equivalent performance can carry different net investment burdens depending on where they were built, which makes this worth raising with vendors early rather than late.
The time limit matters just as much. There is a substantial gap between starting an evaluation and having equipment in operation, so if the incentive is part of your business case, you need a schedule worked backwards from the deadline.
The supplier base inside Thailand is building out
Alongside policy, the second factor generating more case evidence is supply. International AGV and AMR manufacturers have been establishing a presence in Thailand, and industry directories list Thai operations for companies including KUKA, Linde Material Handling and Mitsubishi Logisnext.
This is not an abstract point. With material handling equipment the job is not over the moment it is installed, because how quickly it can be recovered after a stoppage is what determines realised utilisation. Whether there is a service base in country, whether spare parts are held locally, and whether engineers can support in the local language are selection criteria that never appear on a specification sheet.
The comparison axes themselves are covered in detail in our AGV manufacturer comparison. Here we return to what happens after that comparison has been made.

Mixed-vendor fleets have become a realistic option
On the technical side, one development is changing how case studies get built in the first place. It is the spread of a standard called VDA 5050.
VDA 5050 is an industry standard that allows AGVs and AMRs from different manufacturers to be operated together from a single fleet management system. Version 3.0 was released in March 2026.
The standard earns its keep at the second phase of a project and beyond. Traditionally, a plant that standardised on one vendor’s vehicles for its first deployment would find that considering a different supplier for an expansion meant splitting the management system in two, with traffic control handled separately on each side. The practical result was a structure that locked plants into whoever they chose first.
Choosing vehicles and systems that support the standard loosens that lock-in. For a plant deploying in stages, it lowers the risk carried by the very first selection decision. It is also a useful thing to look for when reading case studies, because whether a plant standardised on one vendor or mixed several tells you a good deal about the philosophy behind its system architecture.
That said, claiming support for a standard and delivering interoperability are not the same thing. Supported versions and implementation coverage vary between manufacturers, so proven interconnection is something to verify case by case.
Failure patterns visible in the case evidence, and how to avoid them
For your own decision making, the shape of the failures is often more useful than the successes. These are the recurring stumbles that public information makes visible.
Fixing the layout first and then shopping for a vehicle
The most common problem is one of sequence. Treating the existing layout as a given and hunting for a vehicle that can operate within it narrows the field dramatically. Aisle width, turning radius, floor level changes and sightlines at intersections all interact with vehicle travel performance, which means they properly belong in the same conversation.
The remedy is to separate layout constraints into what genuinely cannot move and what is actually adjustable. Columns and walls stay where they are, but the position of staging areas and the way carts are parked are usually negotiable. Make that distinction first and the range of viable vehicles widens considerably. The design thinking behind this is set out in our article on AGV layout design.
Selecting a manufacturer on vehicle price alone
Unit price is the easiest thing to compare, so decisions gravitate towards it. Real total cost includes integration with host systems such as WMS or ERP, charging infrastructure, safety measures, maintenance contracts and the cost of future expansion. A cheaper vehicle whose system integration turns into bespoke development can end up more expensive overall.
The remedy is to ask, at quotation stage, for the configuration and cost of a scenario in which the fleet doubles three years out. Once the shape of the expansion is visible, differences that unit price conceals begin to show.
Measuring success purely in headcount reduction
Projects measured solely by how many transport staff can be removed tend to stall partway through. Material movement is often already handled by a small number of people, so the removable headcount does not justify the capital request.
As set out above, AGV and AMR benefits distribute across redeployment, safety, quality and flexibility. Insisting on a single headcount metric means that most of this distributed value drops out of the evaluation.
Transplanting another company’s numbers directly
The final caution goes to the heart of this article. Published case figures rest on that plant’s shift pattern, wage levels, transport distances and utilisation. Different assumptions produce different results.
What you should extract from a case study is not the result but the causal structure that produced it. If you can read out that “payback was fast because this was long-distance, high-frequency, two-shift transport”, you can then judge whether your own material flow shares that structure. The numbers themselves have to be recalculated under your conditions.
What to check inside your own plant first
Here is the preceding discussion reduced to things you can act on. All of these can be settled internally before you talk to a vendor.
- Do you know how much time goes into material movement, broken down by process? Rough headcount and hours are sufficient
- Do you know peak transport volume for the target process? Peak rather than average is what drives the decision
- Can you state shift count and operating hours clearly? Every payback estimate starts here
- Have you inventoried the level changes, gradients, doors and outdoor sections along the transport routes?
- How closely does inventory system data match physical stock?
- Do you have a plan for who responds, and how, when a vehicle stops?
- If expansion is possible, do you have a view on its timing and scale?
- If you intend to use the BOI incentive, can you draw a schedule worked backwards from the deadline?
Get the first three of those settled and conversations with vendors move quickly to concrete estimates. Go out for quotations with them still blank, and you will collect documents that cannot meaningfully be compared.
If you are still deciding between AGVs, AMRs and manual transport in the first place, our performance comparison of AGVs, AMRs and manual transport sets out the decision criteria and is worth reading first.
Frequently asked questions
Where can I find AGV implementation case studies?
Three sources cover most of what is available, namely vendor case study pages, technical articles published by industry associations and trade show organisers, and system integrator blogs. All three share the same limitation in that they exist to present the author’s own products or projects, so sites where the fit was poor rarely appear. The practical way to use them is not to lift the figures but to read the structure, meaning which vehicle type was applied to which process.
How much benefit does an AGV deployment actually deliver?
There is no single number that captures it. The effect areas that are consistently reported include redeployment of transport staff into other processes, improved safety when handling heavy loads, suppression of particles associated with human movement in semiconductor plants, easier just-in-time parts supply on automotive assembly lines, and layout flexibility for high-mix low-volume production. On payback, several specialist firms publish a range in the region of 12 to 24 months, but because it depends on shift count, labour cost and utilisation, it is not a period you can count on achieving.
Do AMR case studies differ from AGV case studies?
They differ in the processes they tend to cover. Site transport and inter-line transport, where a fixed route is repeated at high frequency, are dominated by AGV cases, while picking with constantly changing destinations and warehouse work with frequent layout changes are dominated by AMR cases. What matters when reading them is less the label on the vehicle than whether the transport route is fixed or variable. A case that does not match your own situation on that point will also differ in how the benefits appear.
Are there AGV case studies from plants in Thailand?
The supply side is clearly developing, with Thai operations confirmed for international manufacturers including KUKA, Linde Material Handling and Mitsubishi Logisnext. Publicly available cases that let you verify a specific company’s deployment details or effect figures as primary information, however, remain limited. That is precisely why this article presents effect patterns by industry and by process rather than named company profiles.
Can I use the published payback range directly in an internal proposal?
Using it on its own is not advisable. The 12 to 24 month range describes what tends to be observed where conditions are favourable, and it is not a guaranteed value. Present it as industry guidance, then show a separate calculation using your own shift count, transport labour cost and expected utilisation. That structure avoids misunderstandings caused by differing assumptions.
Can AGVs from different manufacturers operate together?
Technically this has become realistic. The VDA 5050 industry standard defines how vehicles from different manufacturers can be operated together under a single fleet management system, and version 3.0 was released in March 2026. Supported versions and implementation coverage still vary between manufacturers, so proven interconnection needs to be verified supplier by supplier.
Summary
The main points are these.
AGV and AMR evaluations proceed through definitions, pricing, layout design and vendor comparison, and end with the question of whether a comparable plant genuinely saw results. Because material handling automation is tied to competitive position, that information does not circulate well as named-company cases, and finding nothing is the normal outcome of searching.
The productive alternative is to read the evidence as effect patterns by industry and by process rather than chasing individual logistics automation accounts. Automotive parts point to just-in-time supply, food and beverage to safety in heavy load handling, semiconductors and electronics to suppression of particles from human movement, and warehousing to shorter walking distances and responsiveness to product mix. Viewed by process, site transport is the easiest to estimate, warehouse receiving and dispatch depends on integration accuracy with host systems, and inter-line transport succeeds or fails on peak transport volume.
On payback, industry guidance points to roughly 12 to 24 months, but this is a band shaped by shift count, transport labour cost and utilisation rather than a guaranteed period. Calculating payback from monetisable effects while presenting safety and quality gains separately in qualitative terms is the realistic way to structure the case.
In Thailand, BOI measures for 2026 provide corporate tax relief for automation investment, with many of the provisions time-limited to the end of 2027. International manufacturers are building out local operations as well, so the environment for generating case evidence is improving. On the technical side, the spread of VDA 5050 has made mixed-vendor configurations a realistic option.
Finally, what you should take from a case study is not the result but the structure that produced it. Whether that structure overlaps with your own material flow is where the decision actually turns.
At the stage where you are still looking for case evidence, internal requirements are usually not yet settled, and that is entirely normal. TOMAS TECH works with Japanese manufacturers operating in Thailand from exactly that point, helping to think through which process is the realistic place to start and roughly where payback is likely to fall given your transport volumes and shift structure. You are welcome to get in touch while you are still comparing options and well before any supplier has been chosen, through our contact page.
References
- Nihon Dengi – AGV and AMR implementation solutions
- FIWEEK HUB – AGV fundamentals and factory applications
- Factory DX Center – Ten patterns of AGV implementation
- Kollmorgen – When Will My AGVs Turn Into Money Machines
- K.Hartwall – What is the ROI of AGV implementation
- Mobile Robots – Thailand supplier directory
- Interact Analysis – Why AMRs are being adopted on factory floors
- LogisticsIQ – Automated Guided Vehicles Market
- Mahanakorn Partners – Thailand’s BOI in 2026


