


Introduction: Three Rules to Decide Before Implementing a Customer Forecast Management System
In Japanese manufacturing, the advance quantity information that a customer sends before the firm order is called naiji (customer forecast). In this article we use “customer forecast” for naiji throughout. In the EDI context, the same information is carried in messages such as the planning schedule (release).
If your factory is considering a customer forecast management system, you may recognize some of these problems. Each time a new customer forecast arrives, someone picks out the differences from the previous version by hand and corrects the Excel plan. The previous version is overwritten and no longer exists. When the forecast drops, materials and work in process are left over. When the forecast rises, there is weekend overtime or premium freight. And there is no written agreement with the customer on how far ahead materials may be bought.
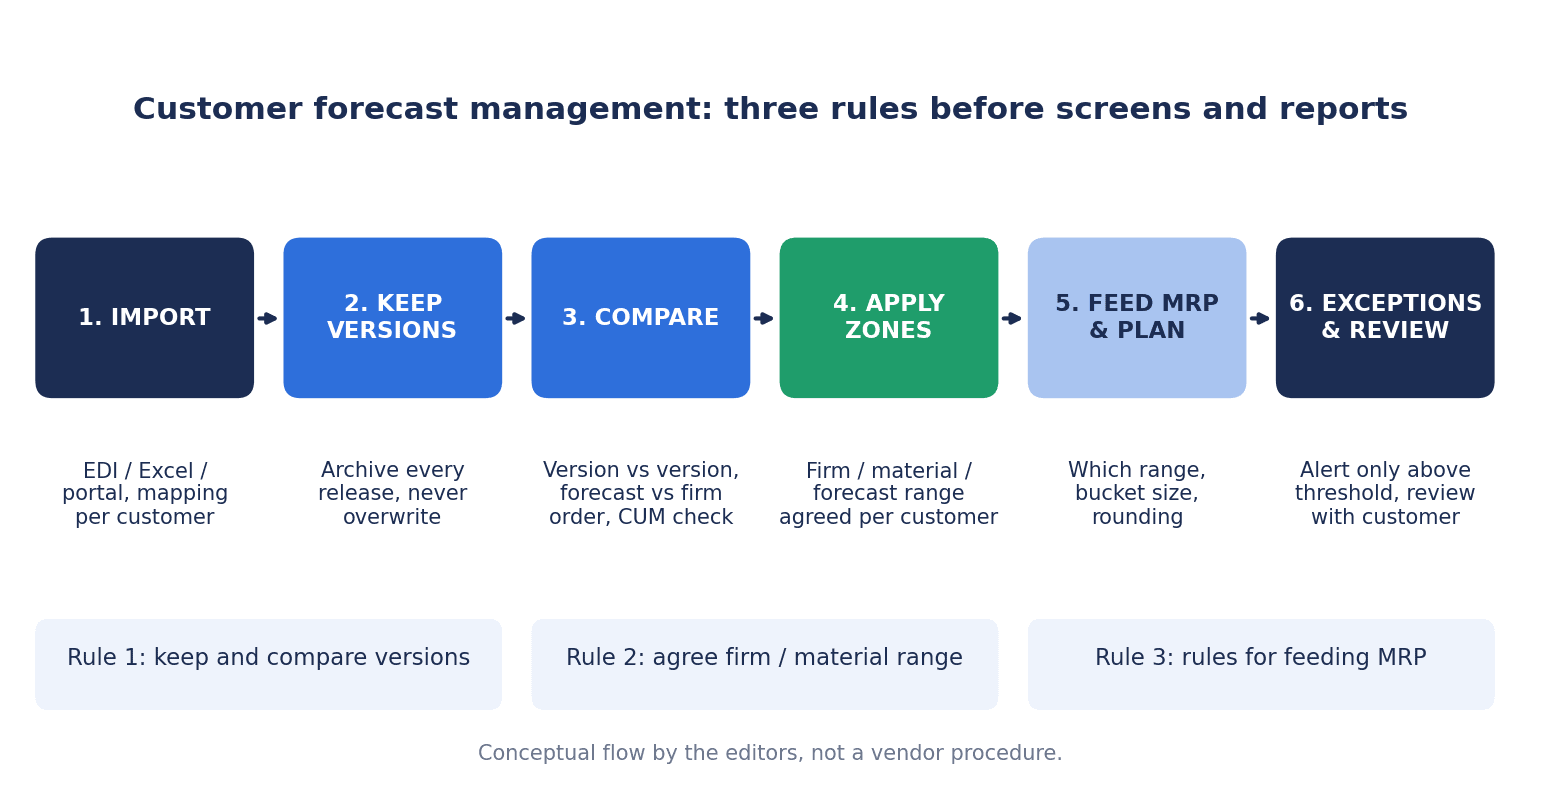
In this article, we take the view that what you should decide first when implementing a customer forecast management system is not the screens or reports but the following three rules.
- Saving and comparing versions: keep a record of which version changed, when, and by how much
- The scope of responsibility for firm production and material procurement: agree with the customer up to which period you may manufacture, and up to which period you may only procure materials
- Rules for feeding MRP and the production plan: which version to pass on, when, at what level of aggregation, and with what rounding, and how large a change has to be before the plan moves
This is not a claim that “the system does not matter.” As we will see later, major ERPs and customer forecast management products hold these three rules as configuration settings. That is exactly why, if the rules have not been decided internally and with the customer, you cannot configure the system even after you buy it. On the other hand, there are also cases where the package lacked a function and custom development was needed.
A note before we start. This article is not a product recommendation or ranking. Product functions are presented as each company describes them in its public materials. The cost and benefit estimate uses hypothetical figures prepared for this article. Some sections touch on Japanese laws and guidelines, but we do not assert whether they apply as is to transactions between local subsidiaries in Thailand.
Why Thai Parts Factories Should Revisit Customer Forecast Management Now
Thai vehicle production is at a stage where the change in mix stands out more than the change in volume. We check the figures together with their scope.
According to Xinhua, reporting an announcement by the Federation of Thai Industries (FTI), Thailand’s vehicle production in August 2026 was 124,646 units, up 10.93% year on year. Cumulative production for January to August was 959,711 units, up 1.27% from the same period of the previous year. Domestic sales in the same month of August were 59,809 units (up 25.59% year on year). Domestic sales of passenger BEVs were reported to be up 113.29% year on year and to account for 32.97% of total domestic sales. Meanwhile, production of internal combustion engine passenger cars fell 20.51% year on year in August and 32.62% year on year for January to August, which was attributed to a decline in vehicles built for export. Completely built-up vehicle exports in August were 69,724 units (down 2.04% year on year), and exports to the Middle East were down 40.24%.
According to Nation Thailand (August 1, 2026), the FTI Automotive Industry Club lowered its 2026 production target from 1.5 million units to 1.45 million units. The entire reduction is in vehicles built for export. The export target went from 950,000 units to 900,000 units, while the domestic target of 550,000 units was left unchanged. In the same article, the club’s spokesperson explained that more than 90% of the parts for pickup trucks are produced locally, and that the prolonged slump in pickup sales has been reducing production across the supply chain, including parts manufacturers.
Investment in electrification is also continuing. According to Nation Thailand (July 3, 2026), the Thailand Board of Investment (BOI) had approved 198 EV-related investment projects worth more than 137 billion baht as of May 2026 (these are approval-based figures). MarkLines writes that in 2025, Thai parts suppliers faced production adjustments by Japanese OEMs in the domestic market and a slowdown in the pickup market, while being required to respond to electrification driven by the expansion of Chinese OEMs and to growing HEV demand, centered on Japanese OEMs.
These figures are national statistics and do not apply to any individual factory or customer. Still, in this article we take the view that at a stage when destinations and model mix are shifting, the way customer forecasts change from version to version may also differ by customer and by part number. It is a good opportunity to check whether you have a mechanism for keeping versions and measuring differences.
What a Customer Forecast Is: How It Differs from a Firm Order and How It Arrives
Nobuyuki Ueno of Hiroshima University of Economics, in his paper “Naiji Theory” (2021, in Japanese), introduces naiji as order schedule information presented to a supplier ahead of production, by a customer such as a manufacturer or distributor, or by the company’s own sales department. A firm order eventually arrives, but it is not necessarily the same as the forecast, so the paper explains that the forecast is a reference value for production. The paper states that the firm order is presented a certain period before the delivery date (the delivery lead time), while the forecast is presented earlier, before the manufacturing lead time. It adds that forecasts are generally presented several times, for example three months, two months and one month ahead. The paper says the way and timing of presentation are set by business custom between the trading companies and that there are many variations.
Mitsubishi Electric’s product page describes customer forecast information as “provisional quantity information that a manufacturer presents to a supplier,” and firm information as “a formal order from the manufacturer, with the delivery date fixed at the same time” (our translation).
On the flow in the Japanese automotive industry, an explainer article in MONOist (June 2021) says that a parts manufacturer’s production plan is based on the vehicle manufacturer’s monthly forecast quantities. It says the monthly forecast quantities for the next three months are usually communicated around the 20th. The next month’s quantity is almost firm, while the forecasts for two and three months ahead are likely to change. The article says that once a firm order is placed, delivery is split into daily lots or several lots per day. It adds that at Toyota Motor and others, a widely used mechanism treats the number of kanban cards removed from products as the firm order. However, this is a general explainer, and the timing of presentation differs by customer. The same article also notes that forecasts and sales plans are “a very contentious issue” between parts manufacturers and vehicle manufacturers.
How forecasts are received also differs by customer. On its product page for automotive parts manufacturers, NEC lists as a challenge receiving “customer forecasts and firm orders in formats that differ by OEM, through multiple channels such as EDI and Excel” (our translation). In Thai factories as well, the same challenge arises when the channel is split by customer between EDI, Excel attachments and downloads from a portal.
Let us also define the scope of this article. How to run the monthly meeting that matches demand and supply is covered in our article on S&OP implementation. AI that forecasts demand from your own shipment history and similar data plays a different role from the mechanism in this article, which receives and handles the forecasts issued by customers. For accuracy metrics and how to think about payback, see our article on demand forecasting AI. This article focuses on the rules for taking in customer forecasts and firm orders, keeping versions, measuring differences and feeding them into MRP and the production plan.
Customer Forecast Time Buckets: Firm, Material Procurement and Forecast
In Japanese, you sometimes see explanations that divide the forecast horizon into a “kakutei zone” (firm), “chosei zone” (adjustment) and “yosoku zone” (forecast). However, we could not confirm this three-zone naming in the body text of public documents or vendors’ public materials. In this article, we therefore use the following three as our own terms for this article.
- The period in which the customer takes responsibility up to fabrication (in this article, the “fabrication authorization period”)
- The period in which the customer takes responsibility up to material procurement (in this article, the “material authorization period”)
- The period that remains planning information only (in this article, the “forecast period”)
The names differ by company and by system, but the idea of dividing the horizon into periods and setting the scope of responsibility for each is seen in common across the companies’ materials.
| Source | Name used in public materials | Rough correspondence to this article’s three buckets (our interpretation) |
|---|---|---|
| ANSI X12 830 (practice of Astemo Americas, Adient guide) | Fabrication Authorization, Material Authorization, and planning for the rest. In FST02, C = Firm and D = Planning | Roughly corresponds to fabrication authorization, material authorization and forecast |
| UN/EDIFACT DELFOR (D96A, DE 4017) | 1 Firm, 2 Commitment for manufacturing and material, 3 Commitment for material, 4 Planning/forecast, and others | 2, 3 and 4 are close to fabrication authorization, material authorization and forecast respectively |
| SAP (purchasing-side scheduling agreement) | Firm zone (production go-ahead period), Trade-off zone (material go-ahead period) | A setting on the ordering side. Seen from the receiving side, close to fabrication authorization and material authorization |
| Oracle Release Management | Frozen fence, Firm fence, Forecast to OM fence, Forecast to PLN fence | Settings that change how received demand is handled according to the period |
| Infor LN | Frozen Zone + (limit on increases), Frozen Zone – (limit on decreases) | Holds the period in which changes are not accepted separately for increases and decreases |
There are two points to note. First, the description of SAP’s firm zone and trade-off zone comes from the purchasing side (scheduling agreements that a company issues to its own suppliers) in SAP’s S/4HANA purchasing course. In the materials we reviewed, we have not confirmed that the same setting exists as a sales-side function for a parts manufacturer receiving forecasts from customers. Second, the right-hand column of the table is our own interpretation, not a definition given by each company.
Customer Forecasts Delivered by EDI: 830, 862, DELFOR and VDA 4905/4984
The best-known customer forecast delivered by EDI is ANSI X12 830 (Planning Schedule with Release Capability), used in North America. The X12 standard preamble included in Adient’s implementation guide describes three uses of the 830. The first is a simple forecast. The second is a forecast with which the buyer authorizes the seller to commit resources such as labor and material. The third is a forecast that includes cumulative quantities and delivery patterns and is also used to release orders.
According to the supplier guide of Astemo Americas, the Americas arm of a Japanese Tier 1 (August 2025), the company’s 830 is a six-month forecast sent every Monday evening. The company explains that the 830 carries fabrication authorization and material authorization as cumulative quantities. These cover the requirements within the fabrication lead time and the material purchasing lead time respectively. The guide also states clearly that no shipments are authorized from the 830. Shipping instructions come in the 862 Shipping Schedule. The company positions the 862 as the weekly requirement that serves as the firm delivery instruction, and explains that it is issued in standard pack quantities.
UN/EDIFACT has a message called DELFOR that corresponds to the customer forecast. As shown in the table above, the SCC segment of DELFOR (D96A) has codes that distinguish firm, commitment for manufacturing and material, commitment for material, and planning (confirmed in the directory as reproduced by XEDI). VDA standards are also used in Europe. SEEBURGER explains that VDA 4984 is a planning schedule from customer to supplier based on EDIFACT DELFOR and replaces the older VDA 4905. The company also says that the older VDA 4905 does not include fabrication and material authorization information, but that many OEMs and Tier 1s still use 4905 or provide it in parallel with 4984. As a regional tendency, SEEBURGER explains that VDA is widely used in the EU, ANSI X12 in NAFTA, and EDIFACT in Asia and the EU.
What matters for customer forecast management here is that a new customer forecast replaces the previous one. Astemo Americas explains that each transmission of both the 830 and the 862 replaces the previous one, and SEEBURGER also explains that a new VDA 4984 message replaces the previous schedule. A release note for an old SAP release (R/3 3.0A) also states that the latest delivery schedule can replace all or part of the dates and quantities of the previous delivery schedule. It follows that unless the receiving side keeps the versions, no record remains of “when, in which version, and by how much it changed.” This is our inference from the companies’ descriptions.
In Japan, there is an industry network called JNX. SoftBank describes JNX as an industry-wide common network that connects industries, starting with the automotive industry. Note that JNX is a network and not the data format of the customer forecast itself. How to choose the connection method, line and translation with trading partners is covered in detail in our article on manufacturing EDI.
The Functions a Customer Forecast Management System Needs
Let us translate the discussion so far into system functions. Reading the companies’ product descriptions and ERP help, the functions related to customer forecast management can be organized broadly into the following eight (the organization is our own).
| Function | What it does | Related rule |
|---|---|---|
| Import | Converts customer forecasts from EDI, Excel and portals into a common format using per-customer mapping | Prerequisite for everything |
| Version storage | Stores each received version without overwriting, by receipt time and issue order | Rule 1 (versions) |
| Comparison | Shows the difference between any two versions, or between a forecast and the firm order, by part number and period | Rule 1 (versions) |
| Applying time buckets | Applies each customer’s fabrication authorization, material authorization and forecast periods | Rule 2 (scope of responsibility) |
| Cumulative reconciliation | Matches the customer’s cumulative quantity against your own cumulative shipments | Rules 2 and 3 |
| MRP integration | Controls which range is passed to MRP, at what level of aggregation and with what rounding | Rule 3 (feeding) |
| Exception alerts | Notifies only changes that exceed thresholds, violations of the time buckets and cumulative discrepancies | Rules 1 and 3 |
| Dashboard | Shows, by customer and by part number, how far the forecast issued a given number of months ahead missed | Result of Rule 1 |
Screens and reports can be refined later. But if the rules in the right-hand column of the table have not been decided, you cannot enter setting values for any of these functions. From the next section, we look at Rules 1, 2 and 3 in turn.
Rule 1: Saving and Comparing Versions
The first rule is to keep each version you receive and make it possible to compare versions.
According to the user guide for Release Management in Oracle E-Business Suite (R12.1), the product’s Demand Processor validates a received schedule and then “archives” it and keeps it as history, before reconciling the new demand against the old demand. The company explains that the “Net Change Report” compares any two schedules and shows the increases and decreases, and that it can also output only the items that exceed a tolerance percentage.
Infor LN help (LN 10.8) explains that a new version of the forecast sent by the customer is compared with the previous version to check for violations of the frozen zone. SAP help explains that Demand Waterfall Analysis in SAP APO compares snapshots of the forecast taken at different points in time, shows them in a waterfall chart, and indicates deviations from actuals and threshold violations.
Among Japanese products, Mitsubishi Electric, introducing its “Addon Solution Customer Forecast and Firm Order System,” lists as a challenge that “when the customer forecast is replaced, the differences are checked by hand and reflected in the production plan, which takes time and carries a risk of errors” (our translation). As a function, it lists a “forecast and firm order comparison inquiry” that shows forecast and firm order quantities in a calendar format along the horizontal axis. The company also explains that the production management package it used as a base had no function for replacing forecast and firm data, so it developed one individually. It also says that many companies manage customer forecasts separately, in Excel or similar tools outside their core system. This is an example showing that the gap can also be on the system side.
An easily overlooked point in version storage is the processing order when several versions arrive on the same day. Oracle’s guide gives an example in which two replacement schedules (issued at 7:00 and 9:00 on October 1) arrive on the same day. It shows that unless they are processed in issue order, the netting is not correct. Because the order of receipt and the order of issue may differ, you need to decide as a rule which timestamp to sort by.
Here is what to decide for version storage.
- What counts as one version (the combination of customer, ship-to, part number and issue date and time)
- How long to keep versions (for the accuracy analysis described later, having the past 6 to 12 months makes the picture clearer)
- What to compare against (the immediately preceding version, the version from n months ago, or the firm order)
- The processing order when several versions arrive on the same day
When the firm order itself changes later (quantity change, delivery date change or cancellation), version control and impact assessment are easier to organize if they are managed in a flow separate from the customer forecast. This is covered in our article on customer order change control.
Measuring Forecast vs Firm Order Variance: How Far Did the Forecast from n Months Ahead Miss?
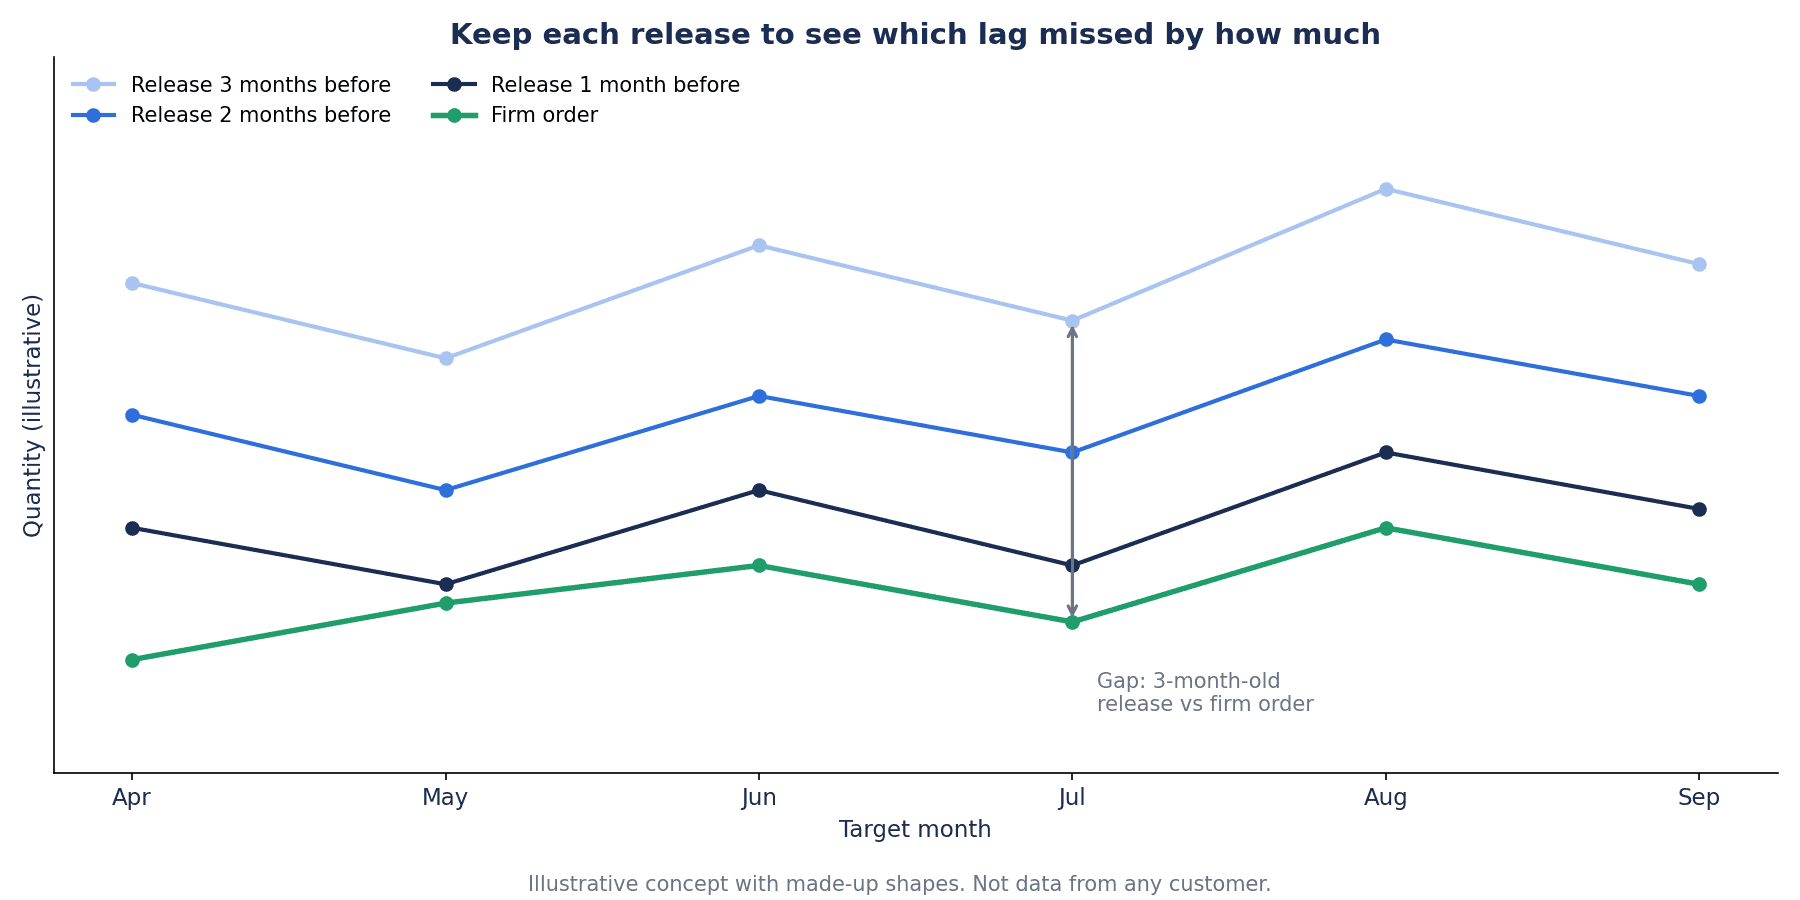
Only once versions are kept can you count “how far the forecast issued n months ahead missed.”
Ueno’s paper calls the difference between the forecast quantity and the firm order quantity “bure” (deviation), and defines the deviation from the forecast i periods ahead as the firm order quantity minus the quantity of the forecast issued i periods ahead. If forecasts start three months ahead, there is a separate deviation for each of the forecasts issued three months, two months and one month ahead. The paper notes that the deviation is often expressed as a distribution. It shows examples where the mean is almost 0 and the distribution is symmetric, and examples where positive and negative deviations are roughly half and half. It also shows examples where the distribution of the deviation is obtained by statistical processing of past data.
Following this idea, there are two things to look at.
- Bias: whether the mean of the deviation is away from 0. For example, if the forecast issued two months ahead always comes in high, there is a bias. The forecasting textbook by Hyndman and colleagues also explains that if the residuals have a mean other than zero, the forecasts are biased.
- Dispersion: how widely the deviation is spread. Look at it separately by how many months ahead the forecast was issued.
Mean absolute percentage error (MAPE) is often used as an accuracy metric. SAP’s APO help explains that forecast accuracy is calculated from MAPE. However, the same textbook explains that MAPE has drawbacks. It cannot be calculated when the actual value is 0, and it takes extreme values when the actual is close to 0. It also puts a heavier penalty on negative errors. With customer forecasts, there can be part numbers or weeks where the firm quantity becomes 0 because of a phase-out or a delivery pushed back (slide). In this article, we therefore suggest looking first at the deviation (the quantity difference) and the bias, and using MAPE alongside them for part numbers whose firm quantities are large enough.
On order fluctuation, a 1997 paper by Lee, Padmanabhan and Whang showed that information passed along as orders tends to be distorted, that the variance of orders can be larger than the variance of sales, and that this distortion tends to grow as it moves upstream (the bullwhip effect). In a commentary in MIT Sloan Management Review, the same authors list symptoms such as excess inventory, frequent revisions of plans, and high correction costs from premium freight and overtime.
We could not find statistics showing an industry-wide average of how much customer forecasts fluctuate. Mitsubishi Electric says in its product introduction that a customer forecast can sometimes increase or decrease by close to 20% before it becomes firm. This is the company’s description, not a general average. The starting point is to actually count it for your own customers and part numbers.
The figure below is a fictitious example showing the idea of a waterfall view that lines up each version of the forecast against the firm order. It is unrelated to the figures in the estimate in this article.
Rule 2: Agree with the Customer on the Scope of Responsibility for Fabrication and Material Procurement
The second rule is to agree with the customer up to which period you may manufacture, and up to which period you may only procure materials.
ANSI X12 830 has a segment called ATH (Resource Authorization) that authorizes the commitment of resources. In a note on ATH, Adient’s 830 implementation guide states that it is essential that negotiations establishing the financial commitment have taken place in advance and that both buyer and seller have agreed. The ATH codes include FI (finished goods, including labor, material and overhead) and MT (material).
Astemo Americas explains that for parts within the fabrication authorization period it takes responsibility for purchase, and that within the material authorization period it authorizes the procurement of materials. On the other hand, no shipments are authorized from the 830. In other words, even when the extent of the customer’s responsibility is shown explicitly as an EDI data element, its content presupposes a prior agreement.
The ERP side has the same structure. SAP’s S/4HANA purchasing course explains that in a purchasing-side scheduling agreement, the firm zone and trade-off zone can be set in calendar days, and that schedule lines within the firm zone can be regarded as equivalent to firm orders. It also says that the firm zone should be determined in consultation with the supplier. To repeat, this is a setting on the ordering side. Infor LN help describes the frozen zone as a period that the customer and supplier determine in a terms and conditions agreement. It shows a setting example in which decreases must be notified 14 days in advance and increases 21 days in advance. These day counts are a setting example, not recommended values. The company also notes that LN does not strictly enforce these limits and that they can be overridden manually.
Let us also sort out the relationship with your internal “planning freeze window.” The period in which you do not move the plan internally is decided from your own changeover and material constraints. If the scope of the customer’s responsibility is shorter than your internal freeze window, you end up absorbing customer changes inside the freeze window. Comparing the two lengths side by side shows where strain will arise. How to set the freeze window and approve changes is covered in our article on the production plan freeze window.
For items with long material lead times, you may have to order materials earlier than the material authorization period covers, that is, for requirements still outside it. In that case, you are taking the risk yourself and procuring outside the customer’s authorization. Keeping a record of who approved each item gives you material for later discussions with the customer. For how to manage early procurement, see our article on early procurement of long-lead parts.
The items to agree on are as follows.
- The fabrication authorization and material authorization periods for each customer and part number group (calendar days or working days)
- How materials and work in process left over when the forecast drops are handled (buyback, allocation to the following months, discussion procedure)
- The deadline and procedure for claims when a part is phased out
- Who enters the agreed content into the system, and who approves changes
What Japanese Trade Rules Say About Customer Forecasts
In Japan, laws and guidelines say several things about the gap between the customer forecast and the actual order. These are Japanese laws and Japanese guidelines. Whether they apply as is to transactions between local subsidiaries in Thailand depends on the contract and the relationship between the parties, so this article does not assert it. Individual transactions need to be checked by legal counsel.
First, the name. According to the Japan Fair Trade Commission (JFTC), the Subcontract Act (Shitauke-ho) was amended and became, in Japanese, the Act on the Prevention of Delays in Payment of Consideration to Small and Medium-sized Entrusted Business Operators Related to Manufacturing Entrustment, etc. (our translation, abbreviated as the Toriteki Act). It took effect on January 1, 2026. The terms also changed. The former “parent business operator” became the “entrusting business operator,” and the former “subcontractor” became the “small and medium-sized entrusted business operator.”
The Toriteki Act prohibits refusing to accept delivery from a small and medium-sized entrusted business operator when that operator is not at fault. The textbook by the JFTC and the Small and Medium Enterprise Agency explains that this in principle also includes not accepting delivery on the original delivery date because the order was cancelled or the delivery date was postponed. It gives cases of refusal to accept delivery on the grounds of a change in the production plan.
On the other hand, Q72 in the same textbook addresses the case where the operator produced goods on speculation without a formal order. It says that refusing to accept goods that were never ordered is not a problem. However, it also says that having the operator produce a certain quantity based on a verbal instruction, without stating it in writing or by similar means even though it was a formal order, and then refusing to accept delivery, does constitute a refusal to accept delivery.
On the gap between the customer forecast and the actual order itself, the Promotion Standards (Shinko Kijun) provide as follows. If, after a planned order quantity has been presented, a large gap arises between it and the actual order quantity without a reasonable reason, the entrusting business operator is to consult thoroughly and take measures such as buying back the resulting surplus product inventory and leftover materials. The Promotion Standards are positioned as “general standards to be followed” by entrusting business operators and small and medium-sized entrusted business operators. The Ministry of Economy, Trade and Industry’s (METI) Guidelines for Proper Transactions in the Automobile Industry also list, as a “desirable business practice,” responding to the gap between the planned order quantity (customer forecast) and the actual order quantity. For continuously ordered items, they give the example of allocating the quantity to be bought back to the following month’s purchases. These descriptions have a different status from the conduct prohibited by the Toriteki Act (the categories of violation).
The same guidelines also touch on overseas transactions. They say it is desirable for vehicle manufacturers and others to act with the principles in mind while taking local laws and business practices into account. As an example of best practice, they introduce holding meetings that explain the annual vehicle production plan, in addition to the usual parts forecast information, for suppliers producing locally to supply overseas sites.
Here is what we can draw from this, set out as our own inference. A customer forecast alone may not constitute an “order.” Without an agreement, how goods made or materials bought on the basis of a forecast are handled will depend on negotiation. That is why we think there is value in agreeing in writing with the customer how far you may manufacture and how far you may procure materials.
Rule 3: Rules for Feeding MRP and the Production Plan
The third rule is how to feed the customer forecasts you receive into MRP and the production plan. This is where the companies’ products have the most detailed settings. All the figures below are setting examples found in each company’s help, not recommended values.
Which range to pass to MRP. SAP’s S/4HANA purchasing course explains that in a purchasing-side scheduling agreement, you choose the range that is binding on MRP from “only schedule lines from the trade-off zone onward,” “only schedule lines from the firm zone onward” and “all schedule lines.” The receiving side, too, needs to decide how much of the fabrication authorization, material authorization and forecast periods to treat as requirements, and from where to keep them as reference values only.
What level of aggregation. The same SAP course shows a setting example for aggregation. Days 0 to 10 are not aggregated. Days 10 to 30 are aggregated daily. Days 30 to 60 are aggregated monthly. The idea is to pass the near term in fine detail and the far term in coarse buckets.
How large a change moves the plan. The SAP course shows a tolerance example. A forecast delivery schedule is created only when the total has increased by more than 2% or decreased by more than 5% compared with the previous one. Oracle’s guide explains that positive and negative demand tolerances can be set by customer, ship-to and item. When the tolerance is exceeded, the demand is processed and a warning is output in the exception report. If you do not set thresholds, the plan tends to move even on small changes, and the burden on the shop floor increases.
How to handle changes inside the fence. According to Oracle’s guide, changes within the frozen fence are not applied to the sales order, and a warning is issued. The guide explains that when “Roll Forward Frozen Fence” is enabled, only the increase within the fence is moved to the day just after the fence, while decreases only generate a warning.
How to round. Oracle explains that it rounds up to the standard pack quantity (Standard Pack Rounding). Astemo Americas also explains that the 862 is issued in standard pack quantities. When you order materials from your own suppliers, further rounding by the supplier’s minimum order quantity and order multiple comes in. How to design the order and units of this rounding is covered in our article on MOQ control.
How to split monthly or weekly quantities into days. In product information for FutureStage for the automotive parts industry (posted on MarkLines, updated October 2013), Hitachi Systems explains that conversion mappings for import files of EDI customer forecasts and order data, and allocation patterns for production order quantities, can be registered. It also explains that, for the trial MRP results, people adjust the final planned quantities and delivery dates with reference to past firm information. Mitsubishi Electric likewise lists as a challenge that splitting the order quantity for a period into working days is done by hand based on experience and takes effort.
In summary, the rules for feeding MRP decide the following.
| Item to decide | Setting examples in the sources |
|---|---|
| Range passed to MRP | Only from the trade-off zone onward, only from the firm zone onward, or all lines (SAP, purchasing side) |
| Level of aggregation | No aggregation for days 0 to 10, daily for days 10 to 30, monthly for days 30 to 60 (SAP setting example) |
| Change threshold | Created only on an increase of more than 2% or a decrease of more than 5% (SAP setting example), warning on positive and negative tolerances (Oracle) |
| Changes inside the fence | Not applied and a warning issued, or only the increase moved to just after the fence (Oracle) |
| Rounding | Rounding up to the standard pack quantity (Oracle), 862 issued in standard pack quantities (Astemo) |
| Allocation | Registration of allocation patterns for production order quantities (Hitachi Systems) |
However carefully you set the feeding rules, the results go wrong if the item master that MRP uses (lead times, pack quantities, bill of materials) is out of date. For how to keep master data fresh, see our article on MRP systems.
Reconciling Cumulative Quantities (CUM) and Handling Phase-Out Parts
In customer forecasts in the North American and European automotive industries, the idea of managing quantities cumulatively (CUM) comes up often. A release note for an old SAP release (R/3 3.0A) describes the cumulative quantity as an indispensable tool for getting an accurate picture of continuously changing business. It says the system manages quantities such as the customer’s cumulative received quantity, cumulative delivered quantity and cumulative released quantity. The same note explains that cumulative quantities are reset to zero at the end of the fiscal year. It adds that the OEM communicates the fiscal year end only through a change in the cumulative received quantity, and that the timing differs from OEM to OEM.
Oracle’s guide explains that CUM rules are defined for each customer, and that the customer’s CUM is compared with the system’s CUM and discrepancies are output in an exception report. It also says that quantities in transit are subtracted from the customer’s CUM, and that a new CUM Key is created when the customer resets its CUM.
Astemo Americas explains that its cumulative received quantity does not include quantities in transit, so the supplier is responsible for comparing it with its own cumulative shipped quantity and subtracting the quantity in transit. It says that it is essential to track cumulative quantities and to resolve discrepancies and disputes as they arise, and it sets a maximum of 48 hours for resolving discrepancies.
This is also where you decide how to handle phase-out parts. Astemo Americas explains that phase-out parts are shown on the 830 as Balance out. If a supplier believes the company is responsible for dead stock, the guide asks the supplier to submit a claim within 30 days of the phase-out. Because there is a deadline for claims, when you receive a phase-out notice you need to count the remaining materials, work in process and finished goods by part number. You also need records that show whether they were procured within the authorization period. This is where version storage (Rule 1) and the agreement on the scope of responsibility (Rule 2) pay off.
How to take stock of and dispose of materials and work in process left over from forecast drops or phase-outs is covered in our article on excess inventory reduction.
How to Import Formats That Differ by Customer
In implementing a customer forecast management system, import turns out to take a surprising amount of effort. NEC explains that its system automatically imports customer forecast and firm order information that differs by OEM, manages it centrally, and performs order management including replacement processing. Hitachi Systems also explains that its system imports EDI customer forecasts and firm orders that differ by customer, and that conversion mappings for the import files can be registered.
Here is what to decide when designing the import.
- Per-customer mapping: the customer’s part number and your part number, ship-to codes, units of quantity, and the meaning of dates (delivery date or ship date)
- Version identification: for EDI, the issue date and time or version number, and for Excel, the file name or a date in the sheet. Which of these to use as the version key
- Replace or add: whether a new forecast replaces the whole previous version or only part of the horizon
- Reading the buckets: how to read firm, fabrication authorization, material authorization and forecast from EDI codes (FST02 in the 830, DE 4017 in DELFOR) or Excel columns
- Handling import errors: who is notified, and processing is stopped, when a part number not in the master arrives, or when a version arrives with an issue date and time older than the previous version
With customer forecasts that arrive in Excel, the import stops when the customer changes the format. Operations become more stable if you decide in advance who notices a format change and who fixes the mapping. With forecasts downloaded from a portal, a forgotten download leaves a missing version, so decide who retrieves them and at what time.
So far we have discussed the side that receives forecasts from customers. The same ideas of version storage and scope of responsibility also apply when your company issues forecasts to its own suppliers, but there the mechanism sits on the purchasing side. Exchanges of orders and delivery date confirmations with suppliers are covered in our article on implementing a supplier portal.
Functions Confirmed in Products and ERPs
The table lists customer forecast related functions, within the range we could confirm in public materials. This is not a recommendation or a ranking. Cells we could not confirm are marked “not confirmed in public materials.”
| Product or ERP | Main target | Customer forecast related functions confirmed in public materials |
|---|---|---|
| SAP (sales side, help for old releases) | Scheduling agreements for component suppliers | Forecast delivery schedules and JIT delivery schedules, management of cumulative quantities and their fiscal year end reset (R/3 3.0A release note, 4.6C help). Schedule line categories control whether a line is planning-relevant or shipping-relevant. Equivalent functions in the current release not confirmed in public materials |
| SAP (purchasing side, S/4HANA purchasing course) | Scheduling agreements from your company to suppliers | Firm zone and trade-off zone, the range binding on MRP, aggregation and tolerance settings, tracking of transmission history through release documentation |
| SAP APO Demand Waterfall Analysis | Comparison of forecast snapshots | Comparison of forecasts from different points in time, waterfall display, display of threshold violations |
| Oracle E-Business Suite Release Management (R12.1) | Schedules received from customers | Archiving, Net Change Report, frozen, firm and forecast fences, tolerances, rounding to standard packs, CUM reconciliation |
| Infor LN (10.8) | Forecasts shared between customer and supplier under VMI | Comparison with the previous version, separate frozen zones for increases and decreases |
| Mitsubishi Electric Addon Solution Customer Forecast and Firm Order System | Extension of Factory-ONE Dennou Koubou MF | Import and replacement of customer forecasts, import of firm information, forecast and firm order comparison inquiry (horizontal calendar), use in analyzing forecast accuracy |
| NEC EXPLANNER/Jx for automotive parts manufacturers | Automotive parts manufacturers | Automatic import and central management of customer forecasts and firm orders by OEM, replacement processing, linked planning of products, intermediate items and materials according to forecast changes, control of advance production of intermediate items and allocation on firming |
| Hitachi Systems FutureStage for the automotive parts industry | Automotive parts manufacturers | Import of EDI customer forecasts and firm orders by customer, comparison of differences between forecast and firm quantities, registration of conversion mappings and allocation patterns (product information updated October 2013) |
As the table shows, version storage and comparison, time buckets, and MRP feeding rules appear as configuration settings in some form in many products. Whichever product you choose, setting values cannot be entered unless you have decided each customer’s periods, thresholds and rounding units. This is why this article recommends deciding the rules first.
Customer forecast management is one part of the overall production management system. The overall criteria and steps for choosing a production management system for an automotive parts factory are set out in our article on production management systems for automotive parts.
RFP Requirements, PoC and Acceptance Test Criteria
When requesting proposals from vendors, do not stop at whether a function exists. Write concretely whether Rules 1, 2 and 3 in this article can be configured.
| Requirement | What to write in the RFP | How to check in the acceptance test |
|---|---|---|
| Import formats and per-customer mapping | Each customer’s format (EDI 830, DELFOR, Excel, portal) and conversion of part numbers, units and dates | Import past real data for each customer and check that record counts and total quantities match the source data |
| Version retention period and comparison screen | How many months of versions to keep, and a screen comparing any two versions and the firm order | Check that the difference between two specified versions matches a hand calculation |
| Processing order for several versions on the same day | Processing in order of issue date and time | Import two versions from the same day in reverse order and check that the result is the same as processing in issue order |
| Per-customer time bucket settings | Fabrication authorization, material authorization and forecast periods set by customer and part number group | Check that the bucket switches correctly on the boundary dates |
| Range and aggregation passed to MRP | Which buckets are passed, and the aggregation level for each period | Check that MRP requirements are created with the configured range and level of aggregation |
| Change thresholds and exception alerts | Separate thresholds for increases and decreases, notification recipients | Check that only changes exceeding the threshold are notified and changes below it are not |
| Rounding and allocation | Standard pack quantities, allocation patterns | With a forecast containing fractions, check that the rounding and allocation results match a hand calculation |
| CUM reconciliation | Comparison of customer CUM and your CUM, subtraction of in-transit quantities, reset | Check that the discrepancy is shown correctly in an example that includes in-transit quantities |
| Audit log | History of imports, setting changes and manual corrections | Check that you can trace who changed what and when |
| Authorization | Separation of authority for setting changes and manual corrections | Check that users without authority cannot change settings |
In the PoC and acceptance test, you can use the method of replaying the past three months of customer forecasts. Re-import the versions that actually arrived in the past, in the order they arrived. Then check that the difference report matches a hand calculation, that only changes exceeding the threshold are notified, and that the requirements passed to MRP can be explained against the decisions made at the time. This test presupposes that past versions have been kept. If you start saving incoming forecast files without overwriting them even before you decide to implement, they become material for the test.
On cost, within the scope of our research, we found no public prices on the customer forecast related product pages of Mitsubishi Electric, NEC and Hitachi Systems. We also could not confirm that prices for the customer forecast related functions of SAP, Oracle and Infor are published. For the cloud production management system of the Japan Metal Stamping Association (JMSA), there is an announced price, as of its announcement in May 2015, starting from 25,500 yen per month (excluding tax) for three user licenses. This was the price at that announcement, and we have not confirmed the current price. For JNX, SoftBank publishes a one-time fee of 6,000 yen and a monthly fee of 2,800 yen (excluding tax, for one user and one application) for its JNX personal authentication LA service. However, these are fees for a service aimed at Japan, and we have not confirmed whether it can be used in Thailand or what it would cost there. Quotes need to be obtained individually after presenting the RFP requirements.
Cost and Benefit Model Estimate (Hypothetical Figures)
The figures from here on are hypothetical figures for this article. They are not data from a real factory.
The assumed factory is a Japanese-affiliated automotive parts stamping and welding plant in Thailand. Customer forecasts arrive from five customers by EDI and Excel, and the production control staff correct the plan in Excel while overwriting each version.
The baseline annual losses are the following two. Drops and rises in the forecast are counted as separate events, and the same fluctuation is not counted twice.
| Item | Amount (THB per year) |
|---|---|
| Disposal and write-downs of materials and work in process left over from forecast drops | 360,000 |
| Emergency responses to forecast rises (weekend overtime, premium freight): 16 times per year x 30,000 THB | 480,000 |
| Total | 840,000 |
The countermeasures are customer forecast import with version storage and comparison, agreement on per-customer time buckets and the scope of material procurement, and MRP feeding rules with exception alerts.
| Item | Amount (THB) |
|---|---|
| Initial cost: import, version control, difference display | 450,000 |
| Initial cost: ERP and MRP integration | 250,000 |
| Initial cost: organizing per-customer rules and agreement documents | 100,000 |
| Initial cost: training, acceptance testing | 100,000 |
| Total initial cost | 900,000 |
| Annual operating cost | 120,000 (per year) |
For the benefit, the base case assumes that half (50%) of the losses above can be eliminated.
| Case | Benefit (THB per year) | Operating cost (THB per year) | Net benefit (THB per year) | Payback period |
|---|---|---|---|---|
| Base case (50% of losses eliminated) | 840,000 x 50% = 420,000 | 120,000 | 420,000 – 120,000 = 300,000 | 900,000 / 300,000 = 3.0 years |
| Sensitivity (only 25% of losses eliminated) | 840,000 x 25% = 210,000 | 120,000 | 210,000 – 120,000 = 90,000 | 900,000 / 90,000 = 10.0 years |
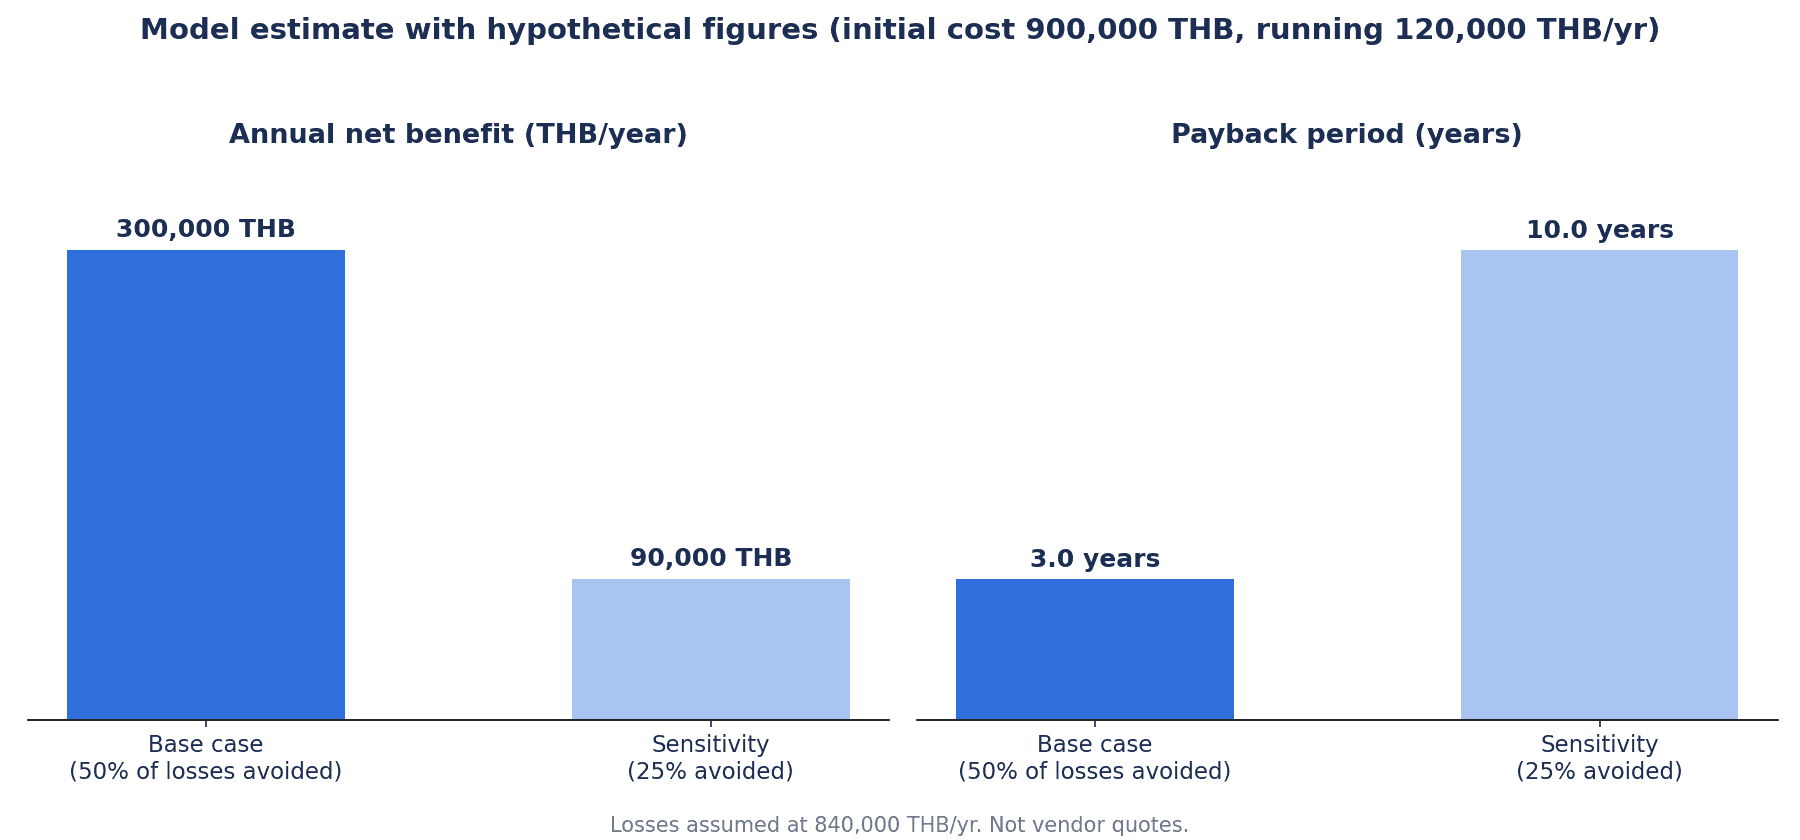
Here is how to read this estimate. The benefit percentages (50% and 25%) are assumptions. In the base case, the net benefit is 300,000 THB per year and the payback period is 3.0 years. If the benefit is only 25%, the net benefit falls to 90,000 THB per year, and payback takes 10.0 years. When the benefit percentage is halved, the payback period becomes more than three times as long.
What is most likely to swing the benefit is the agreement under Rule 2, that is, whether you can agree with the customer on the scope of material procurement. If you cannot reach that agreement with the customer, introducing a system will not change the situation in which materials are left over when the forecast drops. Even if version storage and comparison let you see the differences earlier, you would have no basis for deciding how to handle those materials.
We therefore suggest that, before deciding to implement, you line up the past 6 to 12 months of forecast versions and firm orders, and count how far the forecast issued n months ahead missed and how many emergency responses occurred. Then redo the estimate with your own figures. It is also safer not to count the benefit until you have confirmed, through the acceptance test and three months of operation, that difference tracking and exception alerts are working.
Frequently Asked Questions
What is the difference between a customer forecast and a firm order?
A customer forecast is order schedule information that the customer presents ahead of production, and a firm order is a formal order with a fixed delivery date and quantity. Ueno’s paper explains that the firm order is not necessarily the same as the forecast, so the forecast is a reference value for production. In EDI, there are practices like that of Astemo Americas, which does not authorize shipments from the 830 (forecast) and issues firm delivery instructions in the 862.
What can be done when customer forecasts fluctuate heavily?
First, keep the versions and count, by customer and by part number, how far the forecast issued n months ahead missed. Then agree with the customer on the scope of responsibility for fabrication and material procurement, and decide the range passed to MRP and the change thresholds. Japan’s Guidelines for Proper Transactions in the Automobile Industry list responding to the gap between the forecast and the actual order as a desirable business practice. However, it cannot be asserted that they apply as is to transactions in Thailand, so in this article we think there is value in putting the agreement in writing.
How far ahead can materials be procured against a customer forecast?
The material authorization period agreed with the customer is the guide. X12 830 has material authorization, and DELFOR has a code indicating commitment for material. Adient’s guide says it is essential that the scope of financial commitment has been agreed in advance. If there is no agreement, or if the material lead time is longer than the authorization period, you are procuring at your own risk, so keep a record of who approved it.
How is customer forecast accuracy measured?
One method is to take the “deviation,” which is the firm order minus the forecast issued n months ahead, split it by how many months ahead the forecast was issued, and look at the bias (mean) and the dispersion. MAPE is also used, but it cannot be calculated for part numbers or weeks where the firm quantity is 0. It is easier to handle if you look at the deviation and bias first and use MAPE only alongside them.
What is different about customer forecasts delivered by EDI?
EDI customer forecasts can carry the firm, fabrication authorization, material authorization and forecast buckets as data elements, and new messages are described as replacing the previous schedule. Because they are replaced, no history of changes remains unless the receiving side saves the versions. As a regional tendency, SEEBURGER explains that VDA is widely used in the EU, ANSI X12 in NAFTA, and EDIFACT in Asia and the EU.
Is Excel not enough for customer forecast management?
While you have few customers and few part numbers, you can keep versions on separate sheets in Excel and calculate the differences. However, Mitsubishi Electric lists as a challenge the time and risk of errors involved in checking differences by hand when the forecast is replaced. Once formats differ by customer, several versions arrive on the same day, or you want MRP feeding and exception alerts to be automatic, holding this in a system starts to pay off. In either case, Rules 1, 2 and 3 are needed first.
How much does a customer forecast management system cost?
Within the scope of our research, we could not confirm public prices for customer forecast management products or for the customer forecast related functions of ERPs. Cost is likely to vary with the number of customers and formats, the scope of ERP integration, the version retention period and so on. The estimate in this article assumed an initial cost of 900,000 THB and an operating cost of 120,000 THB per year, but these are hypothetical figures. We recommend presenting your requirements in an RFP and obtaining quotes.
Summary
- In this article, we take the view that the three things to decide first when implementing a customer forecast management system are (1) saving and comparing versions, (2) the scope of responsibility for firm production and material procurement, and (3) the rules for feeding MRP and the production plan.
- The companies explain that in EDI customer forecasts, a new version replaces the previous one. Unless the receiving side keeps the versions, no history of changes remains.
- The names for the “firm, material procurement and forecast” time buckets differ by company and system. Check each company’s terms, such as fabrication and material authorization in X12 830, the DELFOR codes, and SAP’s (purchasing-side) firm zone and trade-off zone, and align them with the customer.
- Even when there are EDI data elements or ERP settings, the content of the scope of responsibility for fabrication and material procurement presupposes a prior agreement. The provisions of Japan’s Toriteki Act, the Promotion Standards and industry guidelines are Japanese laws and guidelines, and their application to transactions in Thailand needs to be checked by legal counsel.
- For feeding MRP, decide the range passed, the level of aggregation, the change thresholds, rounding and allocation. The figures in each company’s help are setting examples.
- Look at customer forecast accuracy by splitting how far the forecast issued n months ahead missed into bias and dispersion.
- In the estimate (hypothetical figures), eliminating 50% of losses gives a payback of 3.0 years. If only 25% is eliminated, payback takes 10.0 years. What is most likely to swing the benefit is the agreement on the scope of material procurement.
- Starting before implementation by lining up and counting the past 6 to 12 months of forecast versions and firm orders makes both the requirements and the expected benefit clearer.
TOMAS TECH can help even at an early stage of your study, such as deciding which customers’ forecasts to start keeping versions of, how to proceed with matching past forecasts against firm orders, and how to organize the scope of material procurement with customers. Please contact us here.
References
- Japan Fair Trade Commission and Small and Medium Enterprise Agency, “Textbook on the Act on Proper Transactions with Small and Medium-sized Entrusted Business Operators: From the Subcontract Act to the Toriteki Act,” November 2025 (Japanese) https://www.jftc.go.jp/toriteki/r7text.pdf
- Japan Fair Trade Commission, “About the Toriteki Act” (Japanese) https://www.jftc.go.jp/partnership_package/index.html
- Ministry of Economy, Trade and Industry, “Guidelines for Proper Transactions in the Automobile Industry,” last revised December 2025 (Japanese) https://www.chusho.meti.go.jp/keiei/torihiki/guideline/02_automobile.pdf
- MONOist, “Why Are Automakers’ Production Adjustments Drawing Attention? The Production Plan That Drives Factory Operations,” June 4, 2021 (1/2) (Japanese) https://monoist.itmedia.co.jp/mn/articles/2106/04/news029.html
- MONOist, same article (2/2) (Japanese) https://monoist.itmedia.co.jp/mn/articles/2106/04/news029_2.html
- Mitsubishi Electric, “Addon Solution Customer Forecast and Firm Order System,” March 2022 (Japanese) https://www.mitsubishielectric.co.jp/it/productreport/case-c6/
- NEC, “Production Management System EXPLANNER/Jx for Automotive Parts Manufacturers” (Japanese) https://jpn.nec.com/soft/explanner/explanner-jx/automobile-parts.html
- Infor, “Forecast frozen zones (LN 10.8)” https://docs.infor.com/ln/10.8/en-us/lnolh/cpordplanug/cpom000475.html
- Nobuyuki Ueno, “Naiji Theory: Systematizing the Use of Advance Demand Forecasting Information in an Uncertain Demand Environment,” Hiroshima University of Economics Economic Research 43(3), March 2021 (Japanese) https://hue.repo.nii.ac.jp/record/421/files/keizai2021430302.pdf
- Adient, “EDI Implementation Guidelines ANSI X12 830 V3020” https://www.adient.com/wp-content/uploads/2021/11/AdientEDI-Implementation-Guide-ANSI-X12-830-Updated-Logo.pdf
- Astemo Americas, “Section 3 Production Control / Delivery (Issue 10),” August 20, 2025 https://www.am.astemo.com/sites/default/files/2025-09/Section%2003%20-%20Production%20Control%20-%20Issue%2010.pdf
- Derby Fabricating Solutions, “830 Planning Schedule v04010 implementation guide” https://derbyfab.com/wp-content/uploads/2025/09/Derby_830_v04010.pdf
- XEDI, “UN/EDIFACT D96A DELFOR Message” https://xedi.com/resources/edifact/D96A/delfor
- SEEBURGER, “VDA 4984 EDI Planning Schedule” https://seeburger.com/info/vda-4984-edi-planning-schedule
- SEEBURGER, “What Is a VDA 4905 Message?” https://www.seeburger.com/info/vda-4905-message/
- GEFEG, “Training VDA message 4984 T2 Global DELFOR” https://www.gefeg.com/wp-content/uploads/2024/01/Training-VDA-message-4984-T2-Global-DELFOR-GEFEG.pdf
- SAP Learning, “Creating Scheduling Agreements with Release Documentation (Purchasing in SAP S/4HANA)” https://learning.sap.com/courses/purchasing-in-sap-s-4hana/creating-scheduling-agreements-with-release-documentation
- SAP Help, “Sales: Scheduling Agreement Processing for the Component Supplier Industry (Release Notes 3.0A, old release)” https://help.sap.com/saphelp_46c/helpdata/en/a2/613275e24bd111950d0060b03c6b76/content.htm
- SAP Help, “Schedule Line Categories (SD-SLS-OA)” https://help.sap.com/saphelp_globext607_10/helpdata/en/93/743a15546011d1a7020000e829fd11/content.htm
- SAP Help, “Scheduling Agreements (Sales SD-SLS, 4.6C, old release)” https://help.sap.com/saphelp_46c/helpdata/en/33/4361299d7a11d194e200a0c9306794/content.htm
- Oracle, “Oracle Release Management Demand Processor (User’s Guide R12.1)” https://docs.oracle.com/cd/E18727-01/doc.121/e16352/T414214T414225.htm
- Oracle, “CUM Workbench” https://docs.oracle.com/cd/E18727-01/doc.121/e16352/T414214T414221.htm
- Oracle, “Reports and Processes” https://docs.oracle.com/cd/E18727-01/doc.121/e16352/T414214T414222.htm
- Lee, Padmanabhan, Whang, “Information Distortion in a Supply Chain: The Bullwhip Effect,” Management Science 43(4), 1997 (Crossref bibliographic record) https://api.crossref.org/works/10.1287/mnsc.43.4.546
- MIT Sloan Management Review, “The Bullwhip Effect in Supply Chains,” April 15, 1997 https://sloanreview.mit.edu/article/the-bullwhip-effect-in-supply-chains/
- Hyndman, Athanasopoulos, “Forecasting: Principles and Practice (3rd ed), 5.8 Evaluating point forecast accuracy” https://otexts.com/fpp3/accuracy.html
- SAP Help, “Demand Waterfall Analysis” https://help.sap.com/fiori_bs2013/helpdata/en/bc/174b5382c6e447e10000000a441470/content.htm
- MarkLines, “August vehicle production in Thailand up 10.9%; sales up 25.6%,” September 28, 2026 https://www.marklines.com/en/news/351560
- Xinhua, “Thailand’s auto production surges 10.93 pct in August,” September 28, 2026 https://english.news.cn/asiapacific/20260928/52ddb0e5283d4c1b867cab6683e58d87/c.html
- Nation Thailand, “Thailand cuts 2026 car output target as exports weaken,” August 1, 2026 https://www.nationthailand.com/business/manufacturing/40069285
- Nation Thailand, “Thailand EV investment tops 137bn baht as BOI targets ASEAN hub,” July 3, 2026 https://www.nationthailand.com/business/automobile/40068192
- MarkLines, “Automotive Industry News and Content List (October 1, 2026)” https://www.marklines.com/en/e-newsletter/latest-contents-20261001
- IT Leaders, “Japan Metal Stamping Association (JMSA) Offers Cloud Production Management Service to Revitalize the Industry,” May 27, 2015 (Japanese) https://it.impress.co.jp/articles/-/12408
- MarkLines, “Hitachi FutureStage Production and Sales Management System for the Automotive Parts Industry,” updated October 18, 2013 (Japanese) https://www.marklines.com/ja/product/1605
- SoftBank, “JNX Service” (Japanese) https://www.softbank.jp/biz/services/others/jnx/


