



Search for factory energy-saving measures and you will quickly find lists of premium-efficiency motors, variable-speed drives, LED lighting, compressors, chillers and demand controllers. Yet the investment committee needs answers to different questions: what boundary will be measured, how will changing production conditions be normalised, which action should receive money first, and what evidence will constitute acceptance? If these rules are missing, a lower meter reading may simply reflect lower production rather than better energy performance.
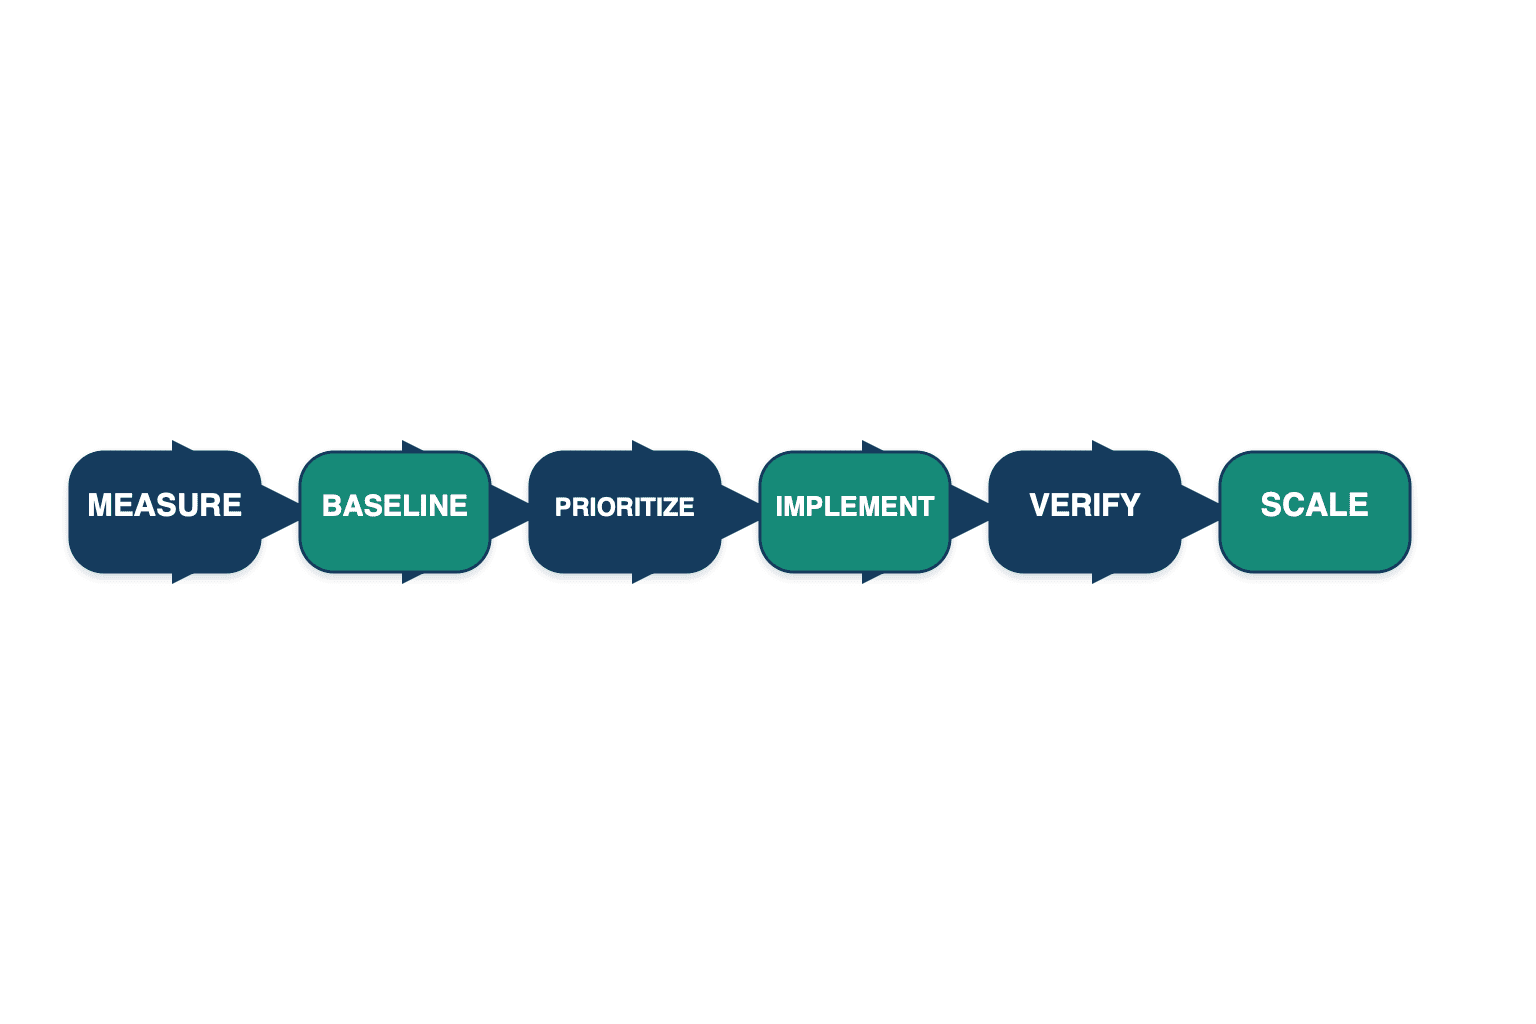
This guide turns factory energy-saving measures into one decision process for manufacturers in Thailand: define the measurement boundary, build an energy baseline (EnB) and energy performance indicators (EnPIs), manage a measure portfolio, specify an RFP and a 90-day proof of concept, perform measurement and verification (M&V), and scale the operating method. The central rule is that savings should not be accepted as a raw before-and-after meter difference. They should be accepted against a counterfactual baseline adjusted to the production, weather and operating conditions of the reporting period. The second rule is to gate a portfolio of no-cost, control, maintenance and capex actions instead of managing an equipment shopping list.
Factory energy-saving measures start with a measurement boundary
The first design choice is not a sensor model or dashboard. It is the boundary within which savings will be determined. A whole-facility boundary at the incoming supply, a building or line boundary, and a boundary around a compressor or chiller group require different meters, explanatory variables, budgets and detection limits.
A whole-facility boundary aligns naturally with financial reporting, but product mix, holidays and new equipment can create substantial noise. An equipment boundary can isolate the direct effect, but it may miss an interactive effect transferred elsewhere. Lowering compressor discharge pressure may reduce compressor power, for example, while causing a remote booster to run harder. Boundary design must therefore document energy, heat, pressure, chilled water, throughput and quality effects that cross the selected line.
The IPMVP generally accepted principles explain that savings cannot be directly measured because they are the absence of consumption. Consumption before and after an intervention must be compared with suitable adjustments. If the purpose is to verify affected equipment, the boundary may surround that equipment. If the purpose is total-facility performance, the facility supply meters may define the boundary. This makes the boundary an accountability and contract decision, not merely an electrical drawing.
Five questions for selecting the boundary
- Who will act on the result: maintenance, the plant manager or finance?
- Which energy flow does the measure directly change?
- Can production, product mix, weather, runtime and shift variables be obtained?
- Could an interactive effect outside the boundary be material?
- Can the expected effect be detected with the proposed meter accuracy and data interval?
Installing meters on every asset before answering these questions produces data volume rather than evidence. Using only the incoming meter to verify a small equipment retrofit creates the opposite problem: the effect may disappear in facility noise. Measurement granularity should match the expected effect and the uncertainty at risk.
The data model for an energy-efficient factory
Power data alone cannot explain why energy changed. A usable architecture joins energy, operations, static factors and cost on a common time axis.
| Data layer | Typical fields | Decision supported | Common failure |
|---|---|---|---|
| Energy | kWh, kW, power factor, flow, pressure, temperature | Where and when energy is used | clock drift, gaps, wrong CT ratio |
| Operations | output, product, speed, runtime, changeover, downtime | Why consumption changed | ERP and shop-floor timestamps do not align |
| Static factors | equipment set, shifts, floor area, setpoints | Whether a normally fixed condition changed | expansion or process change is not logged |
| Cost | tariff class, time band, Ft, demand, tax | How an energy effect becomes money | one average rate is used for every measure |
Energy and bill effects must be separated in Thailand. The ERC table accessed on 30 August 2026 lists retail Ft at 16.23 satang/kWh for May-August 2026 and 16.23 satang/kWh for September-December 2026, but Ft remains time-dependent. PEA also publishes tariff documents, including a TOU service document updated on 23 June 2026. A real business case should recheck the ERC Ft page, the PEA tariff page, the customer’s tariff class and the latest bill immediately before approval. The illustrative price later in this article is not a tariff quotation.
Existing meters may be integrated without replacing every device. Our guide to power-meter and compressed-air data collection in Thailand discusses practical integration. Protocol choice matters, but consistent timestamps, units, scaling, missing-data flags and asset IDs matter more. Even when a pilot begins with CSV files, the RFP should preserve export, API and data-ownership rights for the production system.
EnB and EnPI prevent false claims of factory energy savings
An energy baseline represents the energy that would have been used without the measure under comparable conditions. An EnPI evaluates actual performance. A simple kWh-per-unit ratio is useful, but it can mislead when fixed loads, changeovers, product mix or ambient conditions are material.
When output falls, total kWh may fall while unit energy worsens because fixed load becomes a larger share. When output rises, total kWh can rise while unit performance improves. Comparing a hot month with a mild month also mixes chiller or HVAC load with the intervention effect. A baseline model controls these differences by using relevant operating variables.
ISO 50001:2018 provides a framework for establishing and improving an energy management system. ISO identifies it as the current second edition, reviewed and confirmed in 2024, with the 2024 amendment applying. ISO 50002-1:2025 provides general requirements and guidance for energy audits and replaces the 2014 edition; related parts address buildings and processes. Certification is a separate business decision, but the concepts of EnB, EnPI, energy review and audit trail provide strong investment discipline.
Use role-specific EnPIs from one governed model
Executives need adjusted avoided cost, remaining investment and cumulative effect. A plant manager needs adjusted line energy, output, peaks and abnormal hours. Maintenance needs specific power, load factor, idle consumption, pressure or temperature deviation. One oversized dashboard for everyone is less useful than role-specific views generated from a common governed model.
| Level | Example EnPI | Decision |
|---|---|---|
| Executive | adjusted avoided cost, portfolio investment | continue, stop or scale |
| Plant | adjusted kWh, peak, off-shift load | production and operating plan |
| Line | kWh/t, mix-adjusted kWh, idle power | standard condition and bottleneck |
| Equipment | kW, specific power, pressure, temperature, cycle | settings, maintenance or replacement |
Accept savings against a counterfactual, not a raw meter difference
The acceptance equation can be expressed as:
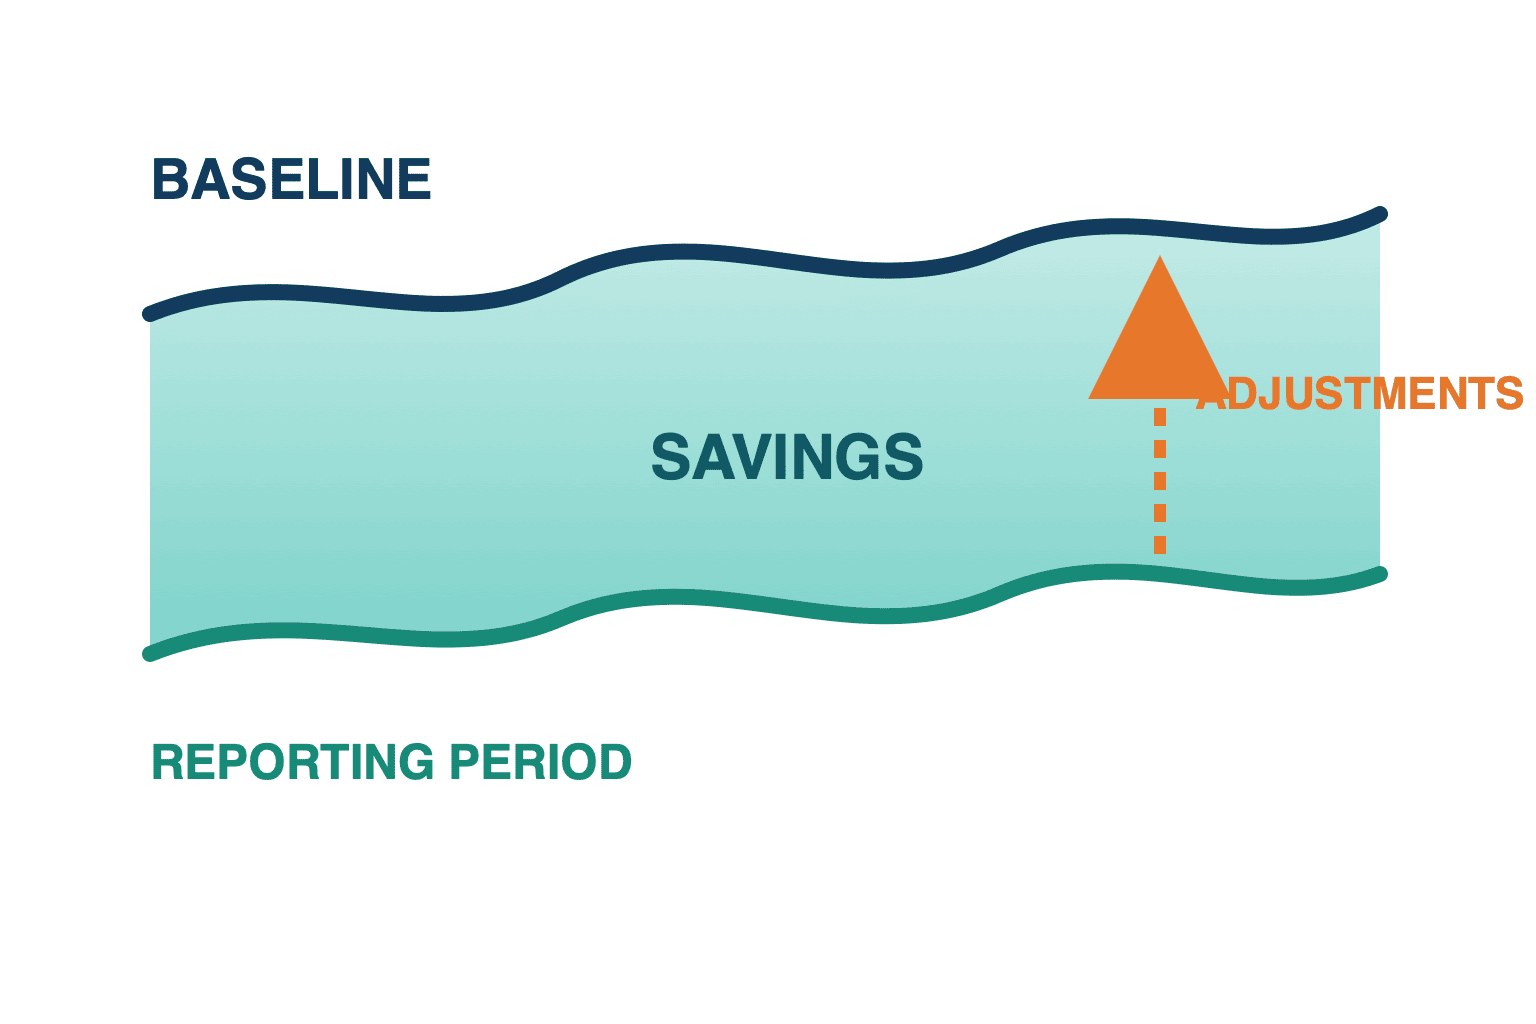
Avoided energy = baseline adjusted to reporting-period conditions − reporting-period measured energy ± non-routine adjustments
Production, weather and runtime are routine variables when they normally change. Facility expansion, an equipment addition, a new shift arrangement or a fundamental product change may require a non-routine adjustment. A model should never be silently overwritten. The reason, approver, effective date and comparison with the prior model should be retained.
Independently checked hypothetical example
The following numbers explain the method only. They are not a customer result, guarantee, benchmark or tariff quote. Assume a 12-month baseline, 15-minute metering and a 90-day reporting period. In the example month, production is 1,800 t, the cooling-degree-day index is 210 and runtime is 520 h. The baseline equation is:
Adjusted baseline = 180,000 + 95×production + 320×cooling degree-days + 210×runtime
The adjusted baseline is therefore 527,400 kWh. If measured consumption in that example month within the 90-day reporting window is 482,000 kWh, that month’s avoided energy is 45,400 kWh and the adjusted saving is 8.61%. At an illustrative sensitivity price of THB 4.20/kWh, the energy-only monthly effect is THB 190,680.
| Item | Hypothetical value |
|---|---|
| Adjusted baseline | 527,400 kWh |
| Example-month energy within the 90-day reporting window | 482,000 kWh |
| Avoided energy | 45,400 kWh |
| Adjusted saving | 8.61% |
| Sensitivity price | THB 4.20/kWh |
| Energy-only monthly effect | THB 190,680 |
This excludes demand charges, changes in Ft, tax, power factor, downtime, quality losses, capex and depreciation. It must not be presented as an actual bill reduction or investment return. A measure that shifts a peak should be valued separately from its kWh effect. See our guide to factory demand control and peak power for that design problem.
Manage four portfolios of factory energy-saving measures
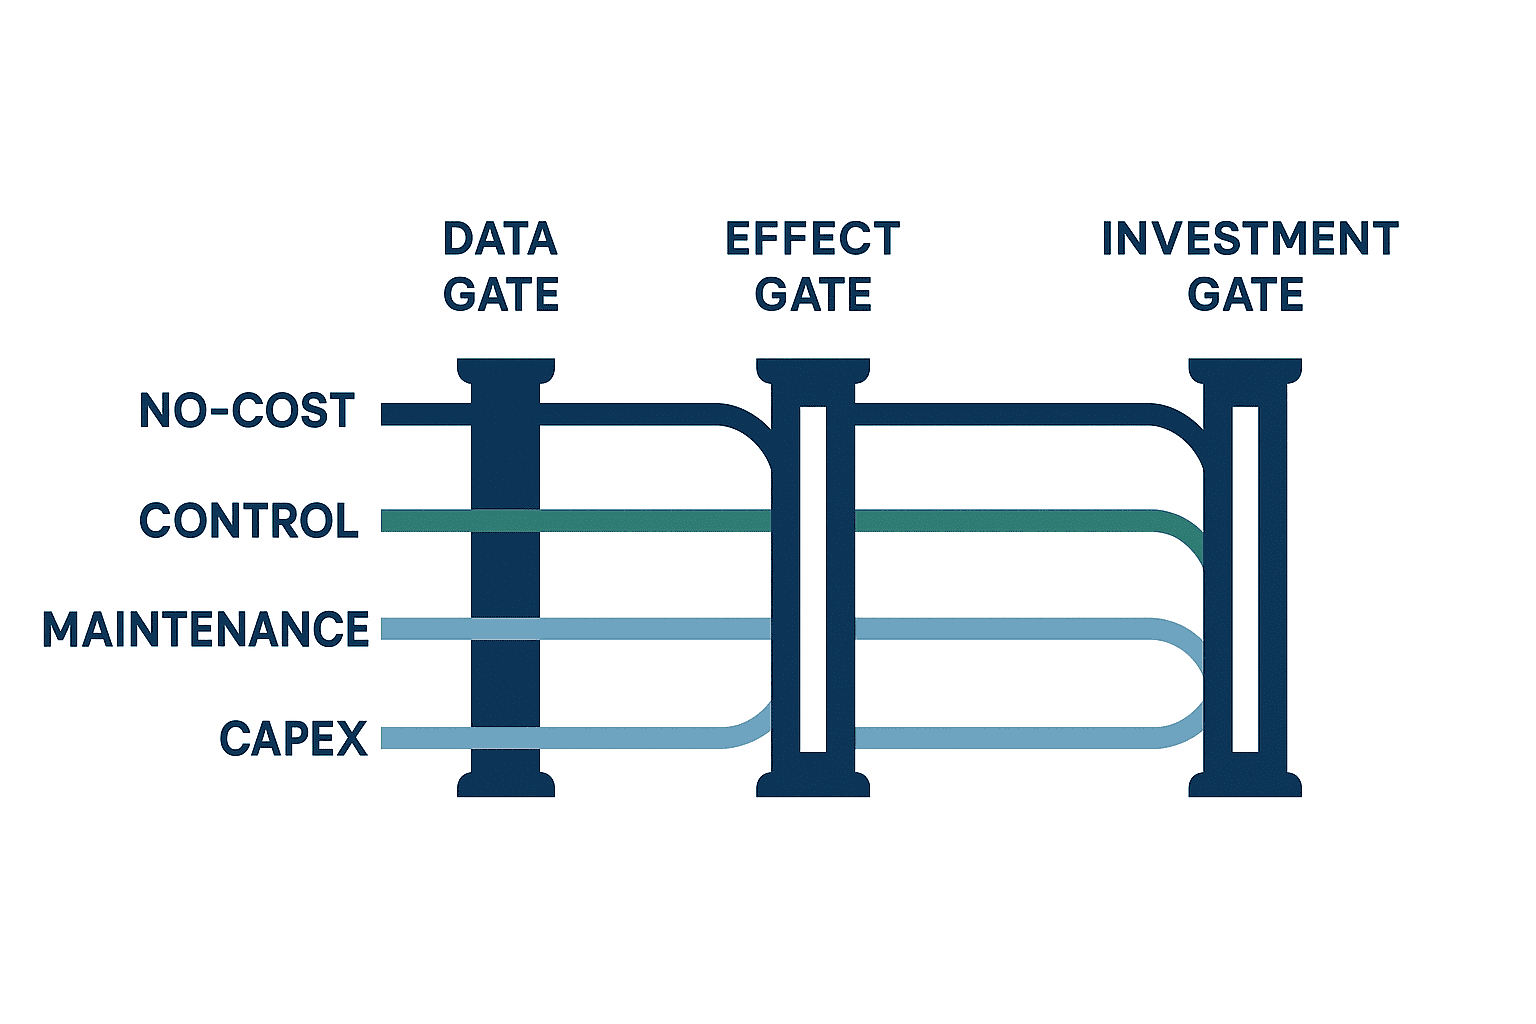
An equipment list often favours visible capital projects. Classifying actions by investment nature keeps operational improvement visible and makes evidence comparable.
| Portfolio | Examples | Primary evidence | Gate decision |
|---|---|---|---|
| No-cost | shutdown rules, setpoints, start sequencing, schedule alignment | event log, operating pattern, quality check | test quickly with rollback instructions |
| Control | scheduling, automatic stop, load following, demand coordination | control logs, alarms, fail-safe test | promote from pilot to standard control |
| Maintenance | air leaks, filters, heat exchangers, belts, steam traps | work order, condition data, before/after measurement | embed in maintenance cycle |
| Capex | efficient equipment, VSD, heat recovery, metering upgrade | specification, load profile, life-cycle case, M&V plan | pass procurement and investment gate |
No-cost does not mean zero implementation cost; change control, labour, quality assurance and training still matter. Control measures need fail-safe behaviour for production and safety. Maintenance savings decay if the defect returns. Capex should be assessed against the actual load profile, not nameplate efficiency. These differences remain visible while each measure passes shared gates for data, pilot, effect, confidence and investment.
An illustrative gate template
These values are an internal starting template, not a legal or ISO requirement. Data readiness could require at least 95% of expected intervals and no unexplained gap longer than 24 h. The PoC could run for 90 days and include at least one normal operating cycle. The effect gate could require at least 5% adjusted savings within the selected boundary. The uncertainty band could be less than 20% of estimated savings. Capex could target simple payback at or below 36 months, with separate rules for safety, compliance and resilience.
The value of gates is not the exact threshold. Their value is transparent exceptions. A small effect may still justify a repeatable no-cost action across many sites. A longer-payback replacement may be justified by avoided failure risk. The exception and its approver should be recorded so the portfolio remains comparable.
Turn equipment power measurement into an action backlog
Finding the largest load is only a starting point. Use the following order to distinguish operational waste from a genuine replacement need.
Examine off-shift baseload first
Review holidays, breaks, changeovers and night periods. Load remaining at zero production can reveal poor shutdown rules, wrong settings, leakage, heat loss or standby consumption. Safety systems, quality preservation, servers or controlled environments may be non-interruptible, so every load needs an owner and shutdown classification.
Connect peaks to production events
Overlay simultaneous starts, process heating, compressor sequencing, chiller transfer, charging and concentrated production. Peak cutting should not mean indiscriminate shutdown. It should sequence or buffer flexible loads without violating throughput or quality. Track kW, kWh, quality and cycle time together.
Test whether variable loads follow demand
Check whether motors, pumps, fans and compressors follow process demand or waste energy through throttling and bypass at low load. The IEA’s 2025 analysis identifies motor-system improvement, variable-speed drives, process optimisation and energy management among important industrial levers. It reports global final energy consumption above 450 EJ in 2024, with industry at nearly 40% and energy-intensive industries representing three-quarters of industrial demand. Industry contributed two-thirds of global demand growth since 2019. These are not plant-level saving claims; they show why management capability deserves investment alongside equipment.
Return degradation signals to maintenance
Air leakage, heat-exchanger fouling, filter pressure drop, damaged insulation, belt condition and sensor drift should become managed work, not recurring discoveries. Link detection, location, owner, repair evidence and next inspection in the CMMS or maintenance register. Energy analytics should close the loop to a work order.
A 90-day PoC proves acceptance, not just a dashboard
A pilot defined as “the dashboard is visible” cannot support a scale decision. Under the hypothetical 90-day design, the team should complete the whole loop:
- Validate boundary, meters, time synchronisation, units and missing-data rules.
- Build the EnB from 12 months of usable history, or document the limits of short-term data.
- Select production, product mix, weather, runtime and static factors, then lock the model version.
- Register candidates across all four portfolios with an owner and causal hypothesis.
- Implement at least one measure and complete operational verification and M&V.
- Have finance, plant, maintenance and IT/OT make a Go, Hold or Stop decision from the same evidence.
Success also means that data gaps have an owner, product changes are recorded, model changes require approval and a named person signs accepted savings. If these responsibilities remain undefined, an attractive pilot result will not scale.
Write evidence and ownership into the RFP
Do not compare vendors only through feature checkboxes. Specify the acceptance evidence.
| RFP area | Requirement | Acceptance evidence |
|---|---|---|
| Measurement | boundary, accuracy, 15-minute time, unit | tag register, clock test, gap report |
| Integration | ERP/MES, output, product, downtime, weather | mapping, latency, resend and reconciliation |
| Analytics | EnB/EnPI, variables, exclusions, model versions | calculation specification, reproducible file, change log |
| M&V | option, adjustments, static factors, uncertainty | M&V plan, report and approval field |
| Operations | alarm, owner, due date, escalation | workflow test, SLA and audit log |
| OT safety | read/write boundary, network, access, recovery | architecture, account register, recovery test |
| Ownership | API, CSV, retention, termination export | export test and contract clause |
| Scale | templates, tag convention, multisite comparison | second-line procedure and effort estimate |
Energy monitoring and closed-loop control require different risk gates. Begin read-only when appropriate. If a system will write control commands, add change management, privileges, fail-safe design and recovery testing. Our factory energy monitoring system guide provides additional architecture context.
Use M&V to create an agreed learning asset
M&V is not an exercise in distrusting a supplier. It gives finance, operations, maintenance and the supplier one rule for recognising value. The plan should identify the measure, boundary, baseline and reporting periods, measurement points, explanatory variables, static factors, routine and non-routine adjustments, missing-data method, model version, uncertainty, tariff conversion and approvers.
Operational verification and saving determination are different. Confirming that a VSD is installed, commissioned and following its intended logic is operational verification. Determining how much energy was avoided relative to the counterfactual is M&V. Installation alone is not accepted as savings. When savings are not detected, investigate control behaviour, operating override, model error and interactive effects.
If the result feeds GHG reporting, keep energy amount, emission factor, reporting period, Scope boundary and renewable instruments as separate governed fields. Energy-cost savings and emissions reductions are related but not identical calculations. See our guide to GHG emissions management in manufacturing for the reporting connection.
Separate Thailand controlled-factory duties from investment incentives
DEDE describes a controlled factory as meeting any applicable criterion: approved electric-meter capacity of at least 1,000 kW, total installed transformer capacity of at least 1,175 kVA, or annual total energy use equivalent to at least 20 million MJ. The annual energy-use test covers 1 January through 31 December, and DEDE explains that a factory qualifying under that annual test becomes controlled from 1 January of the following year.
Legal energy-management duties apply to factories within scope, not automatically to every factory. DEDE’s reminder for the 2025 reporting year required the inspected and certified annual energy-management report by 31 March 2026 and energy-responsible personnel in the number and qualifications set by regulation. Expansion or changing consumption can alter applicability. Check the current DEDE controlled-factory guidance and the relevant year’s DEDE reminder before compliance decisions.
BOI Smart and Sustainable Industry is an investment-promotion measure, not the controlled-factory obligation. The current BOI page describes a minimum THB 1 million efficiency-improvement investment excluding land and working capital and possible machinery import-duty and corporate-income-tax benefits. Eligibility, application timing, recognised investment and benefit calculation must be confirmed for each project; no benefit is automatic. The same page says applications for solar generation under the renewable-energy efficiency-improvement measure were suspended from 1 July 2025. Model BOI support as a conditional scenario and obtain project-specific confirmation before approval.
Design peak cutting separately from energy reduction
A peak-cutting measure may reduce demand cost without reducing total kWh. An efficiency measure may reduce kWh without changing the maximum demand. Maintain separate value fields for energy volume, maximum demand, time shifting and avoided quality or downtime losses.
Do not shift load from tariff tables alone. Check buffers between processes, staffing, safety, maintenance windows and thermal or compressed-air storage. Automated demand control should delay or limit lower-priority loads as a limit approaches and prevent a rebound peak during restoration. If people respond to alarms, the standard work must name who acts, within what response period, and which loads may change.
Scaling means transferring the decision method
Do not copy a setpoint from the first successful line into the second. Product, load factor, piping, weather and shifts may differ. Transfer the tag convention, boundary method, EnB/EnPI selection, action card, M&V plan, gates and approval workflow.
A rollout package should contain the minimum meter design, data dictionary, model template, known static factors, safety checks by measure type, training and effect-verification query. Each new site then creates its local counterfactual with the same governed process instead of promising the same saving percentage. Both success and failure become reusable learning.
Conclusion: make factory energy-saving measures repeatable investments
Factory energy-saving measures become fragmented when they begin with a catalogue. Define the measurement boundary; connect meter and operating conditions; create an EnB and role-specific EnPIs; and govern no-cost, control, maintenance and capex measures through shared gates. Accept savings against a counterfactual adjusted to reporting-period conditions, not a raw before-and-after difference. In the RFP and 90-day PoC, test data ownership, model change, M&V, operating accountability and scalability in addition to the interface. This turns energy efficiency from a specialist activity into an operating and financial process that a factory can repeat.
Even if your factory is still defining its measurement boundary or reviewing existing meters, you can discuss the preparation stage with TOMAS TECH. We can help structure the available data, target equipment and acceptance criteria for a 90-day PoC before a site-wide commitment.
FAQ on factory energy-saving measures
Where should a factory energy-saving programme begin?
Begin with the target boundary, decision owner, available energy and operating data, and current tariff contract. Test reversible operating actions while establishing the baseline. Measurement and small improvements can progress in parallel.
Can a factory accept savings from a month-on-month electricity comparison?
Usually not. Production, product mix, weather, runtime and holidays change. Compare measured energy with an EnB adjusted to reporting-period conditions, and document non-routine changes such as equipment additions.
Does every asset need power metering equipment?
No. Select points based on boundary, expected effect, existing meters and acceptable uncertainty. Incoming supply meters can serve facility management, while equipment-specific measures may require submetering. Review interactive effects in either case.
How should Ft and TOU be handled in a factory electricity-cost reduction case?
Keep the energy effect separate from monetary conversion. Recalculate using the applicable ERC Ft, utility tariff, contract and actual bill at the decision date. An average rate alone cannot value peak cutting or time shifting.
Are peak cutting and kWh reduction the same?
No. Peak cutting changes maximum demand or timing, while efficiency reduces energy volume. Each may create value without the other. Measure both and protect throughput and quality constraints.
Can BOI incentives be included in the payback calculation?
They may be shown as a conditional scenario, not as guaranteed income. Eligibility, timing, recognised investment and benefits require project-specific BOI confirmation. Present both the supported and unsupported cases.
Does controlled-factory status automatically require ISO 50001 certification?
The DEDE materials cited here describe legal thresholds, energy-responsible personnel and annual inspected reporting. Certification is a separate question. Confirm current legal applicability with DEDE or qualified counsel.


