


Stockouts and overstock are one problem, not two
Most regional retail teams escalate two separate crises: the store that ran out of a fast mover, and the distribution centre holding stock nobody wants. They are the same failure — a demand signal that was wrong, and a replenishment rule that could not absorb the error. Retail AI inventory management is the discipline of closing that gap by joining demand forecasting, replenishment planning and automated ordering into a single loop. This guide is written for country managers and IT/supply-chain leads running store networks across Thailand, Vietnam and neighbouring ASEAN markets.
What retail AI inventory management actually is: three layers
The phrase is used loosely by vendors, which makes budget conversations harder than they need to be. It is more useful to separate the capability into three layers, because each one has a different owner, a different data requirement and a different failure mode.
Layer 1 — Demand forecasting. A model estimates how many units of a given SKU will sell at a given location over a given horizon. This is a prediction problem. Its output is a number with an uncertainty range, and nothing else. A forecast on its own changes no behaviour.
Layer 2 — Replenishment planning. The forecast is converted into a target inventory position using service-level policy, lead time, supplier minimum order quantities, case-pack rounding, shelf-presentation minimums and remaining shelf life. This is a decision problem, and it is where most of the commercial value is actually created or destroyed. Two companies with identical forecast accuracy can produce completely different stockout and waste outcomes depending on how this layer is configured.
Layer 3 — Automated replenishment. The recommended order is transmitted to the supplier or DC with progressively less human intervention. This is an execution and governance problem: who can override, what happens when a supplier short-ships, how exceptions are surfaced.
| Layer | Core question | Primary owner | Typical failure mode |
|---|---|---|---|
| Demand forecasting | How much will sell? | Data / SCM analytics | Model trained on distorted history (stockouts, promotions) |
| Replenishment planning | How much should we hold and order? | Supply chain planning | Policy parameters never revisited after go-live |
| Automated replenishment | Who presses send, and when? | Store operations / procurement | Silent manual overrides that nobody measures |
The practical implication: buying a forecasting engine and expecting inventory to fall is a category error. Forecast quality is an input. The financial result comes from Layer 2 policy and Layer 3 discipline.
Why 2026 is the year the business case changes
The scale of the underlying loss has been quoted in industry literature for years. Global retail “inventory distortion” — the combined cost of stockouts and overstock — is repeatedly cited at roughly USD 1.73 trillion per year. This figure circulates widely across industry and vendor publications rather than originating from a single primary study, so treat it as an order-of-magnitude industry estimate, not a measured statistic. It is useful for framing scale, not for building a business case.
What has changed is the practical trend line. Industry analyses of retail forecasting for 2026 describe a shift from batch, historical-sales-only models toward real-time integration of internal data (POS transactions, on-hand inventory) with external signals (weather, local events, price and competitor movement, cross-channel demand), and toward optimising omnichannel inventory at network level rather than per location.
Three market conditions make this newly relevant for ASEAN operators.
Thailand’s retail base is large and food-weighted. Thailand-specific: retail sales grew roughly 3% in 2025 to about THB 4.62 trillion, with the food, beverage and tobacco segment holding 55.68% share in 2025. Food weighting matters because perishability converts forecast error directly into waste, not just into carrying cost.
Digital adoption has crossed a practical threshold in Thailand. Thailand-specific: the country’s digital transformation market is estimated at USD 10.06 billion in 2025, rising to USD 10.94 billion in 2026 and USD 16.64 billion by 2031 (CAGR 8.75%), with cloud accounting for 55.05% as of 2025. Around 150,000 companies were reported to have adopted AI in 2024, with enterprise AI penetration moving from 24% to 32%. Video-commerce sellers grew 175% year on year to 850,000, and 80% of online sales are reported to go through mobile. These are Thailand figures and should not be read as regional averages.
Vietnam’s growth is coming from network expansion. Vietnam-specific: the retail market is estimated at USD 171.4 billion in 2026, growing at a CAGR of 4.87% to USD 217.44 billion by 2031, with first-half 2026 retail and consumer-service revenue up 12.9% year on year.
The efficiency claims attached to AI in this space should be handled with more care. Vendor material citing McKinsey research reports that companies embedding AI in inventory operations reduced inventory by an average of 20–30%; that is a secondary citation and we have not verified the underlying methodology. Similar vendor analyses put AI-driven forecasting at 20–50% reduction in supply-chain forecasting error, 5–10% reduction in warehousing cost and 25–40% reduction in administration cost. A frequently repeated claim that AI/ML adopters see roughly 2.3x revenue growth and 2.5x profit growth versus non-adopters also reaches us through vendor material and should not be treated as established causation — adopters differ from non-adopters in many ways besides AI.
Use these numbers to decide whether the category deserves a pilot. Do not use them in a board paper as your expected return.
What AI can solve, and what it cannot
Expectation management is the cheapest risk control available on this kind of project. The following distinction has held up consistently in field deployments.
AI handles well:
- High-volume, repeating demand patterns at SKU × store granularity, where a human planner cannot physically review every combination.
- Multi-factor seasonality — day of week, payday cycles, school terms, festival periods, weather sensitivity — interacting simultaneously.
- Consistency. A model applies the same logic to 50,000 SKU-store pairs at 3 a.m. without fatigue or favouritism.
- Surfacing exceptions: which items are drifting away from expectation and deserve human attention.
AI handles badly or not at all:
- *Broken master data.* If pack size, shelf life, lead time or supplier calendar fields are wrong, the model will produce confidently wrong orders. No algorithm repairs a wrong case-pack quantity.
- *Invisible lost sales.* POS records what was sold, not what a customer wanted and failed to find. Historical sales during a stockout understate true demand, and a model trained naively on that history will keep the item under-stocked permanently. Censored-demand handling has to be designed in deliberately.
- *Phantom inventory.* If the system says eight units and the shelf holds two, every downstream calculation is wrong. Cycle-count discipline is a prerequisite, not an afterthought.
- *Genuinely new products and one-off promotions.* With no history, the model relies on analog items and human judgement. This is the single most common source of disappointment in year one.
- *Supply-side constraints.* If a supplier cannot deliver more than twice a week, a better forecast changes nothing until the replenishment policy and the supplier agreement change with it.
The honest framing for internal stakeholders: AI reduces the cost of making a large number of routine decisions well. It does not substitute for master data quality, inventory accuracy or commercial negotiation.
Inside a demand forecasting model: data, granularity and how to measure it
The data that matters
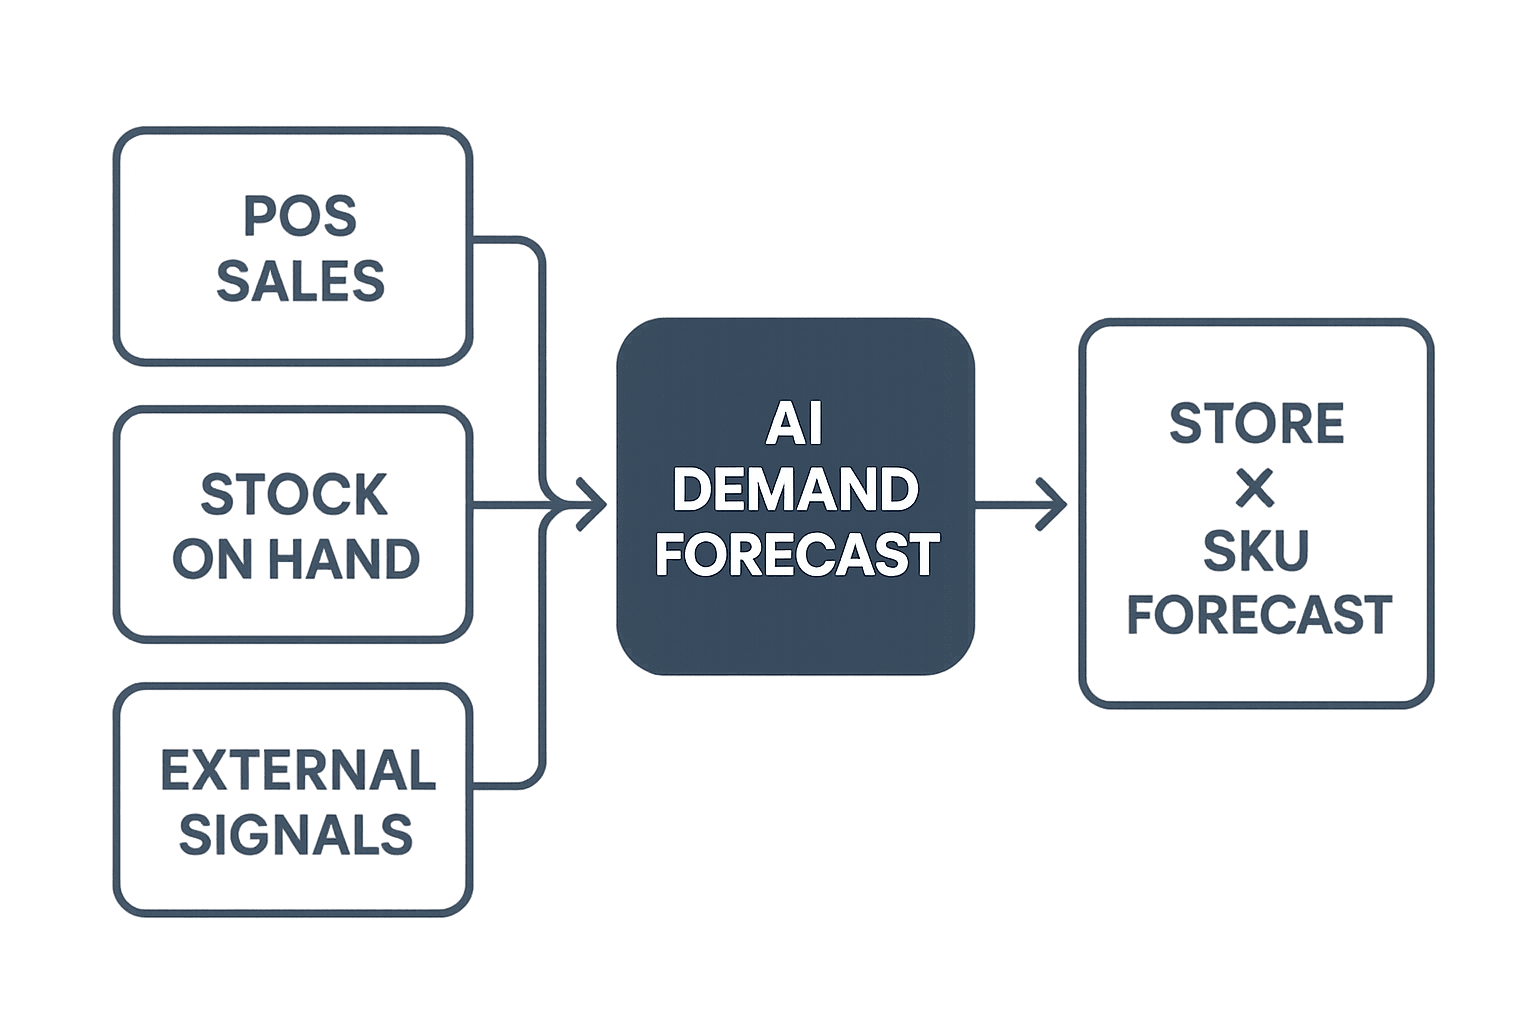
At minimum a workable retail forecasting model needs daily POS sales by SKU and location, on-hand inventory by location, price and promotion history, a product master with pack and shelf-life attributes, and a supplier master with lead times and order calendars. Anything less and you are guessing.
The 2026 direction described in industry analyses adds external signals on top: weather, local events, calendar effects, competitor and price movement, and demand observed on other channels. In an ASEAN context the highest-value external signals are usually weather (rainfall suppresses footfall in open-format retail), local festival and holiday calendars, which differ meaningfully between Thailand and Vietnam, and payday cycles.
Granularity is a design decision, not a technical default
Forecasting at chain level is easy and useless. Forecasting at SKU × store × day is where replenishment decisions are actually made, and it is also where data becomes sparse — many SKU-store combinations sell zero or one unit per day, which breaks naive models. Practical deployments usually run a hierarchy: forecast at a level where the signal is stable (category × cluster of similar stores), then disaggregate down to SKU × store, and reconcile so the numbers add up. Store clustering — by format, catchment, footfall profile — is one of the highest-leverage modelling choices available and is frequently skipped.
Measure the business outcome, not the model
MAPE and WAPE are the standard accuracy metrics, and WAPE is generally the more honest of the two for retail because it weights by volume rather than letting low-volume items with large percentage errors dominate the average.
But accuracy metrics should never be the headline KPI of the programme. A model can improve WAPE by several points and change nothing on the P&L, because the replenishment policy absorbed the improvement and reordered the same quantities anyway. Insist on four operational KPIs instead:
- On-shelf availability / stockout rate at SKU × store level, measured on your top-selling items specifically.
- Waste and markdown rate as a percentage of sales, by category — the critical measure in food retail.
- Inventory turns and days of supply, by category and by location tier.
- Planner and store-staff hours spent on ordering.
Accuracy metrics belong in the data science review. These four belong in the steering committee pack.
From forecast to automated ordering: a four-stage roadmap
Almost every successful deployment we have seen moves through the same four stages. Attempting to jump stages is the most reliable way to lose organisational trust.
Stage 1 — Visibility
*What you need:* consolidated POS and inventory data in one place, a cleaned product and supplier master, and agreed KPI definitions.
*What changes:* for the first time, everyone looks at the same stockout and waste numbers. Arguments shift from “whose number is right” to “what do we do”.
*Where companies stall:* they underestimate master data cleansing and treat it as an IT chore rather than a commercial project with a business owner.
Stage 2 — Recommendation
*What you need:* a forecasting model in production and a recommended order quantity displayed alongside the existing ordering screen.
*What changes:* planners and store managers can compare their judgement against the system, item by item, every day. This is the trust-building phase, and it should be measured — track how often the human overrides, and by how much, and whether the override was right.
*Where companies stall:* they run the comparison for a few weeks, declare the model “roughly as good as our best planner”, and never institutionalise it.
Stage 3 — Semi-automatic ordering
*What you need:* order thresholds and exception rules, an override workflow with a reason code, and a defined escalation path. The system proposes; the human confirms, and only genuinely exceptional items are surfaced for review.
*What changes:* ordering time collapses, and consistency improves across stores because the weakest store now orders like the strongest.
*Reference point:* Japanese convenience chain Lawson has been reported to run semi-automatic ordering across roughly 14,000 stores nationwide, cutting ordering work time by 44 minutes and reducing per-store waste by around 10% year on year. This is a secondary report from a Japanese market context, not an ASEAN benchmark, and store formats and supply frequency differ — but it is a useful illustration of where the labour and waste savings sit.
*Where companies stall:* silent manual overrides. Stores quietly revert to old habits, nobody measures the override rate, and the model appears to underperform.
Stage 4 — Autonomous ordering
*What you need:* proven stability at Stage 3, supplier systems capable of receiving automated orders, exception-only monitoring, and a clearly defined blast radius for failures.
*What changes:* ordering becomes an exception-handling function. Human attention moves to new products, promotions, supply disruptions and assortment.
*Where companies stall:* they discover their supplier interfaces, not their models, are the binding constraint. The direction of travel here overlaps with the broader move toward agentic systems in operations — see our overview of AI Agents in Manufacturing 2026: A Practical Guide for Thai Plants for how autonomy and human oversight are being divided in adjacent domains.
Realistically, most regional operators should target solid Stage 3 within the first eighteen months and treat Stage 4 as a category-by-category decision, not a company-wide switch.

Cost and payback: build the number yourself
We will not quote an implementation price, because the honest answer depends on store count, SKU count, system landscape and data condition, and any single figure would mislead. What we can give you is the structure to build your own estimate and defend it in front of a regional board or a Japanese head office.
Cost components
- Data preparation and master cleansing. Almost always the largest first-year line item and almost always underestimated. Scope it by counting how many SKUs have missing or unreliable pack size, shelf life and lead time attributes.
- Integration. POS, WMS, ERP and supplier EDI interfaces. Cost scales with the number of systems and the age of the oldest one.
- Platform licence or subscription, typically scaling with store count, SKU count or forecast volume.
- Compute and data storage for daily forecast runs.
- Change management and training across head office planners and store staff, in local language. Under-funding this is the leading cause of Stage 3 stalling.
- Ongoing model operations — monitoring, retraining, parameter review. This is a permanent run cost, not a project cost.
- Internal project management time, which is real even though it rarely appears in the vendor quotation.
The benefit calculation
Annual benefit is the sum of four components, each of which should be estimated separately and conservatively:
“`
Annual benefit =
(average inventory value × inventory reduction rate × your cost of capital)
+ (annual waste and markdown value × waste reduction rate)
+ (recovered lost sales × gross margin rate)
+ (ordering hours saved × fully loaded hourly cost)
− annual run cost
“`
Four cautions on this formula:
- Inventory reduction has two distinct effects. Cutting inventory releases cash once — a one-off balance-sheet event — and reduces carrying cost every year thereafter. Do not count the one-off cash release as recurring profit; regional finance functions will find that immediately.
- Use your own cost of capital, not a benchmark, and apply carrying cost including storage, insurance, obsolescence and shrinkage rather than the financing rate alone.
- Recovered lost sales is the softest term. It is the hardest to measure and the easiest to inflate. Estimate it from on-shelf availability improvement on your top-selling items only, and be prepared to defend the assumption that a customer who found the item would not simply have substituted another product you also sell.
- Do not adopt the 20–30% inventory reduction figure as your planning assumption. As noted above, that range reaches us as a secondary citation of McKinsey research through vendor material, drawn from a population of companies whose starting conditions are unknown. Run your own pilot on a defined category and use its measured result.
For payback, run the calculation over three years including run costs, and sensitivity-test the two most fragile assumptions: waste reduction rate and recovered lost sales. If the case only works when both are at their optimistic end, it is not yet a case.
ASEAN in practice: Thailand and Vietnam are not the same problem
This is where regional programmes most often go wrong. A model architecture that performs in Thailand can underperform badly in Vietnam, not because the technology differs but because the channel structure, regulatory environment and store-network economics differ. Below, every figure is labelled by country. None of them should be read as a regional average.
Channel structure
Thailand-specific. Modern trade is dense and mature. 7-Eleven, operated by CP All, has been reported to run more than 14,800 stores in Thailand covering all 77 provinces as of 2026 — the second-largest store count of any 7-Eleven market globally — after opening around 700 new stores in 2024. E-commerce is material but its size depends heavily on definition: Thai e-commerce GMV has been reported above THB 1 trillion (roughly USD 30 billion), and The Nation reported in April 2026 that e-commerce represents about 30% of Thai retail, while other estimates place it in the 11% range. The gap comes from what is being measured — platform GMV versus retail sales, goods only versus goods plus services — so quote the definition alongside the number whenever you use it internally. Platform share in Thailand has been reported at Shopee 50%, TikTok Shop 32% and Lazada 18%.
Vietnam-specific. The convenience and mini-supermarket channel is in a build-out phase. Reporting on a Q&Me survey puts the segment at 9,671 stores in 2026, up 23.89% or 1,865 stores year on year, with non-core and provincial locations reaching 4,933 stores (+25.12%) and expected to account for the majority of the national total. Individual chains cited include GS25 at 318 stores (up roughly 35%), FamilyMart at 172 (up roughly 23%) and 7-Eleven at 148 (up roughly 14%), with WinCommerce reported to be planning 1,000 to 1,500 new store openings in 2026.
*What this means for forecasting.* In Thailand, the modelling problem is optimisation inside a large, stable, high-frequency network: gains per store are incremental, but they multiply across thousands of locations. In Vietnam, a large share of your store base each year has little or no sales history, so the cold-start problem is structural rather than occasional. Store clustering and analog-based initialisation are not nice-to-have refinements in Vietnam; they are the core of the design. A regional programme that treats new-store forecasting as an edge case will produce good Thai results and poor Vietnamese ones.
Regulatory maturity
Thailand-specific. Food waste is both an environmental and a commercial issue. Thailand generates an estimated 9.68 million tonnes of food waste per year, about 146 kg per capita annually, and only around 2% of food waste in Bangkok is reported to be recycled, against a national target of reusing or recycling 50% of organic waste. Critically for retail operators, TDRI (Thailand Development Research Institute) noted in April 2026 that Thailand lacks a legal framework making surplus food donation safe, practical and economically rational. The operational consequence is direct: donation is not currently a dependable disposal channel for near-expiry stock in Thailand, so markdown timing and order accuracy carry more of the load. Separately, and also Thailand-specific, a THB 400 per day minimum wage has applied since 1 July 2025 on a limited basis by sector and area — whether your operation falls within scope must be confirmed for your specific business, as the coverage is not universal.
Vietnam. We do not have equivalent verified data on food-donation or waste regulation for Vietnam, and the Thai figures and legal position above do not apply there. Verify Vietnamese requirements locally before assuming any parallel. This asymmetry is itself a planning point: regional teams frequently apply a Thai regulatory reading to Vietnamese operations because the Thai analysis was done first.
Store-network economics
| Dimension | Thailand | Vietnam |
|---|---|---|
| Network maturity | Dense, mature modern trade (7-Eleven 14,800+ stores, all 77 provinces, 2026 — Thailand-specific) | Rapid expansion (CVS/mini-super 9,671 stores in 2026, +23.89% — Vietnam-specific) |
| Growth source | Same-store efficiency, omnichannel | New store openings, provincial expansion |
| Dominant modelling challenge | Optimisation at scale, perishable accuracy | Cold start, sparse history, cluster analogs |
| Logistics implication | High-frequency short-lead-time replenishment | Longer and more variable lead times to non-core provinces |
| Policy implication | Tight safety stock, aggressive markdown timing | Higher safety stock buffers where lead-time variance is high |
Longer and more variable lead times change the replenishment policy more than they change the forecast. Safety stock is a function of both demand variability and lead-time variability, and in expanding provincial networks the second term often dominates. If your distribution design is also in flux, the warehouse and transport side deserves its own analysis — our Southeast Asia Logistics DX 2026: Logistics AI, WMS and Warehouse Automation guide covers how WMS and automation decisions interact with replenishment design.
How to run this regionally
Run one platform, many parameter sets. Harmonise KPI definitions across countries so that “stockout rate” means the same thing in Bangkok and Ho Chi Minh City, then localise every threshold: service levels, safety stock policy, review frequency, markdown rules and approval limits. Report in local currency (THB, VND) with a defined consolidation rate, and never let a single country’s percentage improvement be presented to head office as a regional expectation.
Five failure patterns to plan against
1. Master data was never cleaned. The project starts with a model selection workshop instead of a data audit. Six months later, order recommendations are wrong for a meaningful share of SKUs, store staff lose confidence, and the override rate rises to the point where the system is decorative. Fix: audit pack size, shelf life, lead time and supplier calendar completeness before signing anything, and assign a business owner — not IT — to master data quality permanently.
2. New products and promotions were treated as an afterthought. In food and FMCG these represent a disproportionate share of both volume and risk. If the design has no explicit analog-item process and no promotion-uplift handling, the model will look competent on the stable core range and embarrassing on exactly the items everyone watches. Fix: design the new-product and promotion path in phase one, with named human owners.
3. Manual overrides are unmeasured. Stores accept the system publicly and override it privately. Because nobody logs override frequency, reason or accuracy, the organisation cannot tell whether the model is wrong or the process is. Fix: mandatory reason codes, a weekly override report by store, and a periodic review of whether overrides improved or worsened the outcome.
4. KPIs were never defined before go-live. Without an agreed baseline, every result becomes contestable and the programme cannot prove value. Fix: freeze definitions and baseline values for stockout rate, waste rate, inventory turns and ordering hours before the first forecast is generated.
5. The pilot never leaves pilot. A PoC succeeds in one category in three stores, and then stops, because nobody defined in advance what result would trigger a rollout, who would fund it, and what the operating model afterwards looks like. Fix: write the rollout criteria and the post-project run model into the PoC charter on day one.

The data foundation: POS, WMS, ERP and supplier documents
Every capability described above rests on whether four data domains can be reconciled reliably.
POS supplies demand history — transaction-level, by SKU, by store, by day, ideally with price and promotion flags attached. Aggregated weekly extracts are usually insufficient for store-level replenishment.
WMS supplies inventory position, receiving and picking accuracy, and DC-level constraints. If DC stock accuracy is poor, store replenishment inherits the error.
ERP supplies purchasing, supplier master, cost and financial reconciliation. It is where the inventory value used in your payback calculation actually lives, so alignment between operational and financial inventory views is a prerequisite for proving benefit.
Manufacturing and production systems, for operators who also produce, supply production plans, batch and shelf-life data. Where a group runs its own factories, connecting production planning to retail demand forecasting is often a larger prize than store replenishment alone. For food operators, batch-level traceability requirements interact directly with shelf-life-aware replenishment — see Food Factory Traceability System: FSMA 204 and Thai Rules for 2026.
Supplier documents are the quiet bottleneck. In many ASEAN operations, goods receipts, delivery notes and supplier invoices still arrive on paper or as scanned PDFs, which means actual received quantities and actual lead times — the two inputs replenishment policy depends on most — exist only outside your systems. AI-OCR is the pragmatic bridge here, capturing document data into structured records without waiting for every supplier to adopt EDI. We cover the operational detail in AI-OCR Back Office Automation for ASEAN Factories 2026.
The master data itself deserves a named owner and a maintenance routine. The attributes that most often break replenishment are, in our experience, case pack and inner pack quantity, shelf life and minimum remaining life on receipt, supplier lead time by location, order calendars and cut-off times, and store-level assortment and planogram minimums. None of these are glamorous. All of them will invalidate a good model.
Implementation sequence and internal ownership
A workable sequence for a regional operator looks like this.
Months 1–2: assess and baseline. Data audit across POS, WMS and ERP. Master data completeness scored by attribute. KPI definitions frozen and baselined by country. Target categories selected — start where perishability or capital tie-up is highest, because that is where measurable change appears fastest.
Months 2–4: foundation. Data pipeline built, master data cleansed for the target categories, single reporting view live. This is Stage 1 of the roadmap and it delivers value on its own.
Months 4–8: pilot at recommendation level. Model in production for the target category in a representative store sample — in Vietnam, deliberately include new and provincial stores in that sample, or the pilot will not represent the network you actually run. Compare recommendation against human decision daily. Measure.
Months 8–14: semi-automatic rollout. Exception rules, override workflow with reason codes, store training in local language, weekly operating review.
Months 14+: expand and selectively automate. Additional categories and countries. Stage 4 autonomy considered category by category where stability is proven.
On ownership, the pattern that works is consistent: an executive sponsor at country-manager or regional-director level who owns the P&L outcome; a supply chain or merchandising lead who owns replenishment policy and is accountable for the KPIs; an IT lead who owns integration and data quality; store operations represented from day one, not consulted at rollout; and, where a vendor is involved, a defined handover point at which model operations become an internal or contracted run function rather than a project activity. The most common structural mistake is placing the programme entirely under IT. It is a commercial programme with a technical component, and the sponsorship should reflect that.
FAQ
What is AI demand forecasting in retail, and how does it differ from statistical forecasting?
Traditional statistical methods extrapolate from a single series — this SKU’s own sales history — using trend and seasonality. AI demand forecasting for retail learns across many series simultaneously and incorporates additional variables such as price, promotion, weather, events and cross-channel demand. The practical advantage is less about a single item’s accuracy and more about handling tens of thousands of SKU-store combinations consistently, including sparse ones where a standalone statistical model has too little data to work with.
How much can an automated replenishment system reduce stockouts and overstock?
There is no reliable universal figure. Vendor material citing McKinsey research reports average inventory reductions of 20–30% among companies embedding AI into inventory operations, and other vendor analyses cite 20–50% reductions in forecasting error, but these are secondary citations from populations whose baselines are unknown. The defensible approach is to pilot on one category, measure stockout rate, waste rate and inventory turns against a frozen baseline, and extrapolate from your own result.
Is inventory optimization AI worth it for a mid-sized retailer, or only for large chains?
Scale helps but is not the deciding factor. The deciding factors are how many SKU-store combinations a human currently cannot review properly, how much capital is tied up in inventory, and how much of your assortment is perishable. An operator with a few dozen stores and a heavily perishable range can see a clearer case than a larger chain with slow-moving durable goods. What mid-sized operators should avoid is a full-scope enterprise deployment; start narrow and expand.
How does omnichannel inventory change the forecasting problem?
It changes the unit of optimisation. Once stock can be sold online, picked from a store or shipped from a DC, the right question is no longer “how much should this store hold” but “where in the network should this unit sit”. Industry analyses of 2026 forecasting practice describe exactly this shift toward network-level omnichannel optimisation. It also complicates demand attribution: online demand fulfilled from a store must not be misread as that store’s shelf demand.
What data do we need before starting a Thailand retail DX project?
At minimum: daily SKU-by-store POS history, on-hand inventory, price and promotion history, a product master with pack and shelf-life attributes, and a supplier master with lead times and order calendars. Before committing budget, score master data completeness by attribute. Given that food, beverage and tobacco accounted for 55.68% of Thai retail in 2025 (Thailand-specific), shelf-life attributes deserve particular scrutiny in that market.
How long does it take to go from pilot to automated ordering?
For a single-country operator with reasonable data quality, roughly twelve to eighteen months to reach stable semi-automatic ordering in the first categories is a realistic planning assumption; full autonomy is a later, category-specific decision. Multi-country rollouts should add time for localisation rather than assuming the Thai configuration transfers to Vietnam. Where master data is poor, the foundation phase alone can consume half the timeline.
Can we reduce food waste with AI, and does donation help in Thailand?
Better forecasting and shelf-life-aware replenishment reduce the volume of stock that reaches its markdown window, which is the primary lever. On donation, Thailand-specific: TDRI noted in April 2026 that the country lacks a legal framework making surplus food donation safe, practical and economically rational, so donation cannot currently be assumed to be a dependable disposal route in Thailand. Do not extend that conclusion to other markets without local verification.
Conclusion
Stockouts and overstock are two symptoms of one gap between what you predicted and what you could react to. Closing that gap is less a modelling exercise than a sequencing exercise: clean the master data, agree the KPIs, prove the recommendation, then automate what has earned trust. For regional operators the additional discipline is refusing to average Thailand and Vietnam together — the Thai problem is optimisation inside a dense mature network under real food-waste and regulatory constraints, while the Vietnamese problem is forecasting a network that is still being built. One platform, two parameter sets, one set of KPI definitions.
TOMAS TECH CO., LTD. is a Bangkok-based IT integrator working with factories, logistics operators and retailers across Thailand and the wider ASEAN region, with practical experience in production management systems, IoT equipment monitoring, AI-OCR and custom system development. If you are assessing where your own data foundation actually stands before committing to an inventory AI programme, we are happy to work through the assessment with you.
References
- AI in Retail Inventory Operations — Innoflexion
- How to Choose AI Retail Inventory Software in 2026 — Invent.ai
- AI for Demand Forecasting — Appinventiv
- Demand Forecasting in Retail — LatentView
- AI-Driven Demand Forecasting for Retail in 2026 — 7thonline
- Retail Industry in Thailand — Mordor Intelligence
- Thailand e-commerce coverage — The Nation, 29 April 2026
- Thailand E-Commerce Industry — Anchanto
- Thailand Digital Economy Trends 2026 — EnerSys
- Thailand’s Digital Retail Outlook 2025–2026 — Sellercraft
- 7-Eleven store network in Thailand — United Daily
- Food waste law in Thailand — TDRI, April 2026
- Food waste research — Scientific Reports (Nature)
- Retail Industry in Vietnam — Mordor Intelligence
- Vietnam retail market outlook 2026 — Vietnam.vn
- Vietnam’s convenience store boom beyond major cities — The Investor
- Vietnam Modern Trade Retail Trends 2026 — Q&Me
- AI demand forecasting and food waste reduction (Japan case) — Magee


