


An Industry 5.0 implementation should not begin with another robot purchase or a cosmetic update from “4.0” to “5.0.” The European Commission frames Industry 5.0 around human-centricity, sustainability and resilience, alongside industrial competitiveness. This guide translates those three priorities into a practical assessment for Thai factories, an evidence-based RFP, and a 90-day PoC that proceeds through FAT, SAT and a clear GO/HOLD decision.
Industry 5.0 implementation is a decision framework, not a machine generation
The European Commission describes Industry 5.0 as going beyond efficiency and productivity by placing worker wellbeing, sustainability and resilience at the centre of industry. It is a vision and implementation framework, not a certification scheme or a standalone legal obligation. Existing Industry 4.0 assets—PLCs, sensors, MES, ERP, cloud platforms and AI—remain useful. The question changes from “how much can we automate?” to “does technology help people make better decisions, reduce resource intensity and recover from disruption?”
At the European Commission’s Industry 5.0 Community of Practice plenary on 20 March 2026, more than 120 participants saw a prototype Assessment Tool. This indicates movement from principles toward organisational assessment. A Thai factory, however, still needs local translation: Japanese-headquarters quality expectations, Thai operator practices, vendor service boundaries, utilities and supply volatility must fit one operational model.
NECTEC ACE 2026 makes another practical point: a factory does not need to replace every machine. Existing machine signals, additional sensors and clear human decisions can create a viable first step. The aim is not maximum connectivity; it is a reliable path from evidence to action.
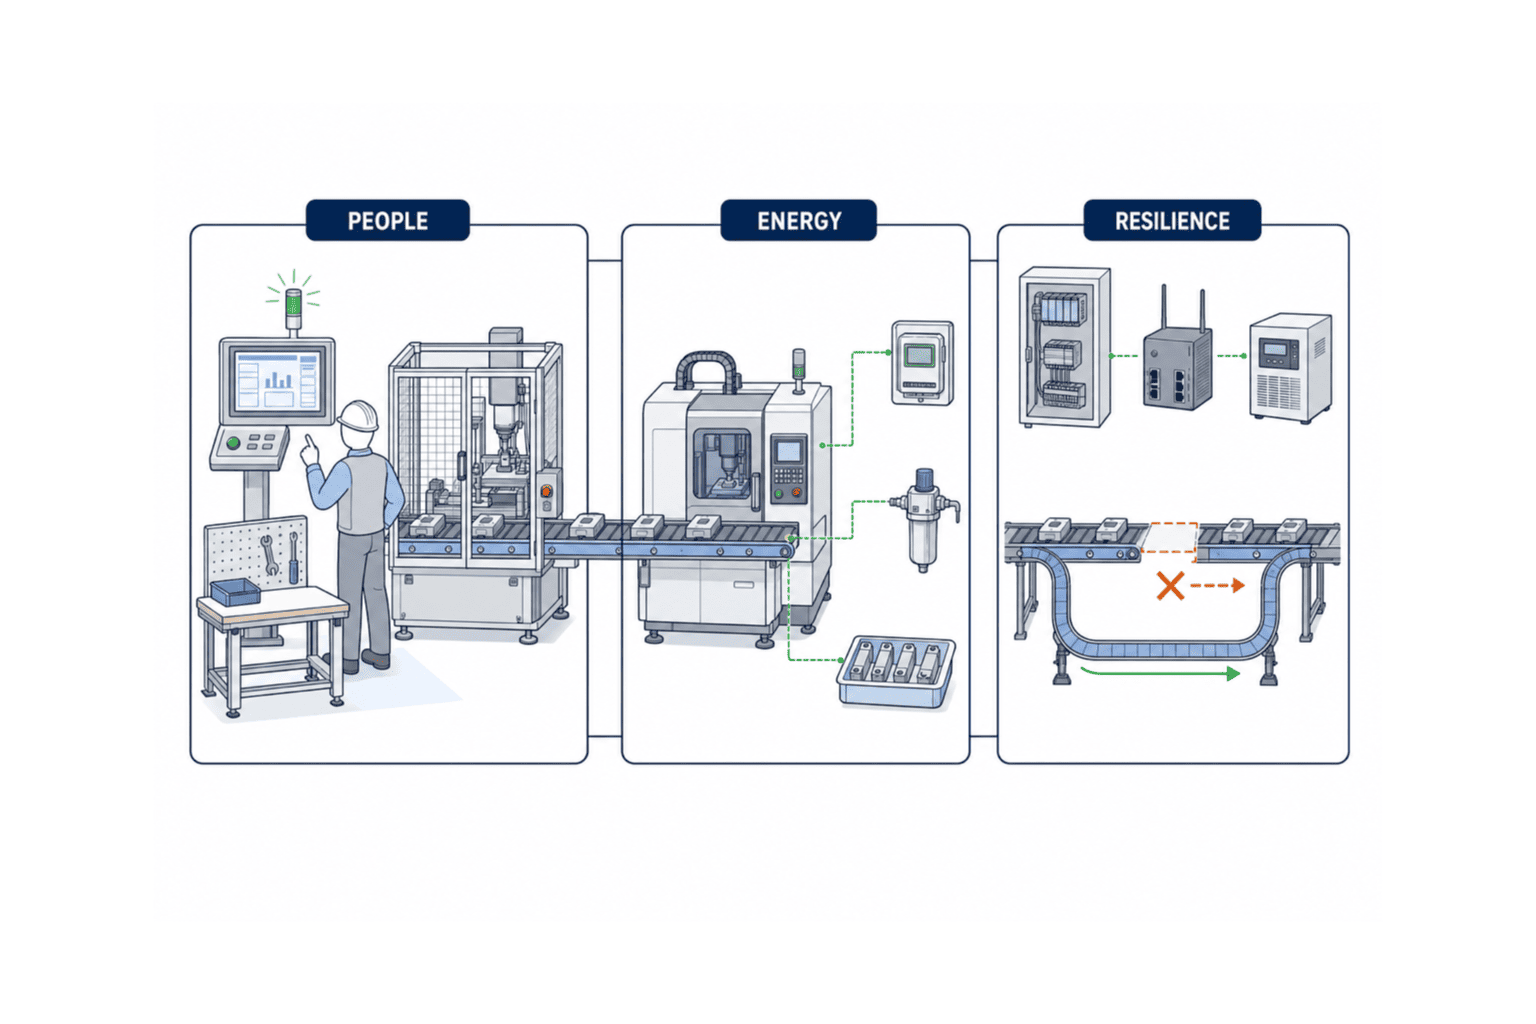
Translate the three pillars into concrete factory conditions
Human-centric manufacturing: do not turn operators into exception-handling devices
Human-centricity is more than issuing tablets. Define who decides during an abnormal event, whether an alarm is understandable, whether skills cause quality variation, and how improvement ideas enter standard work. Western Digital’s example presented at NECTEC ACE—AI operating continuously while people make decisions—illustrates a useful division of labour. AI can detect signals and organise evidence; people retain authority over safety, quality and delivery trade-offs.
Assess the HMI, andon, recovery procedure, training, permissions, shift handover and maintenance workflow. Two hundred unprioritised alarms are not human-centred, even when they are digital. A better acceptance condition is one view that shows the likely cause, affected lot, recommended checks and comparable past events, with a recorded human decision.
NECTEC’s SMC Academy reports engagement with more than 4,000 people and over 300 factories in three years, and uses a Human Capability Framework to address the technology–skills gap. Training should therefore be role-based: executives need portfolio and risk decisions; managers need KPI and change control; engineers need connectivity, analytics and recovery; operators need standard work and abnormal-response competence.
Sustainable manufacturing: measure by product and process, not only monthly totals
A monthly electricity bill cannot identify which machine, product, shift or state caused consumption. Define the relevant utilities—electricity, compressed air, water or steam—and align them with equipment state, output, good units and downtime on the same timeline.
Acceptance metrics should include actionable intensity measures such as kWh per good unit, utility use per lot and standby power per idle hour. Do not promise a reduction before the boundary is stable. Put the metering scope, missing-data policy, product-mix adjustment, baseline period and reproducible formulas in the RFP. This prevents lower production volume from being misreported as an energy improvement.
A resilient factory: design recovery, not an illusion of zero downtime
Resilience means containing the impact of equipment failure, sensor loss, network latency, power interruption, material shortage or cloud failure; shifting to an alternative mode; recovering; and retaining traceability. Design local buffering, offline operation, manual recovery conditions, spares, backup, time synchronisation and communication responsibilities.
Availability alone is insufficient. Measure detection time, decision time, recovery time, lost data, untraceable lots and quality assurance during fallback. Smart Manufacturing Thailand 2026 highlights high-mix production, flexibility, automation and digitalisation, and describes instability as a core challenge. In that environment, a system that absorbs change safely is often more competitive than a rigid line optimised only for average efficiency.
A three-axis Industry 5.0 assessment for Thai factories
The direct labels used by NECTEC ACE 2026 are Data, Operational and Strategic. The three Industry 5.0 pillars express what matters; these three assessment axes identify where implementation should start. To make the Data axis actionable, this article adds an editorial implementation lens—“data fit for decisions”—rather than presenting that phrase as a NECTEC label.
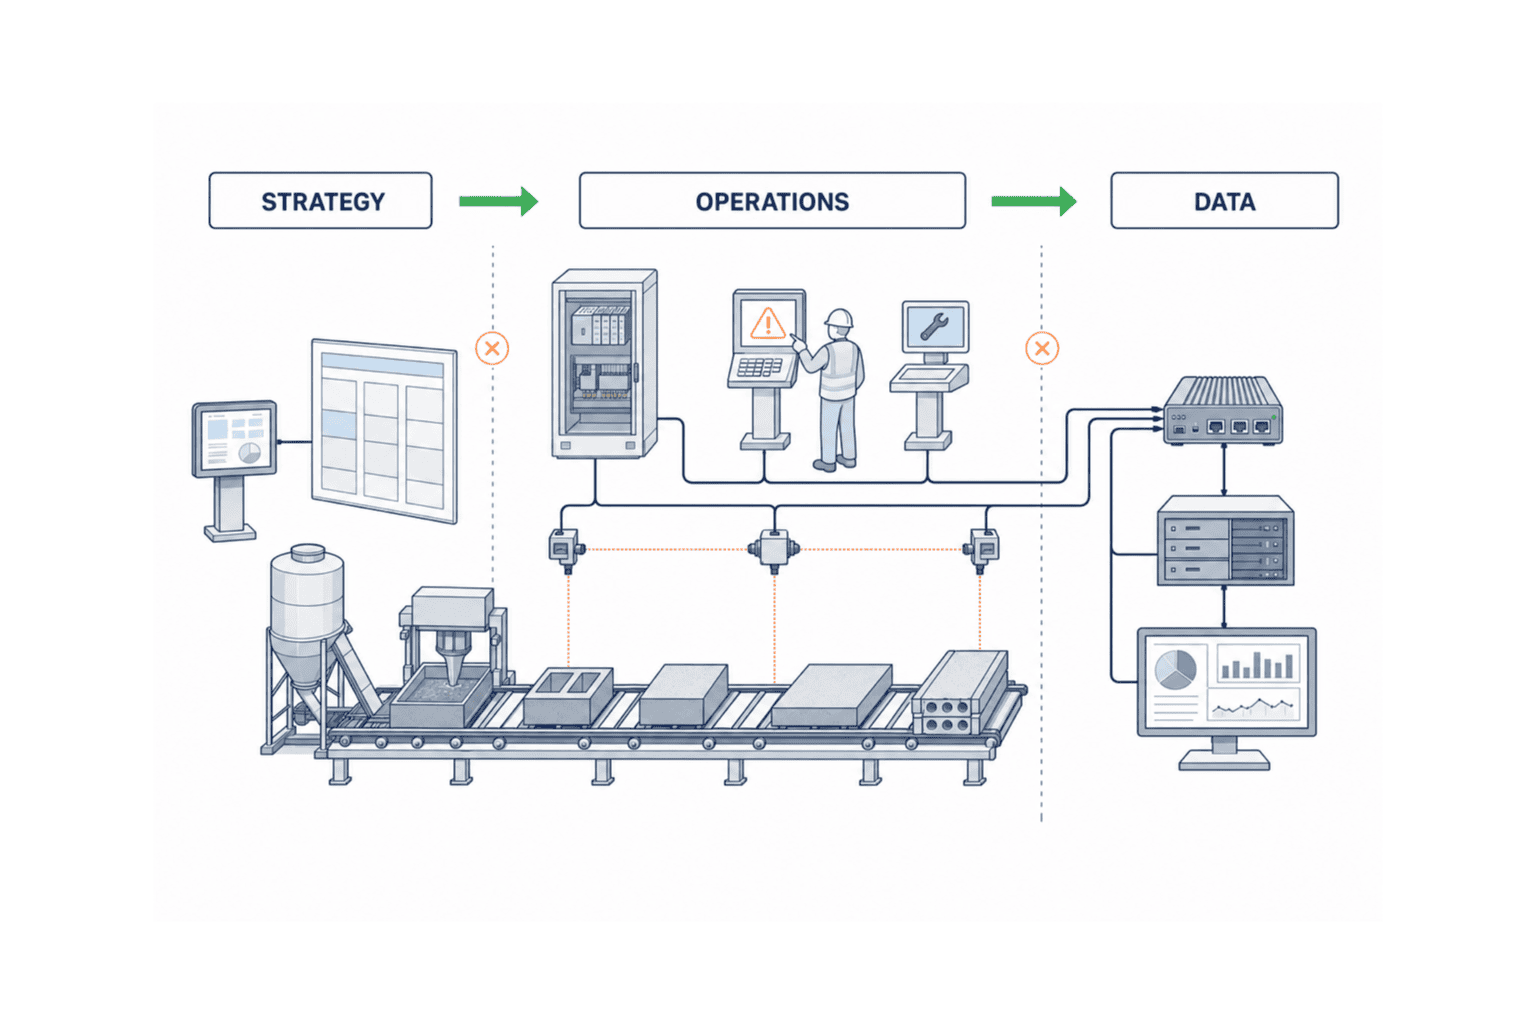
Strategic: business outcomes and investment portfolio
Translate equipment requests into business risk. Replace “we want AI” with a precise statement: night-shift anomalies are detected late; recovery depends on one specialist; product-level energy intensity is unknown; or no one can select an alternate route quickly after a critical-machine failure.
Ask which risk among people, safety, quality, environment and continuity has priority for the next 12 months; who reviews its KPI; whether projects can share data and skills; who owns scale-out after a successful PoC; and whether management has agreed HOLD criteria. NSTDA’s practical DX strategy examined 61 companies across organisation/management, smart operations, IT/data and workforce, with ROI prioritisation. That structure helps keep Industry 5.0 from becoming an isolated equipment purchase.
Operational: standard work, abnormal response, maintenance and utilities
Walk real shifts and observe where information breaks. Include changeovers, micro-stops, quality holds, rework, sensor failure, lost networks and power recovery—not only the normal cycle.
The DIPROM/JICA RISMEP activity covered three regions, six jointly supported companies and six self-supported companies, combining Kaizen with IoT, sensors, production signals and real-time monitoring. The lesson is to keep IoT inside the improvement cycle. Data has little value unless someone reviews it at a defined cadence and changes a standard using agreed rules.
Unofficial notes or chat messages are evidence of friction, not merely non-compliance. Investigate why they are faster than the formal system: excessive input, distant terminals, missing permissions or unclear alarms. Convert the cause into a human-centred requirement.
Data: operationalised here as data fit for decisions
“Data fit for decisions” is this article’s practical elaboration of NECTEC’s Data axis. Assess decision fitness rather than data volume. Equipment IDs, products, lots, timestamps, shifts, downtime reasons and energy values must join reliably. PLC data without master-data alignment or time synchronisation can produce a confident but wrong conclusion.
Specify owner, sampling interval, unit, timezone, clock synchronisation, missing-data flag, correction history, retention, access, backup and model-version history. For AI, add the training-data boundary, false-alarm and missed-detection treatment, human override and fallback when the model is unavailable.
| Axis | Evidence of current state | Desired state | First PoC candidate |
|---|---|---|---|
| Strategic | KPI reviews, investment list, RACI | Three pillars linked to business KPIs | One risk on one line |
| Operational | Standard work, stop and maintenance history | Normal, abnormal and recovery work standardised | Abnormal response or intensity monitoring |
| Data | Tag list, asset master, missing-data rate | Common time, units and IDs | Existing signals plus selected sensors |
Do not average the axes. Strong strategy with weak data creates polished dashboards with fragile evidence. AI introduced before operational standardisation can preserve variation. Treat the weakest axis as a constraint on PoC scope.
Twelve requirements for an Industry 5.0 RFP
An RFP should align purpose, boundary, evidence and responsibility rather than list products.
1. Problem and baseline
State the line, product, shift, equipment and time period. Define the current-value formula and data-quality limitations. Distinguish planned downtime, unplanned downtime and micro-stops.
2. Outcome hypotheses for all three pillars
Set at least one observable outcome for human-centricity, sustainability and resilience. A speed improvement that increases workload or energy intensity can then trigger HOLD.
3. Current architecture and integration boundary
Map PLCs, sensors, SCADA, MES, ERP, historian, cloud, network and identity services. Define read-only and write boundaries, allowed downtime, ownership and which legacy assets remain.
4. Human and AI roles
Separate notification, recommendation and control. Define the final decision-maker, override conditions, escalation, logs and procedures when the model stops.
5. Data dictionary and quality
Make tags, asset IDs, units, sample rates, latency, missing values, outliers, clock synchronisation and retention acceptance items. A KPI must be reproducible from delivered data.
6. Cybersecurity and access
Cover segmentation, least privilege, service accounts, patching, backup, audit logs, remote access and incident contact. Include temporary PoC accounts and service laptops.
7. Usability and accessibility
Specify required Thai, English and Japanese coverage, displays that do not rely only on colour, glove use, viewing distance, response time and alarm priority. Review prototypes with operators early.
8. Training and capability transfer
Define role-based outcomes, materials, exercises, pass criteria and retraining. Include diagnosis, data-quality checks, change requests and recovery—not only button operation.
9. Sustainability measurement boundary
Define meters, accuracy, allocation, baseline, product-mix adjustment, intensity formula and missing-data treatment. Keep environmental impact distinct from financial savings.
10. Resilience and fallback
Test network loss, cloud loss, sensor failure, power interruption and database outage. Define safe state, local operation, retransmission, recovery time and reconciliation.
11. FAT/SAT and evidence format
Give every requirement a test ID with precondition, input, expected result, actual result, log, photo and approver. FAT covers function and simulated abnormal cases; SAT proves the solution on the real line, network and shifts.
12. Scale and exit conditions
Define GO, conditional GO, HOLD and termination. Include IP, configuration, source, data return, equipment removal, account closure and operating costs. Ask for scale-out price and staffing before the PoC begins.
A 90-day PoC connected to FAT, SAT and GO/HOLD
A PoC is not a demo. It makes an investment hypothesis falsifiable in a small real environment.
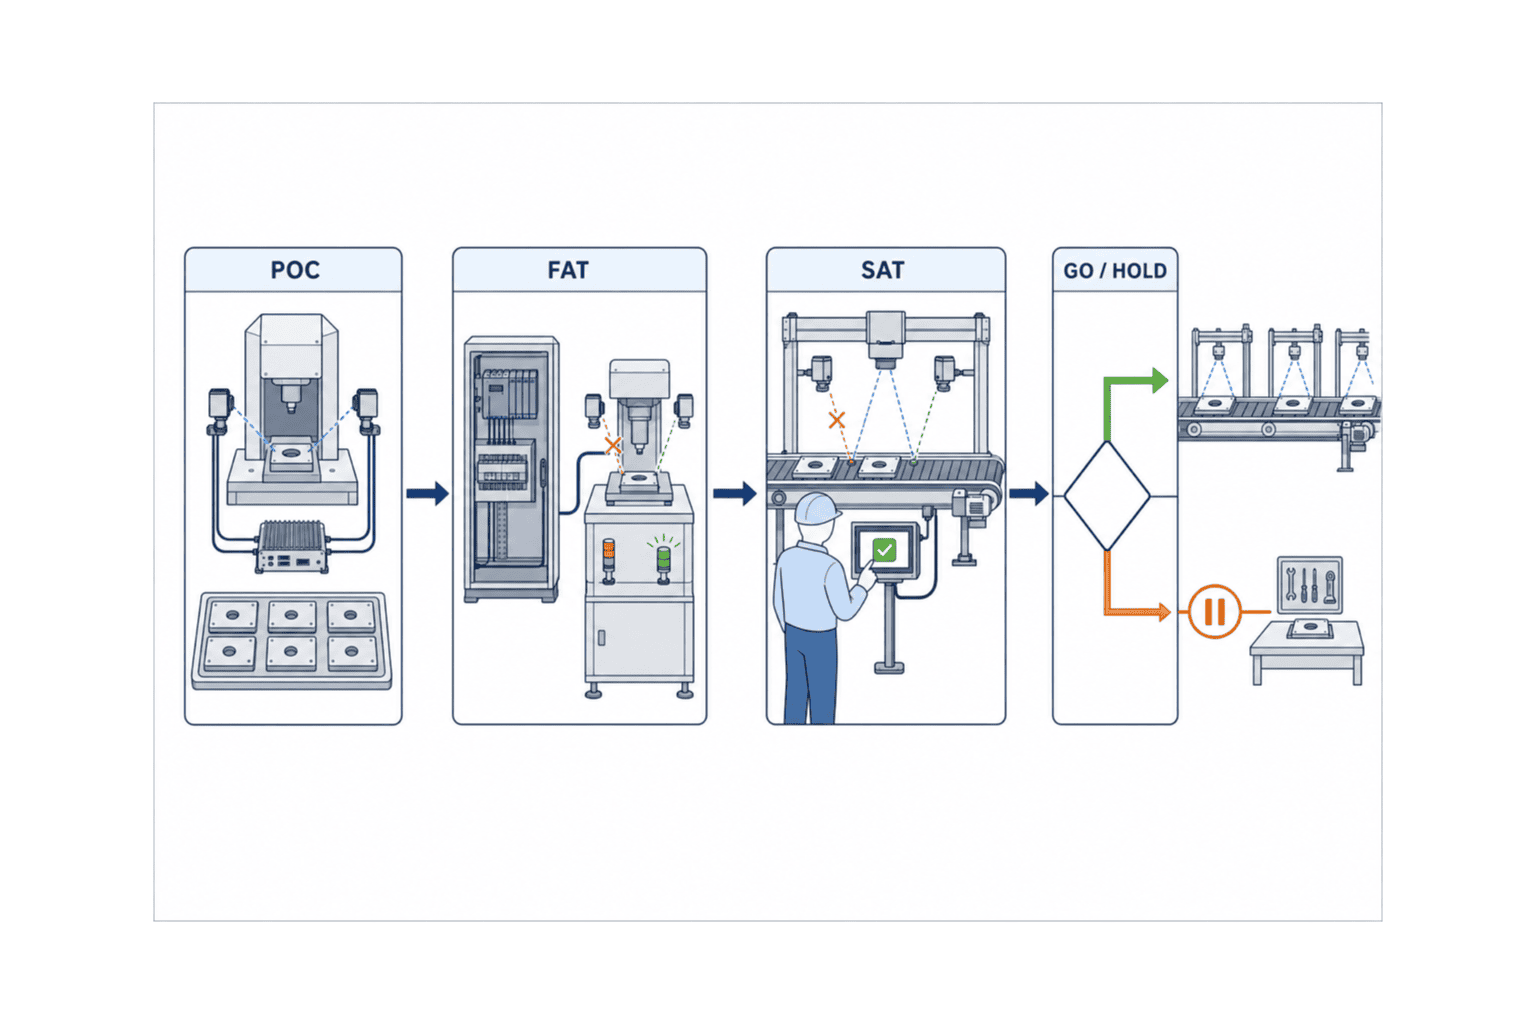
Days 0–15: lock the baseline and acceptance criteria
Observe work, inventory assets and data, interview operators and agree the measurement plan. Capture not only outcome KPIs but also missing data, alarm volume and decision time. If the baseline cannot be reproduced, solve the DATA constraint before feature development.
Deliver a scope diagram, KPI definitions, data dictionary, risk register, test plan and responsibility matrix. Acceptance includes who approves and corrects a value, not merely whether a number appears.
Days 16–35: connect the minimum and design the work
Read existing PLC and machine signals where safe, adding only necessary sensors. Keep the dashboard focused on one decision. Design how an operator receives, checks, decides, records and hands over an alert. Begin training now so operators can correct terminology and alarm priority.
Days 36–55: FAT for normal, abnormal and recovery cases
Simulate missing and duplicated signals, clock drift, network latency, broken sensors and insufficient permissions. For AI, test low confidence, unknown patterns and model unavailability. Confirm that rejected recommendations and reasons are recorded. FAT should reveal manageable gaps before the factory environment, not create an illusion of zero defects.
Days 56–80: SAT under real shifts and variability
Test on the actual line with real products, networks, users and changeovers, including hours with fewer supervisors. Compare sustainability results under equivalent conditions and run planned resilience tests safely. Classify discoveries as defects, change requests or next-phase candidates so acceptance does not expand without control.
Days 81–90: decide GO/HOLD and design scale-out
Score technical performance, work adoption, data quality, economics and operating ownership separately. Conditional GO is valid when remaining issues are controlled. HOLD is appropriate when critical data is missing, workload increases, security remains unresolved or no operating owner exists.
| Gate | Passing evidence | Example HOLD reason |
|---|---|---|
| PoC entry | Scope, baseline, formula, owner | Current value is not reproducible |
| FAT | Requirement tests, logs, recovery | Missing data creates wrong advice |
| SAT | Real-line and real-shift evidence | Workload rises or fallback fails |
| GO/HOLD | Benefit, cost, transfer, open issues | Operating responsibility is unclear |
A fictional cost and ROI model
The following is a completely fictional model for explaining the decision method, not a market quotation or case result. Currency is THB; the period is 12 months; tax, finance, depreciation and working capital are excluded.
| Initial item | Assumption (THB) |
|---|---|
| Three-axis assessment | 180,000 |
| Connectivity and integration | 420,000 |
| Human-centred design and training | 300,000 |
| Energy measurement | 220,000 |
| Resilience design | 280,000 |
| PM and FAT/SAT acceptance | 300,000 |
| Total initial cost | 1,700,000 |
| Annual item | Assumption (THB) |
|---|---|
| Quality improvement | 720,000 |
| Energy improvement | 360,000 |
| Downtime reduction | 480,000 |
| Decision and recording time | 240,000 |
| Gross annual benefit | 1,800,000 |
| Annual operating cost | 360,000 |
| Net annual benefit | 1,440,000 |
Simple payback = initial cost ÷ net annual benefit × 12 = 1,700,000 ÷ 1,440,000 × 12, or about 14.2 months. Avoid double counting. If recovered production time cannot be sold, do not claim both extra revenue and labour savings; use only an attributable, recoverable benefit.
| Scenario | Gross benefit | Operating cost | Net benefit | Simple payback |
|---|---|---|---|---|
| Optimistic | 2,160,000 | 360,000 | 1,800,000 | about 11.3 months |
| Standard | 1,800,000 | 360,000 | 1,440,000 | about 14.2 months |
| Conservative | 1,440,000 | 360,000 | 1,080,000 | about 18.9 months |
The optimistic and conservative cases assume 120% and 80% of the standard gross benefit, with unchanged initial and operating costs. The purpose is to expose the assumption that would trigger HOLD, not to advertise one attractive figure.
Common failure modes
First, buying an “Industry 5.0 system” without measurable requirements makes proposals incomparable. Write the three-pillar outcomes, formulas and evidence first. Second, separate safety, energy and maintenance projects can duplicate sensors, platforms and screens; share asset IDs, time, lot and change control. Third, model accuracy alone does not prove adoption—also measure decision time, alert acceptance, workload, competence and recovery. Fourth, avoid double counting one saved hour as downtime, output, overtime and delivery benefit. Finally, require configuration, data dictionaries, backup, test evidence and administrator training so the factory can perform first-line diagnosis without permanent vendor dependence.
For a staged approach, see our guide to a small-start factory IoT PoC, compare patterns in smart factory case studies, and include role-based capability planning from AI reskilling for Thailand manufacturing.
FAQ: questions about Industry 5.0 implementation
What is Industry 5.0, and how is it different from Industry 4.0?
It uses Industry 4.0 technologies but directs them toward human-centricity, sustainability and resilience, not efficiency alone. It is a European Commission vision and implementation frame, not merely a version number or certification.
Does Industry 5.0 require replacing every machine?
No. Existing PLC signals, external sensors, gateways and MES/ERP can be reused after checking safety, ownership and data quality. Replacement should be justified by the required outcome.
What should appear first in an Industry 5.0 RFP?
Start with the problem, boundary, baseline, outcome hypotheses and acceptance evidence. Then specify integration, data, security, usability, training, FAT/SAT and scale or exit conditions.
How is a 90-day PoC judged?
Judge technical performance, work adoption, data quality, economics and operating ownership separately at PoC entry, FAT, SAT and GO/HOLD gates.
How should ROI be calculated?
Separate initial cost, gross annual benefit and annual operating cost. Net annual benefit equals gross benefit minus operating cost; simple payback months equal initial cost divided by net benefit times 12. Define benefit boundaries to prevent double counting.
What is the difference between FAT and SAT?
FAT verifies functions and simulated failures before site acceptance. SAT proves the system on the real factory line, network, products, shifts and users. Link both to the same requirement IDs.
Conclusion: begin with a small, evidence-based decision
Industry 5.0 implementation is not defined by robot count or AI novelty. Diagnose human-centricity, sustainability and resilience through Data, Operational and Strategic axes; convert the gaps into an RFP; and preserve the same evidence chain through a 90-day PoC, FAT, SAT and GO/HOLD. Reusing existing assets while improving one real decision is a credible way to turn the vision into an investable factory programme.
If you are still defining the scope of a three-axis assessment, an Industry 5.0 RFP or acceptance criteria for a 90-day PoC in Thailand, TOMAS TECH can review the current PLC, sensor, MES/ERP and operating workflow without assuming a particular product. Contact TOMAS TECH.
Sources
- European Commission, Industry 5.0: https://research-and-innovation.ec.europa.eu/research-area/industrial-research-and-innovation/industry-50_en
- European Commission, Human-centric industrial technologies roadmap: https://research-and-innovation.ec.europa.eu/knowledge-publications-tools-and-data/publications/all-publications/industrial-technologies-roadmap-human-centric-research-and-innovation-manufacturing-sector_en
- NECTEC ACE 2026: https://www.nectec.or.th/ace2026/ss28-road-to-industry-5-0/
- NECTEC SMC Academy: https://www.nectec.or.th/news/news-pr-news/smc-academy2026.html
- DIPROM/JICA RISMEP: https://www.dip.go.th/en/category/activity-news/2026-06-29-09-56-25
- NSTDA Practical DX Strategy: https://www.nstda.or.th/en/news/news-years-2026/driving-industry-4-0-readiness-through-practical-dx-strategy.html
- Smart Manufacturing Thailand 2026: https://www.smartmanufacturingthailand.com/en


