


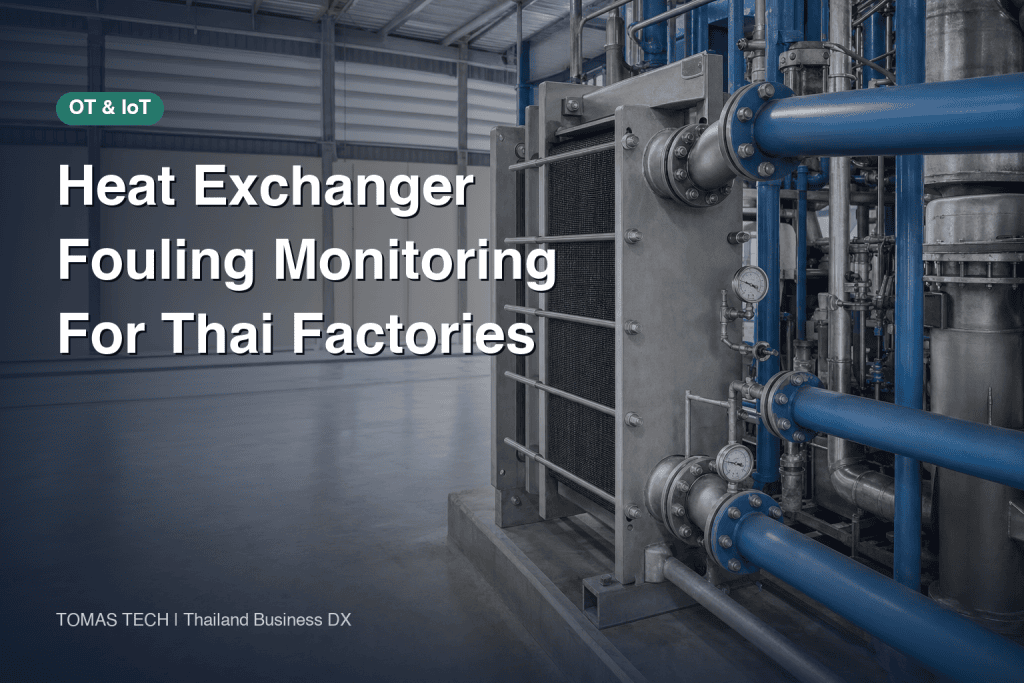
If you want to introduce a fouling monitoring system for heat exchangers, simply deciding to clean “when the outlet temperature rises” is difficult. In factories in Thailand, cooling water temperature varies seasonally, product changes, flow control, and strainer clogging all occur simultaneously. Single alarms based on outlet temperature or differential pressure alone tend to misinterpret normal operational changes as fouling. This article concretizes how to measure the four temperature ports of the heat exchanger, the flow rates of both fluids, and the exchanger body’s differential pressure, and how to compare with healthy conditions to make cleaning decisions—from specification drafting to acceptance inspection.
First, Decide “What Improvement the Monitoring Is For”
A heat exchanger is not just a device to flow cooling water. It is equipment that transfers the required heat quantity from the high-temperature side to the low-temperature side. When fouling accumulates on the heat transfer surface, the heat quantity transferred under the same conditions decreases, and if the flow path narrows, pressure loss increases. Alfa Laval lists the impacts of fouling as decreased thermal efficiency, increased pressure loss, and costs and downtime associated with cleaning. However, the type and manifestation of fouling differ depending on the fluids and structure. It cannot be determined solely by temperature or differential pressure. Source: Alfa Laval “Fouling of heat exchangers”
Before introduction, summarize the monitoring purpose in one sentence. An example is: “Reduce unscheduled cleaning while maintaining product quality, and detect heat exchanger capacity degradation early.” With this purpose, not only the equipment team but also production, quality, and maintenance can agree on alert thresholds and allowable downtime periods. If you start by specifying “predict fouling rate by AI” as a requirement, verification becomes impossible in sites lacking operational history and cleaning records. First, reproducibly compare measurable heat duty and hydraulic resistance under the same operating conditions.
Draw Monitoring Targets and Boundaries on a Diagram
Specify the target heat exchanger’s nameplate number, model, material, design fluids, design flow rates, allowable differential pressure, and allowable temperature. Plate-type, shell & tube, and PCHE exchangers differ in pressure tap locations and cleaning methods. Individual data sheets, General Arrangement drawings, maintenance manuals, and local safety regulations take precedence over general manufacturer materials. Include bypass lines, control valves, strainers, and pumps before and after the exchanger on a single P&ID. Measuring two points across an upstream strainer while labeling it as “exchanger differential pressure” can cause strainer clogging to be misjudged as fouling inside the exchanger. Source: Alfa Laval PCHE Installation, Operation, and Maintenance Manual

Signals Required for Heat Exchanger Fouling Monitoring
The minimum configuration includes the inlet and outlet temperatures on the high-temperature side, the inlet and outlet temperatures on the low-temperature side, at least the flow rate on the side used for heat calculation, and the inlet and outlet pressures of the exchanger body on the side to be monitored. If flow rates on both sides are available, heat balance consistency can be checked. Adding valve opening degree, pump speed, strainer differential pressure, operating mode, product/recipe, and cleaning history helps isolate causes. When using surface temperature sensors, specify installation position, pipe insulation, response time, and contact condition in the installation specifications, and do not assume the same accuracy as immersion thermometers. Emerson also explains monitoring inlet and outlet temperatures as a means to detect fouling signs. Source: Emerson “Heat Exchanger Efficiency Temperature Monitoring”
| Signal | Purpose | Installation and Verification Notes |
|---|---|---|
| High-temperature side inlet/outlet temperature | Confirm heat loss and temperature approach on the high-temperature side | Use values from the same timestamp; align sensor positions and insulation |
| Low-temperature side inlet/outlet temperature | Confirm heat received and cooling capacity | Avoid mixing points and bypass confluence points |
| Flow rate on each side | Correct heat load by operating conditions | Check minimum flow, flow direction, and fluid properties |
| Exchanger body inlet/outlet pressure | Detect body differential pressure and blockage signs | Exclude strainers and valves from the measurement section |
| Valve opening degree and pump speed | Explain flow rate fluctuations | Distinguish between command values and actual feedback |
| Strainer differential pressure | Isolate upstream blockage | Use a separate tag from exchanger body differential pressure |
| Cleaning and water quality records | Verify judgment accuracy | Record values before and after cleaning and cleaning methods |
Adding more sensors does not necessarily improve accuracy. Installation defects such as pressure taps being too far apart, thermometers placed after mixing points, or unsynchronized clocks can invalidate calculations. When reusing existing PLC/DCS tags, verify not only tag names but also units, measurement ranges, calibration dates, missing data codes, and data update intervals on site. Temporary measurements with handheld instruments can confirm the validity of sensor placement before deciding on permanent points. For wireless measurements, include handling of communication outages, battery replacement, and hazardous area compliance in the specifications.
What to Use to Calculate Heat Load
For single-phase fluids with known properties, heat load Q can conceptually be calculated as Q = mass flow rate × specific heat × temperature difference between inlet and outlet. If Q values on the high-temperature and low-temperature sides differ significantly, first check for heat loss, transient states, bypasses, mixing, sensor errors, and assumptions about fluid properties. Do not apply the constant specific heat of water directly to equipment involving evaporation, condensation, phase changes, or large concentration changes. Prioritize manufacturer datasheets and process engineers’ property calculations.
The absolute value of Q alone cannot determine fouling. Q naturally decreases when production load drops. The comparison should be made with Q obtained under equivalent inlet temperature, flow rate, valve state, and operating mode. If possible, calculate expected Q from design or healthy-state models and examine residuals against measured Q. Advanced diagnostics using logarithmic mean temperature difference or overall heat transfer coefficient are possible, but sensor errors have a large impact in regions with small temperature approaches. For initial proof of concept (PoC), always retain raw four-temperature and flow data, not just derived indicators.
Pair Differential Pressure with Flow Rate
Even for the same exchanger, differential pressure increases as flow rate increases. Therefore, judging “differential pressure higher than last month = fouling” is risky. Measure multiple flow points during healthy operation and create a baseline differential pressure curve against flow rate. During operation, compare actual differential pressure with the baseline predicted for the actual flow rate. If fluid viscosity or temperature changes significantly, stratify by those conditions or design corrections. Display valve opening degree and pump speed changes simultaneously. If only strainer differential pressure rises, check the strainer before cleaning the exchanger.
Some fouling causes heat performance degradation without significant differential pressure change, while in other cases, flow path blockage causes differential pressure to rise first. The monitoring screen should display “heat performance degradation,” “exchanger hydraulic resistance increase,” and “upstream strainer increase” as separate signals. Emerson’s heat exchanger application also handles states and alerts including heat load and fouling, but its diagnostic results should not be transplanted unverified to individual equipment. Source: Emerson Plantweb Insight Heat Exchanger

How to Create a Healthy Baseline
A baseline is not simply “entering a single number from the design document and finishing.” Starting from immediately after cleaning or a condition recognized as good by the manufacturer, data should be collected over multiple days within the normal operating condition range. Startup, shutdown, product changeover, CIP (clean-in-place), and times when valves vibrate should be treated separately. Values are aggregated during time windows when temperature and flow are stable, creating multiple operating bands that include seasonal cooling water inlet temperature and production load. Changes in water quality and strainer replacements should be recorded in the history. By recording the date the baseline was created, elapsed time since cleaning, calibration status, and operating recipe, it becomes possible to explain why indicators changed six months later.
Even “immediately after cleaning” does not guarantee a condition equivalent to brand new. Confirm with maintenance personnel the cleaning method, chemical compatibility, gasket and material condition, reassembly status, and presence or absence of residual fouling. Alfa Laval’s advice for plate heat exchangers highlights temperature and flow within design conditions, upstream filters, daily temperature and pressure fluctuations, and CIP. PCHE (Printed Circuit Heat Exchanger) manuals also treat fouling/blockage and strainers separately. Verify procedures with the manufacturer to ensure they fit your specific equipment model. Source: Alfa Laval’s Plate Heat Exchanger Maintenance Advice
The complexity of the model should match the amount of data. At stages with only a few stable operating points, standards by flow range and rules that can be checked by personnel are often sufficient. After accumulating multiple years of cleaning history and seasonal variations, expand to physical or statistical models. It is important that the predictive model can explicitly indicate out-of-range conditions, missing data, or sensor failures. Do not assume “no data means no fouling.”
Variations to Watch for in Thai Factories
In Thailand, cooling water sources, ambient air, load, and factory operating calendars vary. Do not decide corrections based solely on terms like “season” or “rainy season”; instead, record actual inlet temperature and water quality. Even on the same production line, cooling requirements change if export product types or production speeds change. Confirm with manufacturing whether the comparison is made under the same recipe. After a shutdown, check for stagnant water, air, and strainer condition. Recording actual operating conditions as tags is a shortcut to avoiding excessive cleaning proposals.
If you want to detect abnormal flow or leaks in existing cooling water piping, see Factory Cooling Water Leak Detection and Flow Monitoring. This article focuses on heat transfer and pressure drop diagnostics of individual exchangers, not the entire piping network. When investigating the possibility that corrosion products contribute to fouling, the water quality and piping maintenance concepts in Industrial Pipe Corrosion Monitoring are also useful. Confirming corrosion causes requires water quality analysis and physical inspection.
How to Differentiate Fouling from Heat Exchanger Pressure Drop and Temperature
For on-site primary diagnosis, a short checklist is easier to use than a complex score. Check in order: ① Are operating conditions comparable? ② Are sensors healthy? ③ Is thermal performance below baseline? ④ Is the exchanger’s residual pressure drop high? ⑤ Is there an explainable change in strainers or valves? When thermal performance and pressure drop both worsen simultaneously and cannot be explained by changes in flow, water quality, or valves, suspect fouling inside the exchanger. If only one worsens, broaden the list of possible causes.
| Observation | First Inspection | Next Action |
|---|---|---|
| Thermal performance decrease, exchanger pressure drop increase | Flow, fluid properties, measurement points, valves, strainers | Plan maintenance and physical inspection as fouling suspected |
| Thermal performance decrease, pressure drop nearly unchanged | Inlet temperature, load, thermometers, heat transfer surface | Compare under same conditions and calibrate; evaluate cleaning candidates |
| Pressure drop increase, thermal performance nearly unchanged | Flow, viscosity, air presence, partial blockage | Investigate hydraulic causes and check margin |
| Only strainer pressure drop increase | Filter pressure drop, bypass status | Inspect strainers; no urgent exchanger cleaning needed |
| Sudden step change | Sensors, valves, pumps, product change | Cross-check event history and field instruments |
For example, if the cooling water outlet temperature rises, but the inlet temperature also rises simultaneously, fouling inside the heat exchanger alone may not be the cause. Possibilities include reduced production-side flow, throttled cooling water valve, or a displaced temperature sensor. Conversely, if outlet temperature on the hot side gradually rises within the same operating band and the exchanger’s residual pressure drop continues to increase, prioritize physical inspection. Record the basis and unconfirmed items in the judgment record rather than stating “fouling confirmed.”
The composition of fouling is also important. Alfa Laval distinguishes between precipitated salts, suspended solids, organics, corrosion, and biological fouling. Temperature and pressure drop trends alone cannot identify the composition. Confirm causes by combining water sampling, water quality, filter catch, open inspection, and post-cleaning performance recovery. Chemical selection and CIP conditions depend on material, gasket, product-side hygiene and quality requirements, and wastewater treatment. Instrumentation systems support cleaning decisions but do not automatically determine cleaning methods.

How to Determine the Cleaning Timing for Heat Exchangers
Before deciding on a single alarm threshold, organize three limits. First, the upper limits of product quality and process temperature. Second, equipment limits such as pump capacity and allowable differential pressure. Third, the cost of shutdown and cleaning and the available days for work. If close to safety or quality limits, follow procedures without waiting for economic calculations. If there is margin, plan by observing the rate of decline in monitoring indicators, the next scheduled maintenance date, and the improvement results before and after cleaning. Specific thresholds should be determined based on equipment data and approval from the operations department; do not copy numbers from other companies’ cases.
The recommended operation is two-tiered. At the caution level, verify comparison conditions and measurement integrity, inspect strainers, water quality, and valves, and record candidate causes. At the response level, reconfirm the margin of process capability and differential pressure limits, and include cleaning candidates in the maintenance plan. Confirm whether the issue reproduces over continuous time windows, and do not issue stop instructions based on momentary noise. After cleaning, record how much heat duty (Q) and differential pressure have recovered under the same operating conditions. If recovery is insufficient, consider causes other than fouling, incomplete cleaning, or measurement errors.
Cost-effectiveness separates hypotheses from actual measurements. The evaluation table should include instrument, installation, connection, and maintenance costs; cleaning labor, chemicals, and downtime; quality losses; and additional electricity or heat source consumption. Do not guarantee “X% energy reduction” by monitoring introduction alone. Calculate differences from actual measurements aligned with a baseline year and production volume. In plants with frequent low-load operation or standby unit switching, the value may lie more in advancing shutdown planning than simply reducing the number of cleanings.
Evidence to Record in Operation Logs
For each diagnosis, include date and time, target equipment, product and operating mode, inlet conditions, flow rate, four temperatures, main unit differential pressure, strainer differential pressure, valve opening, comparison baseline operating period, data quality, decision maker, and next confirmation date. When cleaning is performed, link the method, cleaning liquid and duration, appearance, replaced parts, and post-cleaning re-measurements. Having logs that can later explain “why cleaning was done” enables improvement of monitoring rules. Changes in tag digits or units should also be recorded in the same log. If paper records and maintenance systems are separate on site, at minimum ensure cross-referencing by equipment ID and date/time.
Heat Exchanger Monitoring System Configuration and Data Design
The basic configuration is: field instrumentation → PLC/DCS or edge data collection → historical database → diagnostic screen and notifications. Do not confuse safety control or interlocks with analysis for maintenance decisions. When reading from existing control systems, decide with equipment managers on readout scope, network segmentation, and behavior during communication loss. Because instantaneous field values alone make reproducing operating conditions difficult, save raw data with timestamps and quality flags. Time synchronization, sampling intervals, and aggregation windows should be determined based on temperature response times and speed of operational fluctuations.
On the screen, rather than simple red/yellow/green fouling judgments, display four temperatures, each flow rate, measured heat duty (Q), reference baseline Q, main unit differential pressure and expected differential pressure, strainer differential pressure, valve opening, and cleaning events side by side. It is important that users can verify the basis for decisions on a single screen. Do not display “no comparison baseline,” “calibration expired,” or “flow outside applicable range” as normal green. Notifications should include estimated cause, confirmation procedures, equipment ID, and change start time. If notification volume becomes excessive, review monthly whether it led to actual maintenance actions.
Data access rights should be clarified at order placement. Confirm who can change thresholds, whether change histories before and after are recorded, if raw data can be exported as CSV, and if local screens remain usable when cloud services are down. For multinational plants, it is practical to use English common IDs for equipment tags, Thai for field procedures, and Japanese/English for management summaries. Do not instruct safe operation based solely on translated alarm messages; link alarms to formal procedure manuals.
Items to Include in RFP and Comparing Quotes
Do not write only “visualize heat exchanger fouling with AI” in the request for proposal. Attach target equipment, drawings, design conditions, fluids, existing instruments, tag lists, sampling and retention periods, IT/OT connection constraints, scope of local work, hazardous areas, allowable downtime, and required languages. Ask vendors to specify additional sensor measurement points, installation methods, calibration, scope of existing signal use, formulas or concepts for derived indicators, handling of missing or abnormal values, and responsibility for alarm tuning. Black-box scores alone make acceptance and operational improvement difficult.
| RFP Item | Vendor Confirmation Items | Acceptance Evidence |
|---|---|---|
| Measurement Scope | Where to measure four temperatures, flow, main differential pressure, auxiliary tags | P&ID, instrument list, site photos |
| Calculation Logic | How heat duty and reference differential pressure are compared | Calculation specifications and sample data |
| Out-of-Condition Handling | Handling of shutdowns, valve changes, missing data, calibration failures | Test cases and screen displays |
| Alarms | Threshold setters, rationale, history, notification recipients | Change logs and notification tests |
| Maintenance | Calibration, sensor replacement, backups, support | Procedures and training records |
| Costs | Separate instrument, wiring, construction, licenses, and operation | Detailed quotes and warranty scope |
When comparing prices, include not only initial costs but also instrument calibration and replacement, data communication, maintenance contracts, licenses, installation downtime, and sensor spares. Compare how data quality changes between proposals using existing instruments and those installing new ones. Rather than quoting simple indicative prices, determine required quantities from P&ID and instrument registers to reduce errors. If monitoring multiple units, confirm whether types and fluids are the same and avoid applying uniform thresholds indiscriminately.
Items to Confirm in FAT and SAT
FAT (Factory Acceptance Test) is for function verification before shipment; SAT (Site Acceptance Test) is for acceptance after onsite installation. In FAT, reproduce calculation inputs and outputs with known data, test unit conversions, zero flow, temperature reversals, missing data, time shifts, fixed sensor values, and sudden valve changes. While simulated fouling values alone do not prove “correct diagnosis,” at least confirm no false positive alarms under out-of-condition scenarios. Also test screen displays, operation permissions, alarm histories, and CSV exports.
In SAT, start by physically verifying wiring and tags. Confirm inlet/outlet of four temperatures are not reversed, pressure taps do not cross strainers, flow units and directions match, and sensor timestamps are synchronized. Collect data over multiple stable operating periods and compare field instruments with system values. Agree on baseline data collection conditions immediately after cleaning, then evaluate false alarms and misses over several weeks of actual operation and adjust thresholds. Upon handover, receive P&ID, tag dictionaries, calculation specifications, backup methods, and training records for maintenance personnel.
Test values used should be decided based on project-specific tolerances. Even if demo data inputs a 20% heat duty drop, that does not define the cleaning threshold for that equipment. Fix acceptance criteria in writing considering actual equipment quality limits, pump margins, and instrument uncertainties. Include onsite tests after operation start in the contract scope, with signatures not only from vendors but also production, maintenance, and instrumentation representatives.
Measurement Plan for the First Unit Before Implementation
Do not monitor multiple heat exchangers simultaneously at the start. Instead, select one unit that has a significant impact on production and whose operating conditions and maintenance history can be tracked. When comparing candidate units, create a table including equipment ID, model, heat medium, product-side quality constraints, existing sensors, cleaning cycle, allowable downtime, and past malfunctions. Rather than simply choosing the most visibly fouled unit, select one where measurement points can be increased and pre- and post-cleaning verification can be performed, making it suitable for a proof of concept (PoC). If safety constraints prevent adding pressure taps, adjust goals accordingly based on those limitations. Do not promise diagnostic results prematurely.
During on-site surveys, compare drawings with the actual equipment, and verify in order: flow path, pumps, strainers, control valves, bypasses, and instrument taps. Even if an instrument tag reads “inlet temperature,” it may be attached to a common header after merging. Thermometers can be affected by pipe heat loss or insulation; differential pressure gauges can be affected by clogged impulse lines; flow meters’ results can be influenced by straight pipe length and fluid conditions. Record the installation locations of existing tags with photos and P&IDs, and categorize signals into usable, conditionally usable, and those requiring addition. Confirm pressure, temperature, and material restrictions specified by the equipment manufacturer at this stage.
For the initial measurement plan, collect data at least during normal load and low load, on days with different cooling water inlet temperatures, and during periods when valve openings are stable. The required stabilization time depends on the equipment’s thermal capacity and instrument response. Synchronize measurement times and record events such as whether the equipment was still starting up, if the bypass was open, or if product switching occurred. If similar operating conditions can be captured immediately before and after cleaning, it facilitates performance recovery confirmation. If conditions cannot be matched, record temperature, flow, and production load together, and do not treat simple before-and-after comparisons as results.
Assess Raw Data Quality First
Before applying diagnostic logic, implement quality checks to detect zero flow, sensor disconnection, stuck values, time shifts, unit changes on the same tag, negative differential pressure, and large heat balance discrepancies. When missing data is supplemented with previous values, record this fact and exclude such data from cleaning decision criteria. When calculating averages on summary screens, do not use averages that mix downtime or abnormal values. If the direction of the temperature difference between the hot and cold sides contradicts the drawing, first suspect sensor swaps or tag misassignments. No matter how advanced the algorithm, if the input data is corrupted, the diagnosis will be invalid.
Instrument uncertainty has a greater effect when dealing with small temperature differences. If the temperature difference is on the order of sensor error, do not overtrust changes in calculated heat load or heat transfer indicators derived from that difference. Include baseline variability, sensor calibration values, flow meter accuracy, and fluid property assumptions in acceptance testing. Request vendors not only to display indicator changes but also to specify conditions under which “diagnosis cannot be made” for certain operating conditions. Even if estimated values are shown with decimal precision, cleaning decisions cannot be made more finely than the measurement certainty allows.
Diagnosis and Next Steps by Case
Case A: Only cooling capacity slowly declines. Despite the same product and flow range, the hot side outlet temperature rises, and even considering the cooling water inlet temperature, the expected heat load is not met. The main unit differential pressure does not change significantly. In this case, consider thin fouling on heat transfer surfaces, temperature sensor drift, flow path bypass, and product-side condition changes. Verify temperature sensors physically and check heat balance, comparing water quality and cleaning history. Do not rule out fouling just because differential pressure remains unchanged.
Case B: Only differential pressure suddenly rises. First, check actual flow rate, viscosity, and temperature. If strainer differential pressure or pump speed also rises simultaneously, suspect upstream debris capture or operating point changes. If only the main unit differential pressure rises stepwise, consider local flow path blockage, air ingress, valve or pressure gauge abnormalities as candidates. Do not display “fouling” as a single word on alarm screens; instead, indicate inspection order. When differential pressure approaches safety limits, prioritize operational procedures over root cause analysis.
Case C: Both thermal performance and differential pressure deteriorate simultaneously. If the compared load range is the same, sensors and strainers show no abnormalities, and the trend continues, fouling inside the unit is a high priority. Maintenance personnel should prepare for the next shutdown opportunity, cleaning methods, required materials, and post-cleaning performance measurements. However, even this combination does not determine fouling composition. Verify hypotheses through water quality and physical inspection, and recovery after cleaning. Before choosing expensive chemical cleaning, confirm methods approved by the manufacturer and material compatibility.
Case D: Indicators do not recover after cleaning. Investigate not only cleaning quality or residue but also sensor replacement offsets, fluid condition changes, bypass leaks, and plate damage. Registering post-cleaning values unconditionally as new healthy baselines risks incorporating actual degradation into the baseline. Cross-check maintenance records and operating conditions, and if necessary, seek reevaluation from the manufacturer or equipment designer. This verification is essential for improving rules after monitoring implementation.
Conditions for Accepting “Monitoring Capability” in Estimates
The phrase “real-time monitoring support” in proposals alone is insufficient for comparison. At minimum, clarify which instrument values are collected at what intervals, under which conditions diagnosis is deferred, who manages thresholds, and on which screens the field can view the basis for decisions. Confirm whether heat load and differential pressure residual calculation specifications are deliverables, whether recalibration is possible after equipment replacement, and whether raw data can be exported in CSV or similar formats. Even if vendors use proprietary models, input signals, output meanings, application scope, and change history must be clearly documented.
In test planning, separate FAT simulated data from SAT actual measurement data. Even if screens and calculations work correctly in FAT, installation defects of temperature sensors on site cannot be detected. Even if a day of normal operation is visible in SAT, seasonal differences and pre/post-cleaning behavior cannot be proven. Contracts should specify initial acceptance and threshold adjustment and training after reviewing a certain period of operational data as separate milestones. Rather than “detecting a certain number of anomalies,” acceptance criteria should include handling of out-of-test conditions, traceability of raw data, and reproducibility of procedures by operators.
The final deliverables should include sensor-attached P&IDs, tag and unit dictionaries, calibration records, baseline curve creation methods, exception handling tables, alarm response procedures, FAT/SAT results, and pre/post-cleaning comparison formats. With these, even if personnel change, the reason for selecting cleaning candidates can be traced. Heat exchanger monitoring is not just delivering a dashboard; it is an ongoing operation to verify whether maintenance has improved.
FAQ: Common Questions About Heat Exchanger Fouling Monitoring
Can fouling in a heat exchanger be detected by differential pressure alone?
Differential pressure varies with flow rate, viscosity, and valves or strainers in the measurement section. Changes in the main body differential pressure normalized by flow rate can indicate blockage, but fouling on the heat transfer surface may appear first. It is best to evaluate heat duty by combining four temperature measurements and flow rate.
Are four temperature sensors necessary?
Having inlet and outlet temperatures for both fluids makes it easier to analyze heat balance and approach temperature. If there are constraints with existing instruments, a provisional setup focused on specific objectives is possible, but the diagnostic limitations and risk of misjudgment must be clearly stated. Do not rely on a single outlet temperature alone to confirm fouling.
At what percentage of performance degradation should heat exchanger cleaning be scheduled?
There is no universal figure. The decision depends on quality limits, fluid properties, pump margin, manufacturer’s allowable differential pressure, cleaning costs, and planned shutdowns, varying by equipment. First, measure the variation and instrument uncertainty during healthy operation, then establish two alert levels: caution and action.
Can retrofit monitoring be done using only the existing PLC?
It depends on the measurement locations and quality of existing tags. If four temperatures, flow, and main body differential pressure are not all available, additional instruments will be required. Separate the reading into the PLC and changes to safety control, and agree on the scope of connection with the equipment manager.
Is AI diagnosis necessary from the start?
If cleaning history and operating conditions are insufficient, first create interpretable baseline curves and on-site judgment tables. Once data accumulates, test predictive models and indicate when conditions are outside the applicable range or data is missing. Connect the final diagnostic decision to maintenance and production procedures.
Summary
The core of a heat exchanger fouling monitoring system is comparing four temperatures, flow, and main body differential pressure under the same operating conditions against healthy baselines, while isolating changes caused by strainers or valves. Cleaning timing should not be based on a single sensor value but on quality and equipment limits plus shutdown planning. In RFPs, specify measurement points and diagnostic logic, and verify out-of-condition handling and field wiring during FAT/SAT to facilitate linking monitoring screens to maintenance decisions.
If you have the target heat exchanger’s P&ID, existing tags, and recent cleaning records, you can start by organizing measurement points and healthy baselines. Even at the specification stage for retrofit monitoring in Thai factories, please consult TOMAS TECH.
Reference Information
- Alfa Laval, Fouling of heat exchangers: an overview (Mechanisms and effects of fouling)
- Alfa Laval, PCHE & Hybloc Installation, Operation and Maintenance Manual (Equipment-specific conditions, strainers, operation and maintenance)
- Alfa Laval, Ten top tips for gasketed plate heat exchangers (Temperature and pressure checks, filters, CIP)
- Emerson, Plantweb Insight Heat Exchanger Application (Heat duty and fouling condition monitoring)
- Emerson, Heat Exchanger Efficiency Temperature Monitoring (Signs from inlet and outlet temperatures)
- Alfa Laval, Packinox Performa service leaflet (Example of using performance data for maintenance decisions)


