



In a factory in Thailand, sensors have been added and temperature and pressure now appear on the screen. But when a quality audit asks, “Please explain the 30 minutes when the value stopped during heating for this lot,” nobody can answer. When implementing factory sensor data loss prevention, success or failure is determined not by whether communication worked, but by whether you can count the records you expected, identify why any are missing, and reconcile the records after recovery. This article does not focus on sensor types or the path used to extract values from the PLC. Instead, it focuses on the requirements written at order placement and the factory acceptance tests.
Before Writing “Zero Missing Data” into the Contract, Decide What Is Missing
Do not evaluate a device that acquires temperature every second and a device that notifies only when the value changes using the same “one record per second” standard. For the former, any missing record in the expected slots during operating hours is a candidate for missing data. For the latter, no record during a period of no change is normal, and you need separate observations such as notification sequence numbers, communication session status, and periodic keepalives. An evaluation that ignores the measurement method and says “more received records is always better” will favor implementations that resend duplicates.
First, write into the data ledger “when and how many records are expected” for each data item. Fixed cycle, on change, equipment event, or manual entry? Exclude equipment downtime from the denominator? Treat startup, cleaning, and product changeover separately? Should the point at which missing data is judged in near real time be separate from the point at which delayed arrivals are allowed to settle and the result becomes final? These are not initial system settings. They are operational conditions that the quality department and the shop floor must agree on.
For example, if you decide that “temperature is recorded every 10 seconds while running,” the expected count for one hour is 360. If only 342 records are visible on the receiving side, the provisional completeness is 342 ÷ 360 = 95%. However, 18 records may still remain at the edge device and arrive later in full. If you record “provisional completeness” and “final completeness” separately, you will not confuse a communication outage with permanent data loss. This figure is an explanatory example and is not a pass/fail threshold that applies to every factory.
Break Factory Sensor Data Loss Into Six Stages
Even though the path from sensor to dashboard looks like one communication route, there are actually multiple failure points. The measurement itself failed; the PLC or logger measured it but the gateway missed it; the gateway received it but could not write it to the buffer; it is in the buffer but cannot be sent; it was sent but rejected by the receiving side; it was stored but does not appear on the aggregation screen. These are the six stages. In the last case, the raw data exists, so this is more a display or retrieval problem than missing data. If you turn the whole process into one “missing rate,” it becomes impossible to know who should fix it.
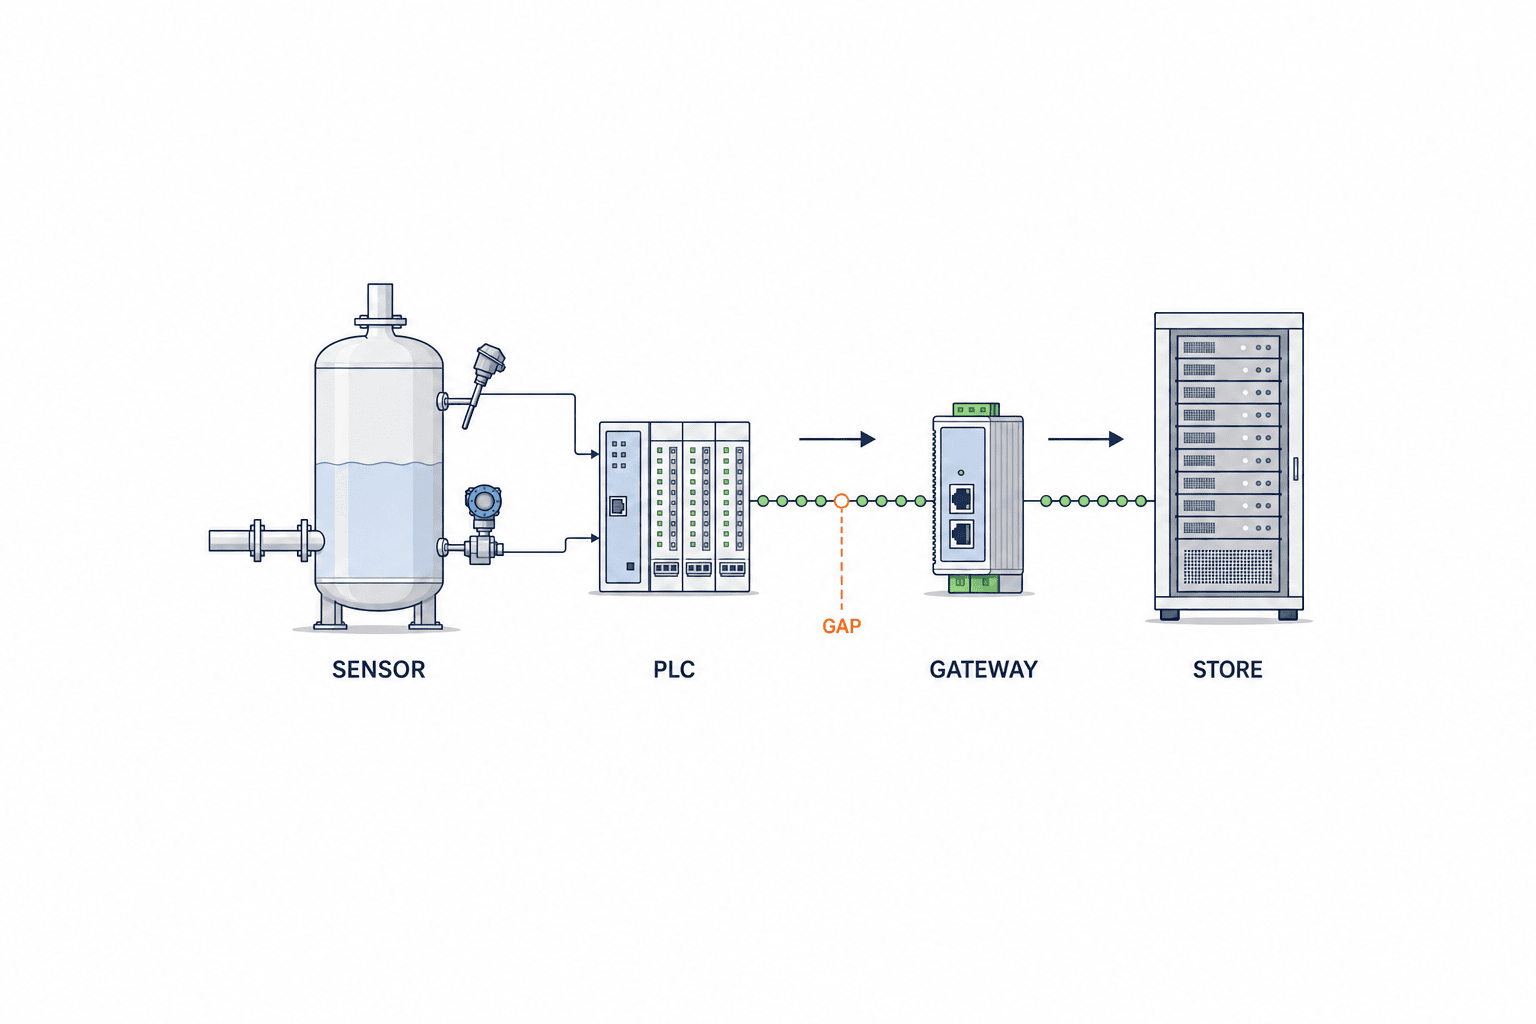
The minimum elements needed for one record are an ID that identifies the equipment and tag, the value and unit, the measurement time, the reception time, the quality status, and the key that identifies the original event. If the equipment can output a sequence number, record it and use it to identify duplicates when the same sequence number is resent. For devices that cannot output sequence numbers, source ID and measurement time alone may not guarantee uniqueness because multiple events can occur within one cycle. Decide the appropriate key after checking the device specification and the target data.
OPC UA DataValue handles not only the value but also the StatusCode and time, and its specification includes notifying condition-dependent loss from the monitored item queue with the Overflow bit. Therefore, the receiving side should not store only the value and discard quality information. However, the absence of Overflow does not prove end-to-end losslessness from the sensor to the final storage. There are other failure points before and after the monitored item queue. Obtain counters and logs at each boundary according to the specification and narrow down the fault location. The OPC UA DataValue and MonitoredItem queue specification are the starting points for this verification.
Measure Data Completeness, Delay, and Quality Separately
When estimating a missing data countermeasure, a single line such as “99.9% availability” is not enough to make a judgment. Equipment uptime, network connectivity rate, and record completeness against expected slots are different things. The buyer should define the following four items for each target tag.
- Provisional completeness: Valid unique records that arrived by the observation deadline ÷ expected count. This checks whether they are usable immediately on the shop floor screen.
- Final completeness: Valid unique records that could be reconciled after the recovery grace period ÷ expected count. This checks whether they can be used as quality or audit records.
- Arrival delay: Reception time − measurement time. Look not only at the median but also at the upper tail of the distribution to see whether the data arrives in time for alerts or decisions.
- Quality rate: Counts separated into Good, Uncertain, Bad, estimated, and manually corrected. This checks whether the number exists but cannot be trusted.
If the definition of “valid unique records” is vague, Bad-quality values and resent duplicates will also be included in the numerator. Interpolated values for missing intervals are useful for analysis, but they must not be turned into measured values. Keep raw data, estimated values, and manually corrected values separately with quality flags and audit history. Historian products also keep value, quality, and time as a set, and the number of stored records changes depending on recording mode and deadband. Even if points appear smoothly connected on the screen, that does not mean raw records existed at regular intervals. The Ignition Tag Historian description makes this distinction explicit.
Here is one calculation example. If a machine runs for 8 hours at a 10-second cycle, the expected count is 2,880 records. At the deadline, 2,840 records have arrived, of which 10 are duplicates and 5 are Bad quality. If the contract excludes Bad records, the valid count is 2,825 and provisional completeness is about 98.09%. If 40 more records arrive later and 6 of them are resends of the same events, the net increase is 34. The final valid count becomes 2,859, and final completeness becomes about 99.27%. Which number to use in the contract should be decided by use case. Quality assurance records and energy-saving trend analysis do not necessarily have the same acceptance criteria.
Design Time Handling by Separating “When It Was Measured” and “When It Arrived”
To correctly arrange records that arrive later, save both the measurement time and the reception time. If you only know the time when the gateway read the sensor, do not pretend that time is the measurement time. Clearly label it as the “gateway observation time.” Also include the source of the clock, synchronization method, time zone, allowable error, and how synchronization failures are handled in the tag ledger. If a factory in Thailand and headquarters in Japan share screens, normalize stored times to a single basis such as UTC, then convert them to local times on display for easier reconciliation. However, before forcibly changing the time on existing equipment, check the impact on the control side.
If timestamp accuracy is only one second, you cannot discuss the order of events that occur every 100 milliseconds. Conversely, there is no need to unconditionally introduce an expensive time distribution architecture for temperature monitoring that is sufficiently handled at the second level. Determine the necessary resolution from the engineering question. “Investigating the order before and after an abnormal shutdown,” “proving the temperature holding time of a sterilization process,” and “linking inspection values to a product lot” each require different time information and allowable delays. The design of time synchronization itself is a separate topic, but in this article the origin of time is incorporated into missing-data judgment and acceptance testing.
When a record arrives late at the receiving side, it is important not to rewrite the original measurement time. The successful resend time remains as the reception time. If you can trace it as “measured at 14:00, arrived at 14:37,” you can treat it as a record for the 14:00 hour while also explaining the fact that it was absent from the provisional screen for 37 minutes. Because the difference between the two timestamps alone cannot distinguish clock drift from communication delay, you also need to record synchronization status.
Design the Edge Buffer Around Recovery Procedure, Not Just Capacity
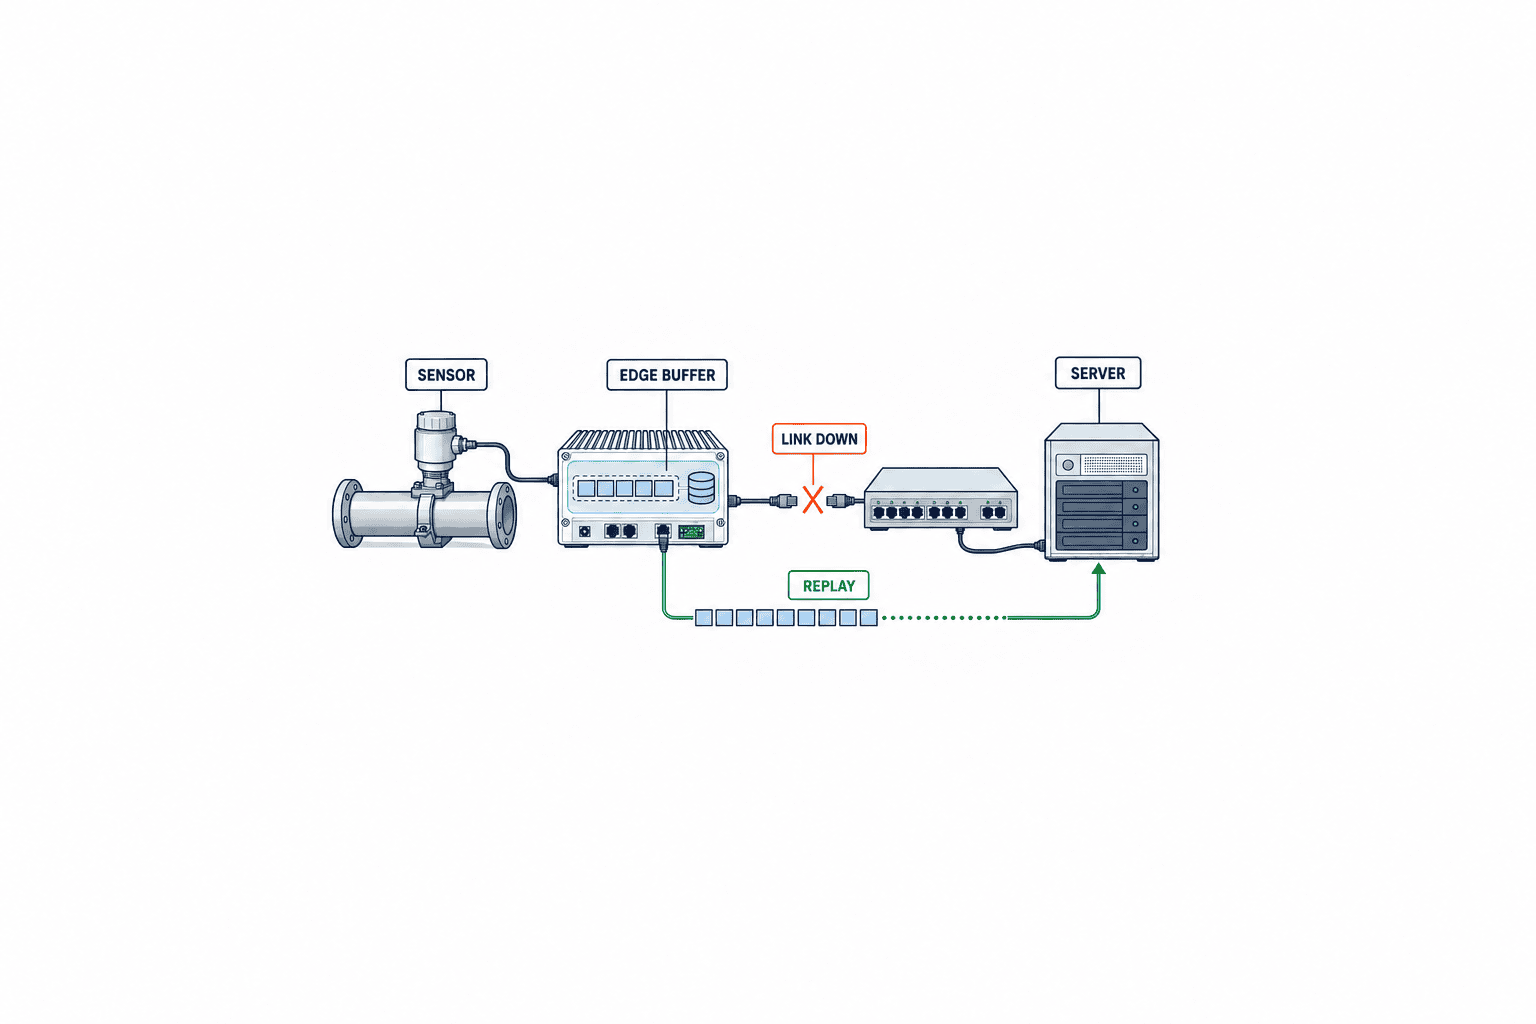
When you see a proposal that says “saved even during communication loss,” confirm not only where it is stored, but for how many hours, how many records, in what order, and what is discarded when the disk is full. A buffer using only volatile memory may be lost on reboot. Even if data is retained on disk, capacity, write endurance, access rights, encryption, recovery from corruption, and behavior during power loss remain. If high-priority tags are sent first, the delay for low-priority tags increases, so priority rules must also be stated clearly.
The minimum form for capacity estimation is “average record size × records per second × retention seconds.” For example, at 200 bytes per record, 50 records per second, and 24 hours of retention, raw data alone totals 864 MB. In actual implementation, indexes, file format overhead, journals, reserved space, and newly arrived records during resend add to this, so this figure must not be used as the disk capacity as is. Correct the estimate using measured write volume and recovery bandwidth. Even if you can store 24 hours’ worth, backlog will not disappear if you can only output at the same rate as normal inflow. Calculate the time needed to catch up using the net processing capacity after subtracting normal inflow from recovery bandwidth.
AWS IoT Greengrass Stream Manager includes settings for stream persistence, size and retention period, and behavior during disconnection. This is an example of features available in a product and does not mean that every site automatically recovers all records. Test the configuration values, target streams, receiving-system capacity, and edge-device failures together. You can use the AWS Stream Manager documentation as a reference in a comparison table.
In Retransmission, Separate “At Least Once” from “No Duplicates”
It is natural for the sender to retransmit the same data when the network reconnects. If communication is cut before the receiver returns an acknowledgment after saving, the sender does not know whether it was stored and retransmits. Therefore, even if a delivery method is called “exactly once,” you cannot claim zero duplicates from sensor measurement to the final analysis table. Specify where acknowledgments are returned, what is regarded as the same event by the identification key, and how to handle reordered retransmissions.
For duplicate elimination, prioritize the original event ID and version, and do not double count if the same key has the same content. If the same key has a different value, do not overwrite silently. Isolate it as a conflict and notify the responsible person. If corrections are allowed, keep the original value, corrected value, reason, operator, and time in the history. Also define how period aggregates are recalculated. When a late-arriving value comes in after the deadline, the previous day’s average, maximum, and deviation count may change.
If the sensor does not output an event ID, check whether the gateway can assign a persistent sequence number at the moment of reading. If the sequence number resets to 1 after a gateway reboot, combine it with a boot ID or similar identifier. Using only the sensor value and time as a key may incorrectly classify a normal measurement with the same value continuing over time as a duplicate. This is not something to settle with one short line in the software specification. It is the part that needs a test case using sample data.
Write the “Data Contract” Before the Product Name in the RFP
In a request for proposal (RFP), saying only “We want to introduce an IoT platform” will cause each vendor to propose based on different assumptions. Make the proposals comparable by providing a draft tag ledger, fault scenarios, decision formulas, and responsibility boundaries. First narrow the scope to one line and a few tags, and attach the following items as a table.
- Target and use: The buyer should write the equipment ID, tag, unit, process, link to lot, and who uses it and for what. The proposer should answer the supported scope and any required modifications.
- Expected events: The buyer should write whether it is fixed cycle or on change, the operating calendar, and how expected count is calculated. The proposer should answer the actual acquisition method and its constraints.
- Time and quality: The buyer should write the time source, synchronization, and how Bad, Uncertain, estimated, and manually corrected records are handled. The proposer should answer which items are stored and how they propagate.
- Faults and recovery: The buyer should write the assumed duration of communication loss, reboot, disk full, and destination stop. The proposer should answer buffer capacity, discard order, and how long it takes to catch up.
- Acceptance judgment: The buyer should write the conditions for provisional and final completeness, delay, duplicates, and audit logs. The proposer should answer the FAT/SAT procedures and the evidence format.
- Operational responsibility: The buyer should write the alert recipients, corrective-action deadline, and change approval. The proposer should answer monitoring items, maintenance boundary, and cost.
Agree on what to compare the expected count against before collecting proposals. For example, the denominator for 24 hours including night shutdown and the denominator for only the actual 8 operating hours will make the same system look different in completeness. If you leave this entirely to vendors, their numbers will not be comparable. Put sample calculations in the appendix to the decision formula so the implementation side can reproduce the same result.
Estimates should not only separate sensor, wiring, gateway, communication, storage, dashboard, and maintenance. They should also explicitly show the effort for fault testing and for creating the data contract. A low-price proposal that leaves out the latter carries the risk that later “missing data is outside the scope.” If you want to organize the connection routes to existing equipment and the estimate of tag count first, refer to Four PLC data collection routes. The acceptance criteria in this article are applied after selecting that route.
In FAT, Collect Evidence for “When It Breaks,” Not Just for “When It Works”
Create the Master Copy of Test Data First
Before starting FAT, freeze the planned inputs in a hard-to-modify format such as CSV and record the test instrument’s setting number and time reference. Counting only the receiving side does not tell you whether the input side occurred as planned. For a fixed-cycle test, create a list of planned slots for each equipment ID and tag. For on-change notifications, create the order of value changes and the list of events that should be sent. If you can join the master input file, edge receipt log, and final storage export using the same key, you can identify the loss point stage by stage.
If a person performs manual operations during the test, record those operations as events with timestamps as well. If the “supposed cut-off time” differs from the actual time when the network device disconnected, the calculation of expected count changes. In tests where time synchronization is lost, do not use the wall clock display as the basis for matching; instead, align counts using the test instrument’s monotonically increasing numbers. If you need to reinterpret the time after the clock is restored, define the correction rule in advance.
Do not reduce the pass/fail decision to one overall score. For example, “All original events remained after a 20-minute communication outage, but the 95th percentile delay after recovery exceeded the requirement” means completeness passes but delay fails. Also, “All records arrived but some were counted twice” means delivery succeeded but aggregation failed. If each fault is evaluated separately for function, completeness, delay, quality, and auditability, it becomes clear what needs to be fixed.
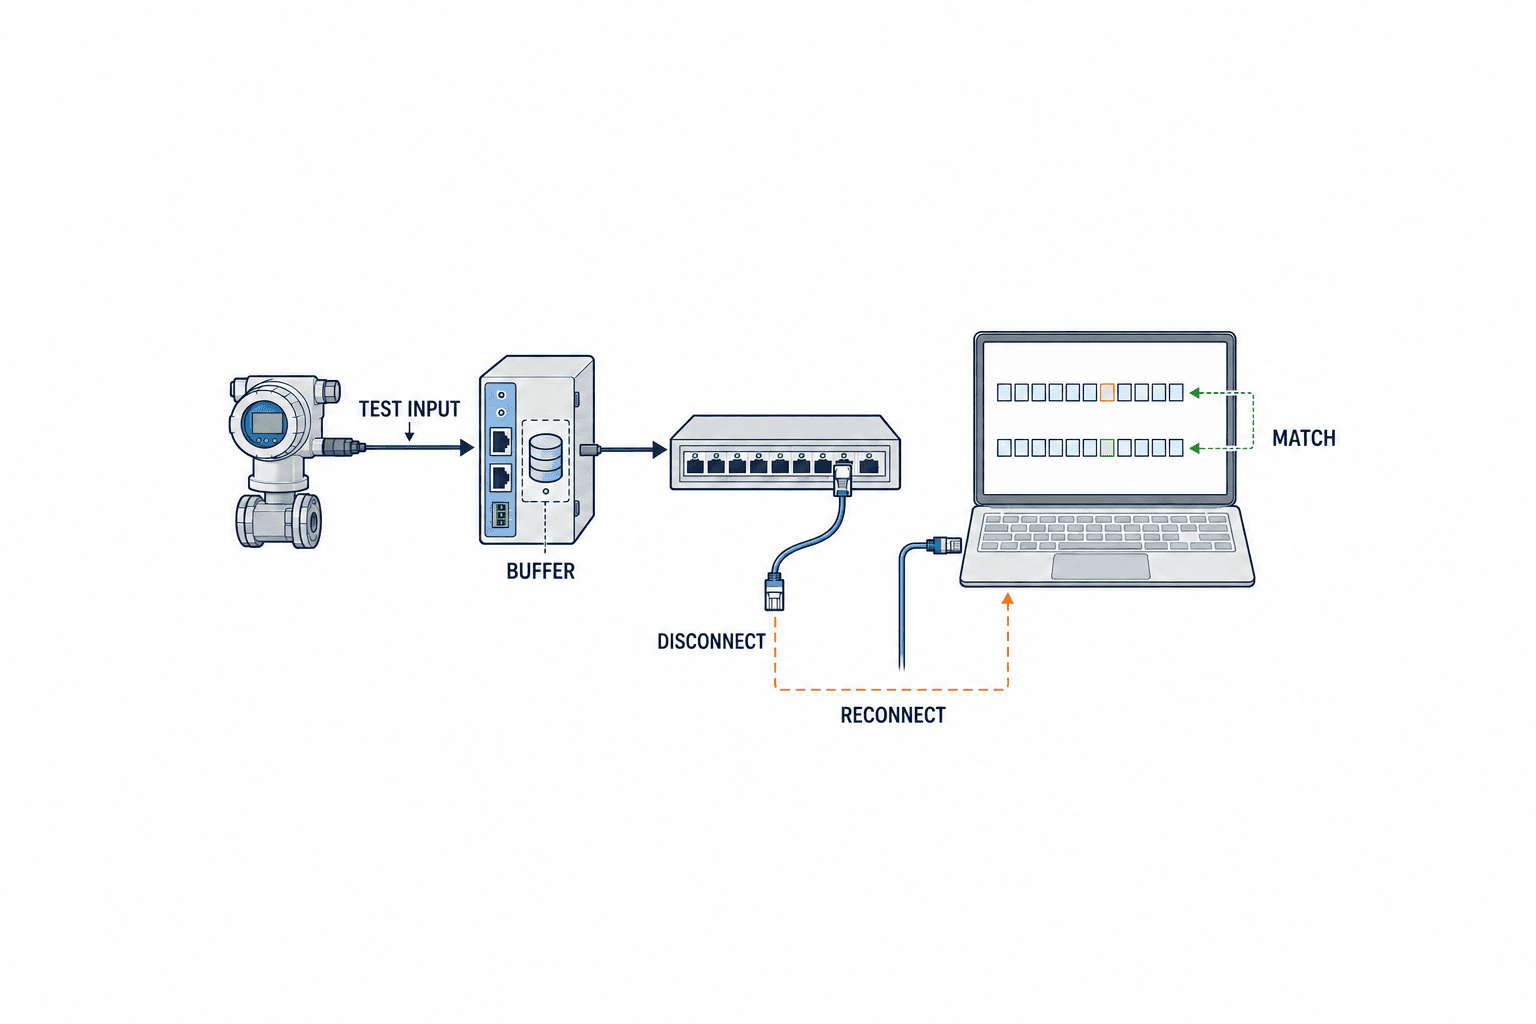
In FAT (Factory Acceptance Test), simply showing a graph on a demo screen is not a pass. Fix the input values and timestamps for the test, cut off communication at the gateway, generate a certain number of records, and after recovery reconcile the original records with the stored records. Verify whether intentional missing data and records that recovered after late arrival can be distinguished. If possible, align three evidence points: a test instrument that simulates the sensor input, logs at the gateway ingress, and an export from the receiving side.
The FAT test sheet should record the test ID, preconditions, input count, fault start and end, expected result, measured count, duplicate count, quality status, delay distribution, log location, and judge. “The line graph was connected in the end after a 20-minute disconnection” is weak as evidence. Show how many expected slots there were in those 20 minutes, how many arrived and when, how many were excluded as duplicates, and how many did not arrive.
The minimum faults to test are upstream network outage, receiving server stop, gateway reboot, buffer nearing its limit, clock synchronization failure, Bad-quality input, duplicate resend of the same event, and reversed order. Depending on the equipment configuration, also include PLC-side queue overflow, intermittent wireless links, and brief power loss. Because the control system must not be affected during testing, separate what is done safely in a simulation environment from what is done on the actual site.
In SAT, Verify the Factory’s Time, Power, and Shift Work
Handover Documents in Anticipation of Post-Acceptance Changes
At handover, create a list not only of the completed settings but also of which settings affect missing-data judgment. Adding tags, changing acquisition cycles, replacing sensors, updating gateway firmware, changing the destination, and updating the factory operating calendar can all change the basis for expected count and delay. Make it part of the operational procedure to state who applies for the change, who approves it, and what test must be repeated after the change. If a software update changes the log format used in FAT, verify again that the reconciliation script and audit trail can still be used.
It is also important to decide what to do with unsent records in the buffer after replacing the unit with a spare. Decide whether they can be extracted from the failed unit’s disk, and if they cannot, how the missing interval will be finalized. If the spare starts sending with the same equipment ID, keys for late-arriving events from the old unit may collide with keys for new events. Keep the device instance identifier, replacement date and time, and duplicate elimination rules in the handover documents. Only after testing this far are you ready to move from a one-time PoC to continuous operation.
SAT (Site Acceptance Test) is not just a replay of FAT. Actual network segregation, control panel space, UPS presence, night shutdown, shift handover, and display times in Thailand and headquarters are added. Share the planned test time with production and maintenance departments, and define the safe range in which fault injection is allowed. If disconnection tests cannot be performed on the live line, do them on a test path and record in the acceptance record the scope that could not be proven in production.
If wireless quality on the shop floor changes depending on time of day or the position of transport carts, a short demo is not enough to make a judgment. Set an observation period that includes at least one cycle of the target process and a shift change, and confirm who receives the missing-data alerts and who performs the first-level triage. Check whether the equipment maintenance, quality, production engineering, and IT teams can distinguish “sensor failure,” “communication delay,” and “display delay” on the same screen. A configuration in which the cause cannot be found without asking the vendor for logs every time an abnormality occurs tends to remain unresolved for a long time after launch.
Pass criteria should not be a uniform “99.9%,” but should be defined by use case and fault scenario. High-temperature values used for alerts are useless if the provisional delay is not short enough. On the other hand, monthly energy analysis can tolerate some delay and place more importance on final completeness. For critical quality records, the requirement may be to avoid hiding the missing data itself and explicitly show “this interval could not be measured.” Verify in SAT the values agreed in the RFP, and if they do not pass, record the conditions for retest and interim operation.
After Go-Live, Connect “Missing Count” to Corrective Action
After implementation, simply showing the missing rate on the daily dashboard does not lead to improvement. Put the target equipment, tag, start and end times, expected count, recovered count, unrecovered count, Bad quality count, and the boundary where the anomaly first appeared into the same ticket. The person in charge can decide whether to investigate the sensor/control side, OT network, edge, cloud, or application. Also connect unrecovered data that affected quality judgment to lot hold, additional inspection, or deviation approval in the business workflow.
On a weekly basis, look not only at the number of root causes but also at recurrence count and recovery time. If buffer limit warnings are increasing but no data is missing yet, ignoring them means the next long communication outage will cause loss. Clock synchronization failures are also hard to notice while values still appear on screen. Include the reliability status of time in the monitoring items. When settings change, record before and after how changes in sampling cycle, deadband, queue length, and retention period affect expected count and the decision formula.
For factories that are moving toward linking data to lots, sensor data alone does not complete traceability. The design that connects identifiers for materials, process, equipment, inspection, and shipping is covered in Traceability system build cost and approach. The missing-data countermeasure in this article is the work of making the recording of equipment and process conditions in that chain reliable.
Compare responsibility boundaries and even the “work after data is lost” when comparing quotes
If you compare proposed prices for countermeasures against missing data only by the unit price of the equipment, you will make a mistake. Even when using the same gateway, operating costs change depending on who replaces the sensor, who approves PLC tag changes, who investigates network failures, and who performs re-entry of historical data. The buyer should define the first-line contact and second-line responder for each of the six stages of an incident, and have each vendor quote maintenance costs under the same conditions. Even if a proposal simply says “24-hour support,” it does not necessarily include confirming the missing-data interval required by the quality department or extracting the impacted lots.
What should be checked especially carefully is the practical work from incident detection through recovery. When an alert is raised, who saves the logs? Even if the site restarts the equipment, can the unsent buffer be retained? Can old data be retrieved from the replaced equipment? If it cannot be recovered, who determines the missing-data event, and in what format is it handed over to the quality department? During incidents on holidays, evidence may be erased in a rush to restore operations. Make this into a short procedure covering log collection before restart, recording the remaining buffer count, and sharing the incident time, so that the shift operator can carry it out.
It is easier to compare quotes if you prepare two cost scenarios in the request for quotation. One is normal operation, including tag additions, monthly inspections, configuration backups, and report review. The other is incident response, including retransmission after communication outages, isolation of corrupted records, reconciliation with the original data, re-aggregation, and reporting for audits. A proposal that assumes the latter is free may only reveal differences in how the work scope is interpreted once an incident actually occurs. Compare not only the amount of the cost, but also the responsible party and the form of the deliverables.
The same approach should be used when estimating future line additions. Even if manual cross-checking is possible with the initial one line, once you reach 10 lines you may need a dedicated person just to check missing data every morning. If automation is being considered, confirm how much of the generation of planned counts, re-checking after late arrivals, ticket issuance, and daily reporting will be provided as standard functions. If you will pass lot-hold information to an existing MES or quality system, put the responsibility boundary for the integration in a separate line item. Clarifying this point allows you to compare not just the price of the data collection platform, but the total cost of maintaining quality records.
Sequence for a small-scale rollout | From actual measurement on one piece of equipment to horizontal deployment
Start with equipment where an exception must be explained from records when something goes wrong, and where testing can be performed safely. Rather than connecting all thermometers at once, it is easier to trace the cause of missing data if you begin with one heating process and only a small set of signals related to that process, such as temperature, pressure, operating status, and lot start/end. Decide on one condition used by Quality and one used on the shop floor, and spell out how many minutes’ worth of values are needed for each decision. If you increase the number of signals first, definitions of planned counts and interpretation of quality status will not keep up, and only a pile of values will remain.
In the first observation, run in parallel with existing instruments and paper records, and confirm how the data is produced through one continuous process step. Discuss with the shop floor the rule for excluding planned downtime from the denominator, how to handle values during cleaning, and whether the meaning of tags changes after a product changeover. The tag ledger created here is not merely an address list. Make it so that equipment ID, sensor installation location, units, normal range, measurement cycle, alert conditions for changes, source of the clock, meaning of quality flags, maintenance owner, and intended use can all be looked up in a single line. When adding more equipment later, duplicating this ledger and checking the differences lets you avoid spreading the same mistake.
In the next stage, test communication interruptions and restarts, and cross-check three points: how many records entered the edge, and how many reached the final storage destination. Confirm that the difference under normal conditions is zero before introducing a fault. If you perform a disconnection test while the counts are already mismatched under normal conditions, new missing data and preexisting configuration errors will be mixed together. During the test, do not write to the control system, and confirm read load and safety constraints with the equipment manufacturer. After the test, it is also necessary to check whether the buffer count has returned to its original state. Even if it appears that all records arrived, if resend queues remain, there is a risk that the next fault will exhaust capacity.
Before rolling out horizontally, compare whether the conditions of the first and second pieces of equipment are truly the same. Not only the PLC model, but also the firmware, sensor accuracy, network path, equipment stop patterns, power protection, and maintenance personnel may differ. What may be standardized is the framework for the data contract and the test sheet, but expected counts and pass criteria should not be copied uniformly. Write line-specific exceptions into the ledger, and in overall aggregation, place only comparable indicators on the same graph. By phasing the rollout in this way, defects found in the PoC can be corrected before they are carried into the next piece of equipment.
Decide with Quality how long to retain evidence and how to correct it
In operations after missing data is discovered, the issue is how long to retain the raw data. If you save only the aggregated values displayed on the dashboard and delete the original received records after a short period, you cannot later verify in an audit whether “it truly was missing” or “it arrived later.” On the other hand, a configuration that stores high-frequency data for all tags indefinitely is costly. Separate the period needed as a quality record for the target product, internal audit requirements, customer contracts, and retention periods for analysis purposes, and design the storage destinations for raw records and aggregated results accordingly. Because legal retention periods and customer specifications differ by industry and product, no single number of years is set here.
Also decide the deadline for accepting records that arrive later. For example, in an operation where the daily aggregation is finalized the next morning, one possible approach is to automatically recalculate records that arrive before that point, and require a correction request after finalization. However, this deadline is only an operational example; a process used for quality decisions may require a stricter procedure. When changing a finalized value, do not delete the original value; store the before-and-after values, the reason for the change, the approver, and the recalculated report as a set. If you replace only the aggregated result, it will conflict with the alert screen at the time and the report issued to the customer. Number the report versions so it is possible to trace which decision was made using which version.
Quality flags should carry the reasons that need to be distinguished in operations, at the necessary level of granularity, such as “communication interruption,” “sensor failure,” “out of measurement range,” “clock synchronization unknown,” “interpolated value,” and “manual correction.” However, do not directly substitute product-specific quality codes into a company-wide common meaning. The same term can have different meanings in a PLC, OPC UA server, gateway, historian, and MES. Create a conversion table, retain the original codes, and do not arbitrarily treat values that cannot be mapped as Good. Include one unknown code in acceptance testing and confirm how storage and notifications behave.
An incident report is not only material for assigning responsibility; it is also input for the next design change. Rather than unconditionally converting tags with many missing values to high frequency, review whether the original signal was truly necessary, whether the time window used for detection was appropriate, and whether the buffer capacity or transmission bandwidth was insufficient. If the same several-minute gap occurs every month, it may also be possible that regular equipment shutdowns or network maintenance are not being correctly reflected in the denominator. When changing the decision formula itself based on operational data, clearly state whether the new formula will be applied retroactively to past periods, and do not silently mix figures before and after the change.
To avoid relying on each person’s experience alone for daily reconciliation, we also define a morning check procedure. We generate the prior day’s expected counts from actual operating results, compare them with the unique records that have already arrived, and list any missing intervals by equipment. At that point, we separate the counts still in the buffer from the counts that have reached the final storage destination, and display the deadline for waiting on late arrivals. Values before the deadline are treated as provisional; values that still have not arrived after the deadline are treated as unrecovered. We then notify the shop floor only for the intervals that affect quality decisions first. Once resending is complete, we rerun the reconciliation under the same conditions and save both the difference from the previous run and the final judgment. This way, even if the person in charge changes, we avoid a situation where something was reported as missing yesterday and then disappears today with no explanation.
We also make sure we can detect when the reconciliation process itself has stopped. If we rely only on missing-record alerts, a day on which the reconciliation job failed and counted nothing could be mistaken for a normal day. We monitor the last execution time, the number of equipment items covered, the number of expected counts processed, and the number of failed tags, and we clearly flag days when the job could not run in the daily report. After recovery, we reprocess that day and reproduce the same judgment logic using the operating calendar and tag-configuration versions in effect at the time. If we recalculate the past using today’s settings, planned downtime and changes to the acquisition cycle may not be reflected, and only the numbers may change. Keeping the necessary configuration history together with the original records is what makes later explanations of missing-data management possible.
FAQ | Common Questions About Factory Sensor Data Loss Prevention Implementation
If sensor data is missing, should we fill it by interpolation?
It depends on the use case. Interpolation can be useful for visualizing temperature trends, but interpolated values should not be treated as measured values in quality assurance or alarm evidence. Keep the original missing interval and attach a “estimated” quality flag and calculation method to the interpolated value. Manage the display line and the original record for audit separately.
If we increase MQTT QoS, will missing data disappear?
No. QoS defines delivery behavior for a specific communication segment, but it does not guarantee values that could not be measured at the sensor, values lost before entering the gateway, or values that fall out of aggregation after reception. For each required segment, test acknowledgment, persistence, retransmission, duplicate elimination, and reconciliation. When comparing MQTT functions, refer to the OASIS MQTT 5.0 specification, and separately verify the scope implemented by the product.
What target missing-data rate should we set?
There is no single universal number. It depends on the recording cycle, equipment operating calendar, allowable recovery time, and impact on quality judgment. First measure the baseline for one process, separate provisional from final, and handle critical missing intervals separately from the count. Even if the average is 99.9%, if one important 10-minute period is completely absent, it may still fail operationally.
Are RFP and FAT/SAT necessary even for a small PoC?
A full multi-page document is not necessary, but it is valuable to put the formula for expected count, the origin of timestamps, communication-loss tests, duplicate judgment, and pass/fail criteria on a single test sheet. If you verify these conditions in the PoC, it becomes easier to compare estimates for wider deployment. If you omit them, the result may be “the graph appeared, but the responsibility boundary for missing data is undecided.”
Conclusion | Accept Records You Can Explain, Not Just Values You Can See
Factory sensor data loss prevention becomes practical when you place the definition of “expected records” before and after selecting sensors or cloud services. Separate fixed-cycle and on-change records, store measurement time, reception time, quality, and event ID, and measure provisional completeness and final completeness separately. Design not only buffer capacity but also recovery bandwidth and duplicate elimination. Verify the decision formula written in the RFP as the same form of evidence in FAT and SAT. If you proceed in this order, you can move from monitoring that only shows numbers to operations that can explain why data is missing and what impact it has.
If you want to review an existing factory line in Thailand, from the tag ledger to communication-loss test conditions, please contact TOMAS TECH with the target line and the intended use of the records. Even if the configuration and products are not yet decided, we can work together from organizing the acceptance criteria.


