


When a Thai plant reports that it missed its planned output for the month, the work of finding out why is still, in most factories, done from memory and by hand. A production manager walks the line, runs a stopwatch at whichever station looks congested, aggregates the daily reports in Excel, and infers the cause from experience. There is nothing wrong with that method. The problem is that in a plant running high-mix low-volume work with several changeovers a day, or several lines in parallel, the amount a human can observe stops keeping pace with how fast the floor changes. This article looks at AI applied not to individual machine faults but to the flow between processes, that is, to throughput. We break process improvement AI into three layers, data collection, analysis and recommendation, and set out where a Japanese-owned plant in Thailand should realistically start.
Why improvement driven by veteran intuition runs out of road
Let us be clear about the premise first. Process improvement itself is the activity manufacturing has been best at for decades, long before AI arrived. The limitation is not the methodology. It is the density of observation.
Conventional improvement activity has three structural weaknesses.
First, observation is intermittent. A stopwatch study is a record of one time window on one day. But congestion in a plant often appears only in the week a particular order lands, on the day a particular product variant runs, or on one specific shift. The odds of catching that moment with a handful of studies per year are not good.
Second, the bottleneck moves. Raise the capacity of one station and the constraint relocates to another. The more successful your improvement, the more often the place you need to look changes. In a system that depends on human observation, every relocation costs the same investigation effort all over again.
Third, the knowledge belongs to individuals. Which station tends to jam, and why, lives in one veteran’s head and in a personal spreadsheet. In Thailand, expatriate rotations and local staff turnover erase that knowledge on a timescale of a few years.
This is not just anecdotal. In its 2026 overview of bottleneck identification technology, the IP and technology intelligence platform Patsnap notes that as of a 2022 assessment, only 5 of the 15 Industry 4.0 design principles and only 5 of its 11 constituent technologies had been applied to bottleneck analysis at all. That matches what we see on site. Plants that already run AI for predictive maintenance or visual inspection have frequently left the flow of the whole process untouched.
The premise, the bottleneck sets the output of the whole plant
Before designing anything, you have to say out loud what is being optimised. The foundation here is the Theory of Constraints (TOC).

The claim is simple. Any system made of linked activities has a constraint, and that constraint governs the rate of output for the system as a whole. Lean Production describes it this way, a complex system consists of multiple linked activities, one of which acts as a constraint upon the entire system, the weakest link in the chain. It states plainly that every process has a single constraint and that total process throughput can only be improved when the constraint is improved.
That proposition has a consequence that runs against floor intuition. Raising utilisation at any station that is not the constraint does not increase plant output. It increases work in progress between stations. Yet the moment you put utilisation figures side by side by line and by machine, the low numbers become the ones people want to fix. TOC rejects that instinct explicitly.
TOC expresses improvement as five focusing steps.
| Step | What it means | Relationship to process improvement AI |
|---|---|---|
| Identify | Identify the current constraint, the single part of the process that limits the rate at which the goal is achieved | The layer where AI takes over continuous first-pass detection |
| Exploit | Make quick improvements to the throughput of the constraint using existing resources | Where visibility into availability, micro stops and changeover time pays off |
| Subordinate | Review all other activities to ensure they truly support the needs of the constraint | Revising release schedules and inventory levels upstream and downstream |
| Elevate | If the constraint still exists, consider further action to remove it from being the constraint | The capital and headcount decision |
| Repeat | Once a constraint is resolved, address the next one immediately | Where continuous machine monitoring delivers the most value |
The step to watch is Repeat. The constraint will always move. Running Repeat by hand, indefinitely, is not realistic, and that is exactly where automation earns its keep. If you understand process improvement AI as a system that takes Identify and Repeat off human shoulders and prepares the evidence for Exploit and Elevate, the purpose of the investment stays in focus.
Three layers, kept separate
The phrase “AI for process improvement” bundles together three jobs that are quite different in nature. Buy a product without separating them and you get one of two familiar failures, a recommendation engine bought by a plant that has no usable data underneath it, or a mountain of collected data that ends as a dashboard nobody opens.
| Layer | Its job | Main technology | Symptom when it fails |
|---|---|---|---|
| Data collection | Continuously record run, stop, quantity and timestamp per station | PLC signal capture, MES and ERP integration, retrofit IoT sensors | The dataset to be analysed is full of gaps |
| Analysis | First-pass constraint detection, OEE decomposition, what-if estimates | Statistics, machine learning, simulation | Output contradicts what the floor knows and loses credibility |
| Recommendation | Draft improvement proposals and share them across languages | Generative AI, retrieval over existing documents | Plausible proposals that nobody can actually execute |
The point is that the upper layers do not function unless the lower ones hold. The quality of the text the recommendation layer produces depends on the accuracy of the numbers from the analysis layer, and that accuracy depends on the gap rate in collection. The order cannot be skipped.
If you want a broader map of AI use on the shop floor rather than this one slice of it, our piece on shop floor AI use cases and how to tell the four types apart covers the wider ground. This article drills into the type that watches flow.
Layer 1, data collection, how far existing equipment already takes you
The first stumbling block in every process improvement AI project is, almost without exception, data. And what is missing is rarely volume. It is granularity and timestamp accuracy.
Daily production results filed as a shift report will not identify a bottleneck. What you need is a time series that records which station ran which variant, from when to when, how many pieces it produced, and how many minutes it stopped for what reason. A daily aggregate averages away the waiting time between stations, which is precisely the thing you are hunting.
| Source | What it yields | Typical capture method | Common gap |
|---|---|---|---|
| PLC and machine controllers | Run, stop and emergency stop state changes, cycle time | OPC UA, signal capture from the existing equipment network | Stop reason codes not configured, so the content of a stop is unknown |
| MES and shop floor execution systems | Variant, work order number, released and completed quantity, station timestamps | Database integration, CSV integration | Progress recorded per lot rather than per station |
| ERP and production planning | Orders, planned quantity, standard time, lead time | API integration, nightly batch | Standard times not updated for several years |
| Retrofit IoT sensors | Current draw, vibration, photoelectric passage counts | External mounting without touching the machine | Too few installation points to see the whole process |
| Operator input | Stop reason, defect reason, changeover start and end | Tablets, andon terminals | Options do not match reality so everything lands under “other” |
For most plants in Thailand the realistic starting point is the result data that already sits in ERP and MES, plus the PLC signals already wired. You do not need a new sensor on every machine. The reverse is a real risk, though. Add a large number of sensors while stop reason codes remain poorly designed and you accumulate data that proves the machine was stopped without ever explaining why.
Plants that already run an OT platform for traceability or equipment monitoring can usually reuse that cabling and those gateways, concentrating the incremental investment in software on the analysis side. Before you start, inventory at drawing level which stations your existing platform actually picks signals up from. The result of that inventory sets the ceiling on the accuracy of everything in the next layer.
Layer 2, analysis, how AI actually locates the constraint
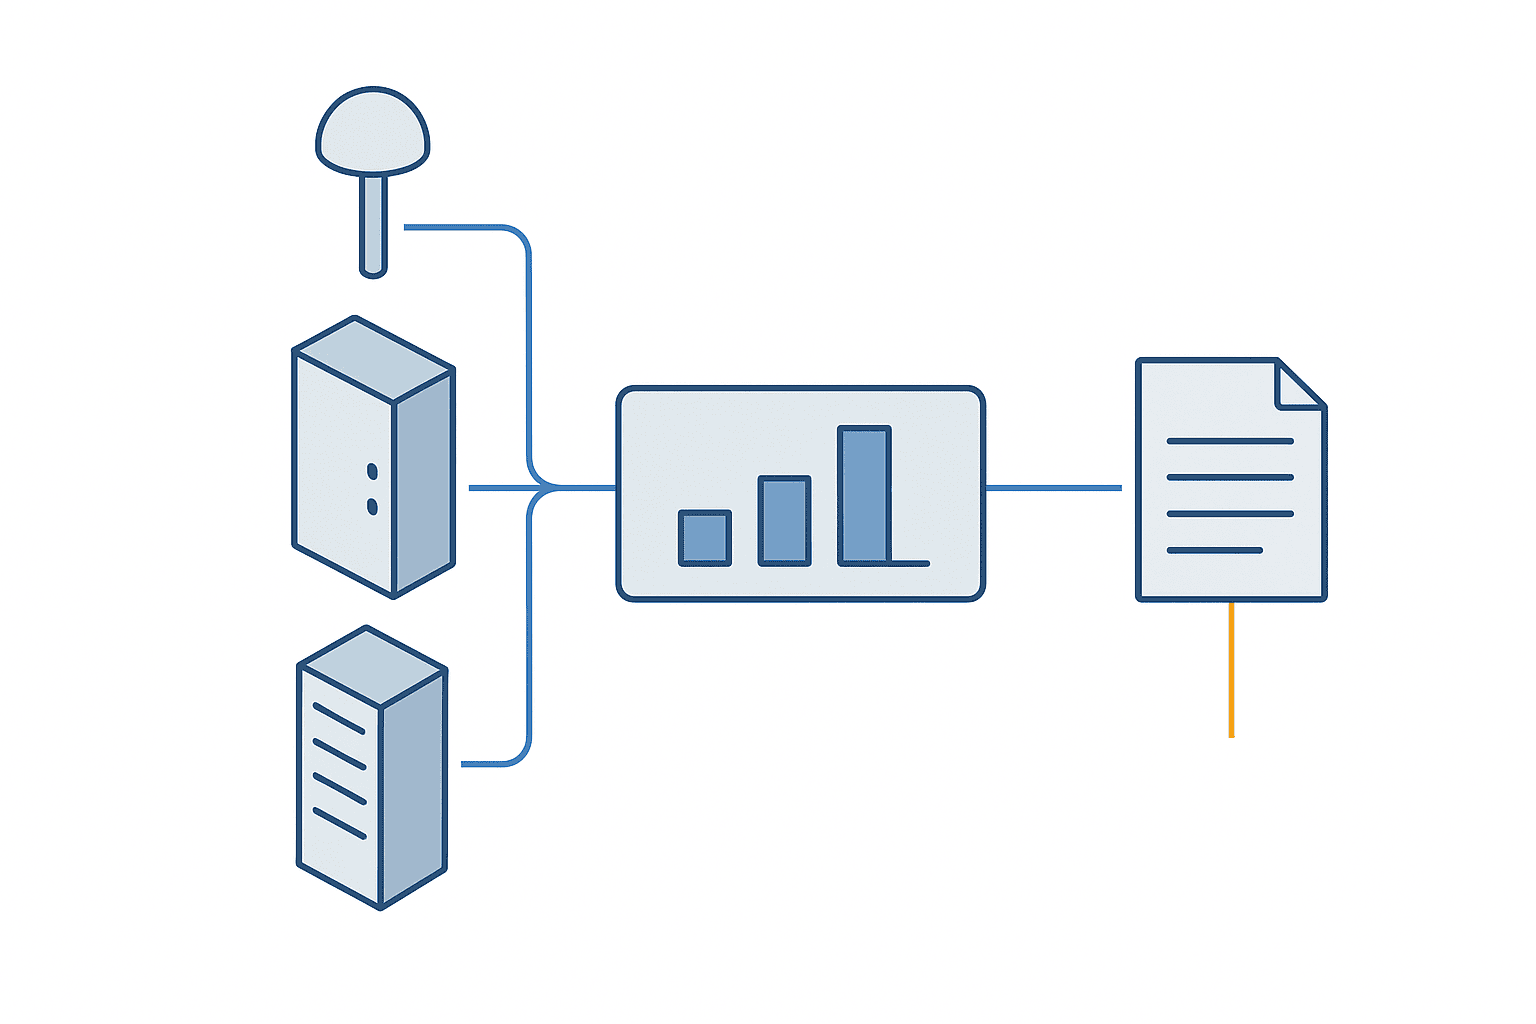
This layer does two things. It performs first-pass detection of the constraint on a continuing basis, and it decomposes how time is being consumed at that station.
First-pass constraint detection
There is no single method. The Patsnap overview cited above notes that a 2023 systematic review identified 14 distinct bottleneck detection methods. One approach that sees heavy practical use is the active period method, which treats the machine with the longest continuous uninterrupted active period as the throughput bottleneck. The same overview describes this as the dominant analytical backbone in data-driven bottleneck detection.
The logic is intuitive. The machine that keeps running longest without being starved by an upstream station or blocked by a downstream one is the machine setting the pace for the system. That judgement can be computed from run and stop timestamps alone. It needs no resident specialist, which is exactly why it suits continuous monitoring.
Machine learning approaches have track record too. The same overview cites a 2022 case at Bosch Thermotechnology in which random forest and multi-layer perceptron models achieved greater than 95% accuracy. One caveat matters here. That kind of accuracy belongs to a model trained on that plant’s data for that period. Nobody is selling a general-purpose model you can drop into another factory. Adopting process improvement AI means doing the training and validation on your own data.
Decomposing what utilisation is made of
Once the constraint is known, the next task is to break down how its time is lost. The standard framework is OEE, Overall Equipment Effectiveness, which expresses the percentage of manufacturing time that is genuinely productive and splits into three factors.
| Factor | Loss it captures | What 100% means |
|---|---|---|
| Availability | Planned and unplanned stops | The process is always running during planned production time |
| Performance | Slow cycles and small stops, the micro stops | When the process is running, it runs as fast as possible |
| Quality | Defects, including parts requiring rework | There are no defects, only good parts are produced |
External benchmarks help when putting OEE into operation. OEE.com gives 85% as the world-class figure for discrete manufacturing, composed of 90% availability, 95% performance and 99% quality, while noting that most manufacturing companies still sit closer to 60%. Those levels originate in Seiichi Nakajima’s work in the Japanese automotive industry in the 1970s. The same source is explicit that you should not fixate on the absolute value of the number but on your ability to improve that number. Treat OEE as a month-on-month measure of your own plant, not as a scoreboard against other companies.
Where AI earns its place here is less in the arithmetic than in the classification the arithmetic depends on. Micro stops lasting tens of seconds, dozens of times a day, will never be reliably logged by an operator typing a reason each time. Only once stop patterns and surrounding signals are classified automatically, and changeover start and end are inferred rather than entered, does OEE become a number you can refresh daily.
If you need to go deeper on the defect side, the analysis of inspection data itself is a separate subject, covered in our article on AI analysis of quality inspection data. The data and the decision horizon are different from what is described here. Process improvement AI asks which station is slowing the whole plant. Inspection data AI asks why this particular part came out defective.
What-if simulation
Once you know the constraint and the shape of the losses, the next question is how many more units you get if you fix a given thing. This is where simulation appears. The Patsnap overview notes a 2023 industrial IoT paper that introduced a self-learning digital twin combining heuristic-based bottleneck detection, machine learning and explainable AI (XAI) for human-interpretable analysis.
The practical significance sits in the word explainable. A model that only names a candidate station will be dismissed on the floor with “we have known that station jams for years”. The discussion of improvement only starts when the system can show why it judged that station to be the constraint, and which stops in which time windows drove the conclusion.
Layer 3, recommendation, what to hand to generative AI
The output of the analysis layer is still numbers and charts. The range of work involved in turning that into a written improvement proposal that can now be delegated to generative AI has widened considerably.
ZBrain, which provides a generative AI platform, describes a pattern in which generative AI synthesises fragmented inspection notes, lab results, audit observations and operator comments into a clearer root-cause narrative, while agentic AI routes the issue to the right stakeholders, retrieves supporting evidence and drafts corrective-action recommendations for review. Translated into process improvement, that means cross-referencing stop logs, results by variant and the history of past countermeasures, and having the system draft a coherent argument such as “changeover for this variant at this station is what is driving overall lead time”.
More advanced directions are appearing. Per the same Patsnap overview, a patent filed in 2025 by Zhonggong Internet (Beijing) covers large model-based identification of bottleneck propagation paths across production nodes, analysing time conflict zones, space conflict zones and resource conflict zones simultaneously in order to generate task adjustment instruction sets for emergency production insertions. That treats a bottleneck not as a point but as a path along which congestion propagates.
Agentic usage of that kind is still ahead of most plants, but the direction is unambiguous. In the State of AI in the Enterprise announcement published by Deloitte on 21 January 2026, close to three-quarters of companies are planning to deploy agentic AI within two years. The same announcement notes that physical AI is rapidly becoming integral to operations worldwide, with manufacturing, logistics and defence leading the way globally.
Why multilingual reporting matters here
For a Japanese-owned plant in Thailand, the recommendation layer carries a value it would not have in a plant back in Japan. Language.
Material for the production meeting is written in Japanese, instructions to the floor go out in Thai, and the report to headquarters is written in Japanese or English. In practice the same improvement topic gets written three times by three different people. If the Japanese headquarters report, the Thai work instruction and the English executive summary can all be generated from the same figures produced by the analysis layer, you remove that duplication and you also remove the incidents where the three documents disagree about the numbers.
As precedent, Mercedes-Benz has been reported to have piloted ChatGPT via Microsoft Azure OpenAI as a voice interface for querying factory data. The BMW Group has rolled out a generative AI self-service platform that lets non-technical employees assemble AI solutions themselves, and has integrated its quality platform into production operations. Both are attempts to end the situation where a number only appears if you file a request with a specialist department.
One caveat deserves emphasis. What generative AI produces is a draft, not a decision. Interpreting a stop reason and proposing a shorter changeover both involve constraints only the floor knows. When you introduce the recommendation layer, decide first who approves a generated proposal, who executes it, and who measures the effect afterwards. Without that, you have built a system that publishes proposals nobody acts on, every week.
How to read the published case studies

Case studies in this field come with impressive numbers attached to very large investments. To avoid misreading them, it is worth taking one apart.
LG Electronics rebuilt its home appliance complex in Changwon, South Korea, as LG Smart Park and was named a Lighthouse Factory by the World Economic Forum. In the company’s announcement dated 31 March 2022, units produced per hour increased by 17% comparing 2020 with 2021, and the cost of defective product returns dropped by 70% over the same comparison. On the logistics side, a three-dimensional logistics automation system cut required warehouse space by 30% and shortened the time required for hourly materials transportation by 25%. On the analytics side, an advanced analytics system based on edge computing technology and machine learning predicts potential production issues within the next 10 minutes, enabling problems to be resolved pre-emptively.
What you should extract from that case is not the percentages. It is that the improvement came from simultaneous change across several layers at once, logistics automation, real-time prediction and the ability to handle variant changeovers. In other words it was a project on the scale of rebuilding the plant. A mid-sized factory in Thailand is not going to reproduce that investment.
The part that does scale down is the notion of predicting an issue within the next 10 minutes. Narrow it to the one constraint station and give the changeover team a few minutes of warning about an impending stop, and where those people stand while they wait changes. The practical way to read a case study is to ignore the headline percentage and extract what that plant made observable.
How to phase the rollout
Process improvement AI fails reliably when it starts as a plant-wide programme, because data granularity differs from station to station and the first several months disappear into preprocessing. We recommend the following sequence.
| Phase | What you do | Rough duration | KPI used to judge |
|---|---|---|---|
| Narrow to one line | Pick one line with many variants, frequent stops and stable incoming orders | 2 weeks | Monthly plan attainment on that line |
| Inventory existing data | Measure the actual gap rate and timestamp accuracy of PLC, MES and ERP data | 3 to 4 weeks | Share of stops that carry a reason code |
| Measure in a PoC | Run first-pass constraint detection and OEE decomposition, and test them against floor knowledge | 2 to 3 months | OEE, throughput at the constraint, lead time |
| Extend to other lines | Fix the standard form of data capture and widen the scope | From month 6 | Incremental effort per additional line |
The single most important criterion when choosing the pilot line is stable order intake. On a line whose volume swings heavily month to month, you cannot separate the effect of your improvement from the effect of demand, and the PoC will not reach a conclusion.
When inventorying existing data, always measure the share of stops that carry a reason code. If that share is low, the analysis layer can still total up stopped minutes, but those minutes will not connect to any countermeasure. If the inventory shows a low rate, rebuilding the option list on the andon terminals comes before any AI purchase.
Evaluate the PoC on three KPIs and no more, OEE at the constraint, throughput for the line as a whole, and order-to-shipment lead time. Watching OEE alone creates the temptation to flatter the number by raising utilisation at a station that is not the constraint. Carrying throughput and lead time alongside it blocks that temptation structurally.
Cost and organisation
Because the money depends heavily on the state of your data, the sensible thing is to describe ranges. What follows is how we scope a PoC covering one line for Japanese-owned manufacturers in Thailand.
| Cost item | Rough scale | What moves it |
|---|---|---|
| Preparing data collection | Small where existing PLC and MES suffice, medium to large where new sensors are needed | Equipment vintage, communication standards, whether an OT platform already exists |
| Building the analysis platform | Medium, with cloud running cost roughly proportional to the number of stations covered | Number of lines, data granularity and retention period |
| Adding the recommendation layer | Small to medium, with generative AI usage cost driven by how often documents are produced | Number of output languages, depth of integration with existing documents |
| Internal organisation | Can start with one production engineer and one IT member, both part-time on the project | Whether stop reason codes have to be redesigned |
One note on organisation. Process improvement AI projects usually stall for reasons of ownership rather than technology. Equipment data belongs to production engineering, core system data to IT, and the discipline of entering stop reasons to manufacturing, which means nobody owns the overall quality of the data. At kickoff, name one person accountable for data quality on the pilot line. Whether that person exists tends to decide whether the PoC reaches a conclusion at all.
Frequently asked questions
How is process improvement AI different from anomaly detection AI
They look at different objects. Anomaly detection AI watches whether machine or sensor values are behaving unusually and catches early signs of failure or defect. Its unit of analysis is the machine. Process improvement AI looks at the flow between stations, where output can fail to rise even when every individual machine is running perfectly, because the capacity balance is wrong. Anomaly detection hunts for the machine that is about to break. Process improvement hunts for the station that is slowing everything down. Even if you deploy both, the data collection layer can usually be shared, so it is not a duplicated investment.
Where in a plant does AI-driven productivity improvement actually show up first
In reduced downtime at the constraint station. The reason is the TOC premise itself, time lost at the constraint is lost output for the whole plant. Speeding up a station that is not the constraint adds nothing. The order in which results appear is therefore identifying the constraint, then cutting micro stops and changeover time there, then adjusting release upstream and downstream. Skip the first of those and start with plant-wide automation, and you lose the ability to read the output response to your investment.
Should AI for quality management and process improvement AI be integrated
Integrate the data collection layer, keep the analysis and the decisions separate. Defects do push down throughput at the constraint, so the two are related. But quality AI judges individual parts while process improvement AI handles flow per unit of time, which makes the models and the evaluation metrics different animals. What should be unified is the design of identifiers, variant, work order number, station timestamp. Get those consistent and you can later cross-reference what was happening at the constraint during the window when defects spiked.
Can a plant without an MES start on process improvement AI
Yes. The minimum you need is run and stop timestamps per station plus completed quantity. Without an MES, that can be covered by PLC signal capture combined with an andon terminal or a lightweight result entry screen. In fact, running an MES implementation and an AI implementation in parallel tends to make both schedules slip against each other. Identifying one constraint station first and thickening the data only around it gives a return that is far easier to read.
How long should a PoC run before a decision
Two to three months. One month is not enough to separate month-end production surges or a concentrated run of one variant from the underlying signal. Beyond six months, attention fades and extensions continue without the original hypothesis ever being tested. Judge on two questions, did the constraint detection agree with what the floor knows, and among the decomposed loss minutes, were any identified that can actually be acted on. If both hold, the rollout is worth continuing even if the numeric target was not met.
Summary
Process improvement AI is not a new improvement methodology. It is a way of handing the Identify and Repeat steps of a classical framework to a machine. That is exactly why the purpose of the investment should be stated as making constraint detection and re-detection sustainable without depending on human observation, rather than as adopting AI.
Design it in three layers. In collection, inventory at drawing level how much you can already pull from existing PLC signals, MES and ERP. In analysis, run first-pass constraint detection and decompose losses with OEE, chasing your own month-on-month figure rather than the world-class 85%. In recommendation, let generative AI draft the proposals and the multilingual versions while the judgement stays with people. Skip a step and the project will stall somewhere.
And the first move is not selecting an AI product. It is picking one line and measuring how well its stop reason codes reflect what actually happens. While that number stays low, every AI you could buy will return answers of the same limited accuracy. When it is in good shape, plenty of plants find they can reuse an existing OT platform and reach the analysis layer for less than they expected.
If you are at the stage of wanting to establish how much data your lines already produce, or whether your existing equipment monitoring can be reused for process improvement, please get in touch through our contact page. We will go through your current equipment configuration and product mix and work out with you which line is the realistic place to start.
References
- Theory of Constraints, Lean Production — the principle that the constraint governs throughput for the whole system, the weakest link analogy, and the definitions of the five focusing steps Identify, Exploit, Subordinate, Elevate and Repeat
- OEE, Overall Equipment Effectiveness — the definition of OEE and what each of Availability, Performance and Quality captures, and what a score of 100% means
- World Class OEE — world-class OEE of 85% for discrete manufacturing with its 90%, 95% and 99% components, the observation that most manufacturers sit closer to 60%, and the origin in Seiichi Nakajima’s 1970s work
- Smart Factory Bottleneck Identification 2026 Landscape, Patsnap — dated 30 April 2026. The 2023 systematic review identifying 14 detection methods, the standing of the active period method, the 2022 Bosch Thermotechnology case with greater than 95% accuracy, the finding that as of 2022 only 5 of 15 Industry 4.0 design principles and 5 of 11 technologies had been applied to bottleneck analysis, the Zhonggong Internet (Beijing) patent on large model-based bottleneck propagation paths, and the self-learning digital twin combining explainable AI
- LG Smart Park Named Lighthouse Factory for Futuristic Manufacturing Technology — dated 31 March 2022. Units produced per hour up 17% and cost of defective product returns down 70% comparing 2020 with 2021, warehouse space down 30%, materials transportation time down 25%, and edge computing with machine learning predicting issues within the next 10 minutes
- State of AI in the Enterprise, The Untapped Edge, Deloitte — dated 21 January 2026. Close to three-quarters of companies planning to deploy agentic AI within two years, and physical AI adoption being led globally by manufacturing, logistics and defence
- Generative AI for Manufacturing, ZBrain — the pattern in which generative AI synthesises inspection notes, lab results, audit observations and operator comments into a root-cause narrative while agentic AI routes issues and drafts corrective-action recommendations, and the idea of one operating layer across ERP, MES and PLM
- Utilizing AI in Manufacturing 2026, ConverSight — the roles of agentic AI in quality inspection, inventory management and production scheduling, including dynamic schedule adjustment in response to demand swings, machine downtime and supply chain disruption
- Generative AI use cases for factory improvement activity, emuni — dated 27 July 2026. In Japanese. The Mercedes-Benz pilot of ChatGPT via Microsoft Azure OpenAI as a voice interface to factory data, and the BMW Group generative AI self-service platform with its quality platform integrated into production
- AI in production management, SmartMat — in Japanese. Visibility of intermediate inventory at the bottleneck station, visibility of work in progress and of the gap against the production plan, and the shift of generative AI from proof of concept toward deployment intended for live operation


