


When buying a dissolved oxygen (DO) instrument for an industrial wastewater plant, start with the operating decision it must support. A display that says 2 mg/L has limited meaning until you know where the probe sits, whether bubbles touch its sensing surface, how dirty it is, which compensation settings are active and whether the reading is valid for control. This guide follows a practical procurement path for aeration tanks in manufacturing facilities, including plants in Thailand: measurement purpose, optical versus electrochemical probes, installation, verification, PLC/SCADA records and acceptance testing. It does not prescribe a universal DO setpoint or a local discharge limit.
Define the aeration decision before specifying the instrument
DO is the oxygen dissolved in water. In an aerobic biological treatment tank it helps operators judge whether the process has oxygen available. The US EPA’s process control manual describes using DO to adjust air supply while avoiding unnecessary over aeration and energy use. That is a reason to measure and trend DO, not a basis for copying one plant’s setpoint to another. Tank geometry, load, treatment objective, mixing and sensor position differ. US EPA source.
Specify three distinct uses. Monitoring shows when oxygen becomes scarce across production shifts or wastewater batches. Control allows a validated measurement to influence blower speed or air valves, with a safe response to invalid data. Evidence preserves the reading, equipment state, setpoint and operator action during an incident. A sensible commissioning sequence is to establish credible monitoring data and compare it with operator observations before closing the control loop.
DO is not a substitute for BOD, COD, pH, ORP or turbidity. Those measurements describe different properties. For broader monitoring architecture, see our factory wastewater monitoring guide and the industrial ORP sensor selection guide. Here the focus is the aeration tank and the DO instrument.
Five questions to answer before requesting quotations
Identify the tank and process phase; decide whether the reading should represent typical conditions or a likely low oxygen zone; state whether it will be displayed or also used for automatic control; establish how often personnel can safely clean and verify the probe; and define the displayed and control state during power loss, cable failure and maintenance. These questions determine installation hardware and integration as much as they determine a sensor model.
Distinguish continuously aerated processes from intermittent aeration or sequencing batch operation. A low reading during an intentional non aerated phase may be normal. An alarm based only on concentration will then become noise. Record the process phase and blower state alongside DO, and mark intervals that are valid for control. Examine changes in production recipes, cleaning wastewater, temperature, salt content, oil, surfactants and suspended solids rather than relying only on one recent laboratory sample.
Write in the RFP who authorizes the initial setpoint and how it will be tested. Use site data on influent, effluent, blower energy and treatment performance. A value cited in a manual or another plant’s specification is an example under its own conditions. Site commissioning should find an operating range that protects treatment and limits wasteful air supply.
Compare optical and electrochemical DO sensors on real water
An optical probe reads the response of an oxygen sensitive luminescent material. Electrochemical designs include sensors that measure current from oxygen passing through a membrane to an electrode. Neither principle alone guarantees a good result in a dirty, bubbly aeration tank. Yokogawa lists both wastewater applications and optical DO products; this is useful primary product information, while suitability still needs a site trial. Yokogawa product information.
Some optical models avoid routine electrolyte replacement, but their cap and window still require inspection, cleaning and eventual replacement. Electrochemical models require attention to membranes, electrolyte, electrodes, polarization and, for some designs, sample flow. Hach’s troubleshooting guide notes flow or stirring requirements for a Clark probe, avoidance of direct sunlight for an optical probe, and the conditions for an air calibration. Follow each candidate model’s own instructions rather than applying one model’s procedure to all instruments. Hach technical guide.
| Decision factor | Optical candidate | Electrochemical candidate |
|---|---|---|
| Sensing part | Cap, optical window, fouling and replacement | Membrane, electrolyte, electrode and polarization |
| Installation | Bubbles, deposits, light and access | Bubbles, deposits, required flow and access |
| Upkeep | Cleaning, cap and verification | Cleaning, membrane/liquid and verification |
| Integration | Output, diagnostics and maintenance hold | Output, diagnostics and maintenance hold |
Compare response time, range, real water drift, cleaning time, spare part lead time, automatic cleaning compatibility, temperature and salinity settings, local service and total installed cost. The cost comparison should include mounting hardware, cable, transmitter, PLC I/O, cleaning arrangement, replacement parts and operator time. A short side by side trial should record values before and after cleaning and the number of unusable readings, not simply the lowest purchase price.
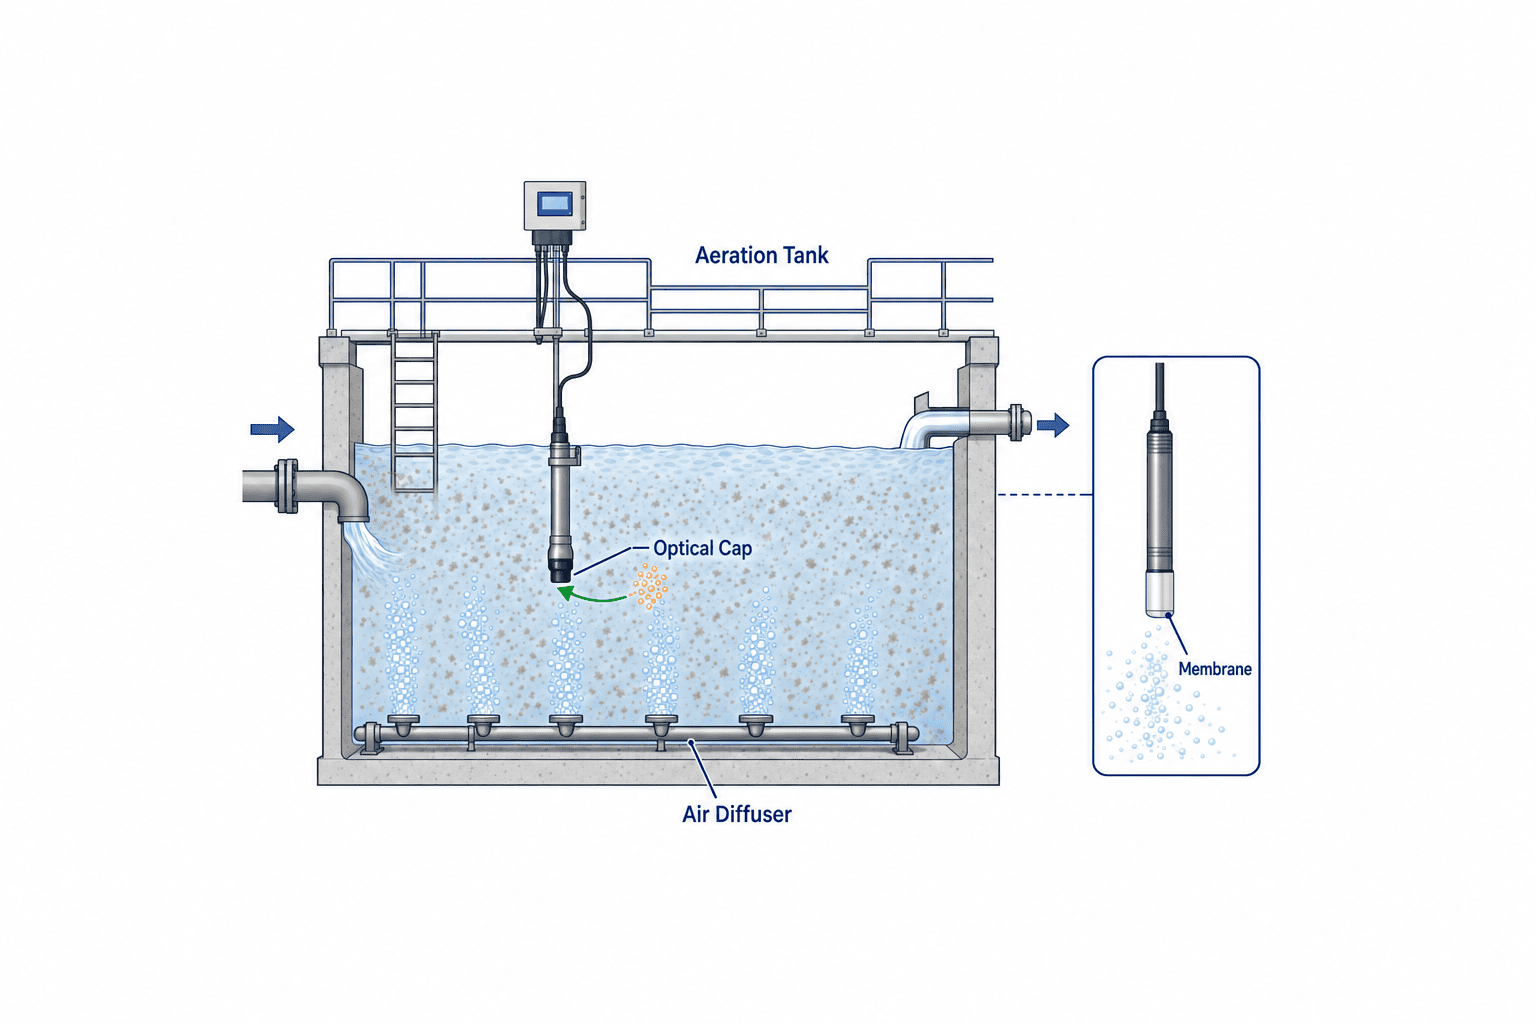
Place the probe where it answers the process question
An aeration tank has zones near diffusers with many bubbles, zones near the inlet with a changing oxygen demand, and areas with poor mixing or settled solids. The reading describes water at the probe tip. It is not automatically the average of the tank. Survey candidate points with a maintained portable meter across operating phases and load conditions. Avoid assuming that a convenient mounting point is representative.
Endress+Hauser’s Oxymax COS61D instructions warn that certain mounting inclinations may trap air bubbles at the oxygen sensitive surface and give unexpectedly high readings; the manual also discusses sediment and installation orientation. Those precise angle limits belong to that model, but they show why every shortlisted model needs a drawing and manufacturer specific mounting review. Oxymax COS61D instructions.
Show on the installation drawing the normal and minimum water levels, diffuser position, flow direction, mixer sweep, sensor depth, cable route and the space needed to lift the assembly out. Check whether the tip emerges at low level and whether a connector can flood at high level. Safe access for weekly cleaning is part of measurement performance. If two probes are proposed, give each a decision purpose, such as an upstream control signal and a downstream check. A simple average can hide a local low oxygen zone or a fouled probe.
Separate process changes from fouling and bubbles
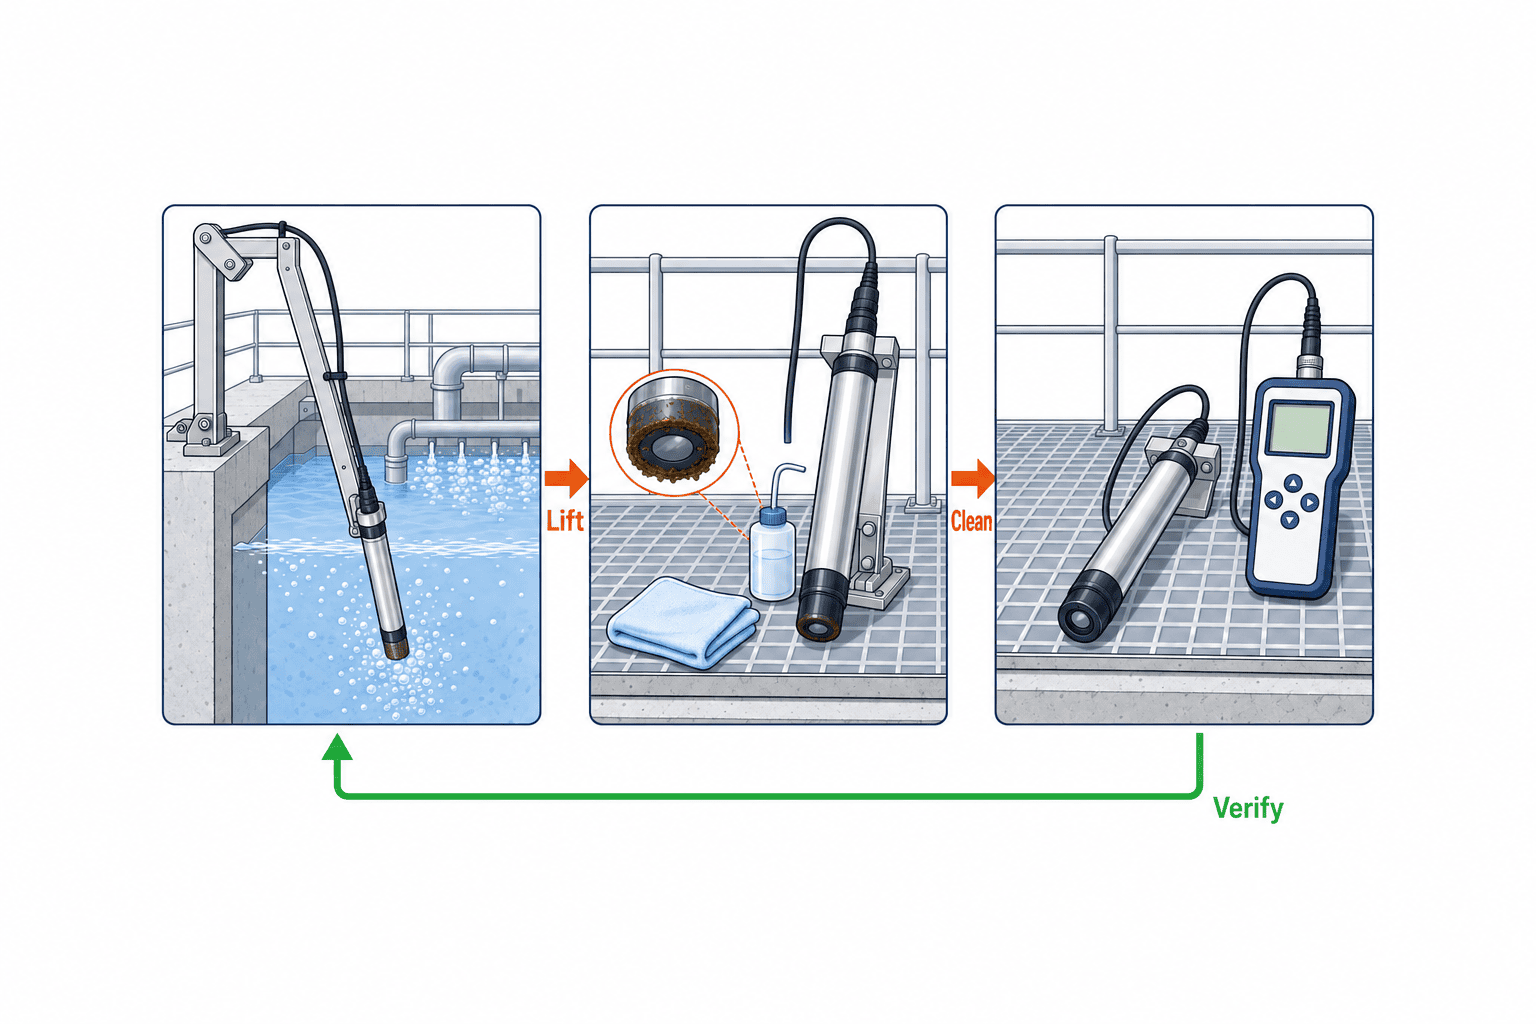
Sludge, biofilm, oil and scale can coat a probe. Watch for slow drift, delayed response and a jump after cleaning. Bubbles adhering to a sensing surface can produce a misleading reading; the Endress+Hauser manual explicitly discusses a high reading in some orientations. Before reducing blower air because DO appears high, compare the signal with blower state, cleaning history and a portable measurement.
Use a repeatable troubleshooting order: record the process and blower phase; inspect bubbles and deposits; read sensor, transmitter and cable diagnostics; compare before and after cleaning; and verify near the installed point with a maintained portable probe. Low DO following a blower stop may be a real process event. A high reading from a probe exposed to air at low tank level is a measurement condition failure. A large cleaning shift suggests fouling, but it does not prove that the cleaned value is correct without verification.
Automatic cleaning can reduce visits, but adds nozzle blockages, air supply failure and false readings during a wash. Specify whether control holds the last valid value for a limited time, changes to an approved fixed air rate, or requires manual operation. Define when a post wash reading becomes valid. Never leave an indefinite hold that conceals a dead sensor.
Manage temperature, salinity and pressure with the displayed unit
DO may be displayed as mg/L or percent saturation. Oxygen solubility and saturation calculations depend on water temperature, barometric pressure and salinity. The USGS DOTABLES tool explicitly calculates solubility, percent saturation and salinity correction using these inputs. A warm or saline industrial stream cannot simply be interpreted using freshwater, standard pressure assumptions. USGS DOTABLES.
Ask whether temperature comes from the DO probe or an external instrument, whether salinity is fixed or updated from site data, and how actual pressure or altitude is represented at calibration. An “automatic temperature compensation” claim does not necessarily address salinity or air calibration pressure. Record the unit and configuration on the HMI and log changes with a time and responsible person. When checking against a portable meter, match sampling point, time, temperature and aeration condition.
Distinguish verification from calibration
Verification checks whether the current instrument agrees with a reference within an agreed tolerance. Calibration adjusts it using a defined condition. Record the value before cleaning, after cleaning and before and after any adjustment separately. Otherwise operators cannot tell whether historic data drifted. Check the portable reference probe’s own maintenance, and compare at the tank without allowing a sample to warm or gain oxygen from ambient air.
The Oxymax instructions describe humid air, zero point and sample methods, and checks after cap replacement; these are model specific procedures. Define site procedures from the actual purchased manuals. The SOP should give the permitted difference, when to clean again, when to recalibrate or replace a part, how long an unverified signal may remain displayed, and when it must be removed from control. Review intervals using drift and cleaning records, not a calendar alone.
Send quality and state to the PLC and SCADA
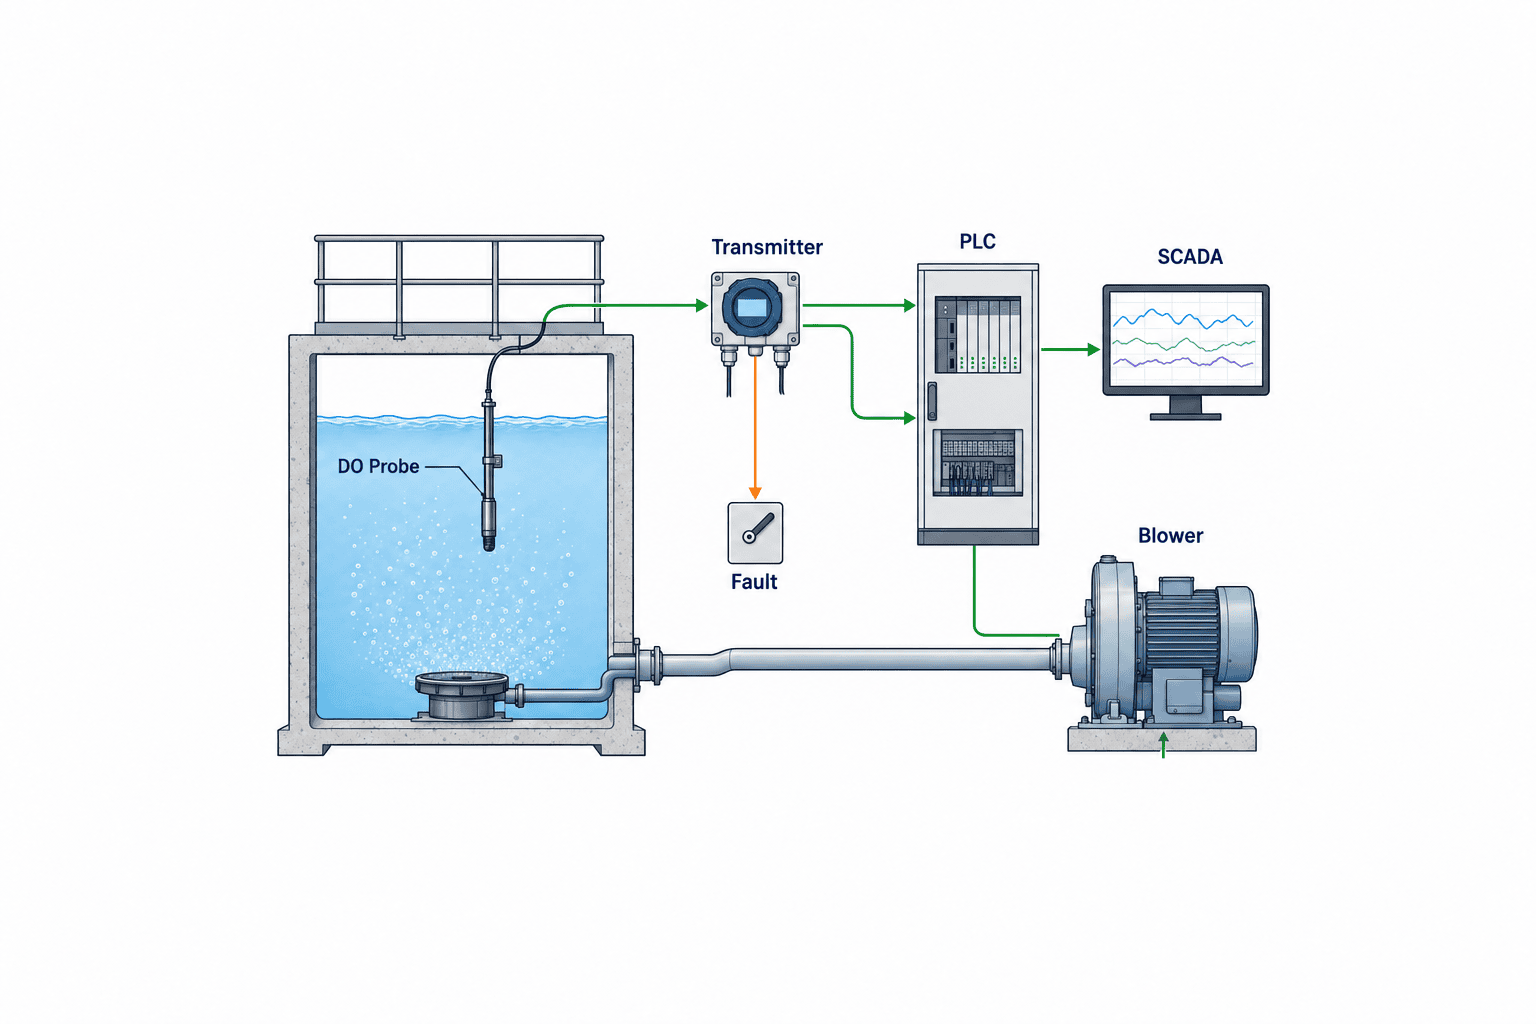
For 4–20 mA integration, define the scaling, diagnostic current, wiring fault, out of range response, isolation and cable length. For a digital link, map value, unit, temperature, fault, calibration, cleaning and communication state to tags. SCADA should trend DO with blower speed or airflow, running state, process phase, influent flow, maintenance events and the time of verification. Keep the raw reading distinguishable from the valid value accepted by the controller. Synchronize clocks; otherwise a chart can suggest a false cause and effect relationship.
A PLC should not blindly feed invalid, frozen or maintenance readings into a PID loop. Agree with operations and the control panel supplier on a bounded last valid value, a safe site approved air rate or manual control when a fault appears. The response must respect blower limits, air valves, equipment protection and the minimum air needed for mixing. Prove it with simulated faults before automatic DO control goes live.
Write the RFP around the whole operating system
The RFP should state the tank, process purpose, water conditions, mounting position, maintenance access, acceptable sensor principles, cleaning and verification method, PLC/SCADA tags, failure response, drawings, training, warranty and local service. Include wetted materials when industrial cleaning chemicals, oil or unusual constituents may enter the process. Ask vendors for an installation drawing, data sheet, I/O list, test plan and spare parts schedule rather than only a brochure.
Prove the configuration at FAT and the installation at SAT
FAT should check transmitter settings, unit and range, analog or digital output, fault and maintenance flags, PLC tag mapping, HMI display, alarm and timestamp with simulated inputs. FAT cannot prove resistance to actual wastewater fouling or diffuser bubbles. SAT should verify water levels, depth and orientation, safe withdrawal, cable protection and comparison with a portable meter under real operation. Test blower changes, a simulated cable or communication fault, cleaning and recovery where this is safe. Accept the installation when it detects invalid data and operators can act on the record, not merely when one reading matches a meter once.
During trial operation review DO trends together with portable checks, cleaning time, alarms, manual interventions, treatment results and blower energy. If production changes or seasonal water conditions were absent from the trial, record a later review date in the contract. Receive as built drawings, tag list, SOP, spares, calibration records, training evidence and service contact at handover.
A field checklist before deciding on the purchase
First draw the current wastewater route and mark the aeration tank. Write one sentence stating the operating decision that needs the DO value. Then survey several candidate locations with a portable meter at more than one time and load. Photograph bubble exposure, deposits, minimum water level and the path for removing the probe. Only after that survey should you compare principles and ask for a pilot installation. Draw the mounting arrangement and safe maintenance access before approving a quotation.
The minimum checklist has seven entries: measurement purpose, point and process phase; sensor principle and required flow; fouling and bubble measures; temperature, salinity and pressure configuration; cleaning, calibration and verification; behavior during maintenance or communication loss; and FAT/SAT acceptance criteria. If any entry is blank, define it before negotiating the purchase price. Procurement owns the cost boundary, maintenance owns access and replacement, operations owns trends and alarms, and OT owns tag quality and storage. Those responsibilities should appear in the RFP and handover plan.
Interpret high, low and frozen readings as different problems
If the display says DO is high while treatment performance deteriorates, separate a sensor error from an uneven tank. A bubble trapped on the sensing cap may bias the reading high, as the COS61D manual warns for certain mounting orientations. One zone may be well aerated while an inlet region with high oxygen demand is not. If air supply and DO are both high, examine both over aeration and a possible reduction in influent load. Before lowering blower output, compare portable readings at several points, influent and effluent results, sludge condition and recent cleaning records.
If DO is low although blowers are running, investigate increasing oxygen demand, blocked diffusers, an air leak, inadequate mixing, probe deposits and probe location. A sensor in a poorly mixed pocket may not describe the entire tank. Increasing air solely to correct a local or faulty reading can raise power use without correcting the process. Put operating conditions, equipment observations and measurement checks on the same timeline so the teams can locate the cause.
A value that never changes is not proof of stability. The PLC may be holding the last valid value; SCADA communication may have stopped; a calibration hold may remain active; or severe fouling may slow the response. Display data age and a quality flag separately from concentration. During blower or process phase changes, check whether a fresh measurement responds as expected. Never allow a stale number that happens to lie within a normal range to govern the blower indefinitely.
Pilot testing must compare operating decisions, not only readings
If comparing two candidates, mount them under as similar conditions as possible and document their precise positions. Include night shifts, restart after a shutdown and cleaning wastewater if these are important loads. Record the process phase, flow, temperature, blower state and wash state with each comparison. A fast sensor can appear slow if the control system filters it heavily; weak filtering can make the blower hunt on bubble noise. Evaluate useful control performance, maintenance hours and unusable data time as well as accuracy.
Assign ownership and keep useful maintenance evidence
Assign operating staff to daily readings and alarms, maintenance staff to cleaning and parts, environmental staff to treatment results, and OT staff to clock synchronization and historian storage. The maintenance log should capture readings before and after cleaning, deposits found, adjustment, parts changed and the time returned to service. A fixed reading can indicate a held PLC value or failed communications rather than stable water. Show both the number and its quality state to every shift.
Define who visits the tank after an alarm, who authorizes a transfer to manual control and who permits return to automatic control. Restrict changes to DO setpoints and compensation parameters to appropriate roles and retain a change history. A useful maintenance entry includes the pre cleaning and post cleaning reading, observed deposit, comparison with the portable reference, calibration results where applicable, part numbers and return to service time. Over several months, those records reveal whether fouling follows a production recipe or season. They can justify moving the probe, adding automatic cleaning or extending an unnecessarily frequent intervention. Train every shift using simulated cable loss, low water level, cleaning and communication loss screens, not only normal trend screens.
Frequently asked questions
Is an optical DO sensor maintenance free?
No. It can remove electrolyte handling for some models, yet its window and cap still need cleaning, inspection, replacement and verification under the product instructions.
What DO setpoint should every aeration tank use?
There is no defensible universal setpoint. Establish one from the site’s treatment objective, load, mixing, sensor position and trial results, then document its owner and review conditions.
Can a sensor at the final outlet control an aeration tank?
The outlet has process delay and cannot directly represent local conditions in the tank. Specify separate measurement purposes and positions. For discharge compliance, apply the site’s actual permit and required analytical methods.
Is one 4–20 mA value sufficient for the PLC?
Only if faults, washing, calibration and invalid data can also be recognized through suitable status signals and logic. Test the loss and recovery sequence during FAT and SAT.
If we can install only one DO probe, where should it go?
Choose from the operating purpose: a representative location or an early warning point for the area most likely to lack oxygen. Survey several points and times with a portable meter. Check the diffuser bubbles, settled solids, minimum water level and safe withdrawal path. If one point cannot represent the tank, record that limitation in the operating procedure rather than calling its reading a tank average.
Conclusion
Select a DO instrument as part of an aeration measurement and operating system. Validate the location, bubble and fouling behavior, compensation settings, maintenance and fault logic in real water. Compare optical and electrochemical models using total cost and operator workload, then accept measurement and control through FAT, SAT and a monitored trial.
If your plant is still choosing a model, a P&ID, tank dimensions, diffuser layout, recent water tests and PLC/SCADA diagram are enough to begin reviewing measurement points and RFP requirements. Contact TOMAS TECH at the planning stage.


