


Selecting an online turbidity meter for a factory takes more than comparing measuring ranges. First identify the water stream, how its particles and bubbles change, how the optical window will be cleaned, and what decision a reading must support. An online instrument turns isolated grab samples into a time series, but turbidity does not replace suspended solids (SS), BOD or COD testing. This guide gives operations, environmental, purchasing and controls teams in Thailand a practical specification from instrument selection to pipework, PLC signals and FAT/SAT.
Define the decision before buying a turbidity meter
Write one sentence beginning “When turbidity changes, we will…”. Examples include checking a filter and backwash when outlet water becomes cloudy, moving to the next production step when rinse water clears, or taking a grab sample when treated effluent changes. “Make water quality visible” is too vague to define range, response, location or alarm routing. Collect samples from normal running, startup, backwash, cleaning and shutdown before proposing an alarm threshold.
Turbidity is an optical response to scattering or attenuation by particles and other material in water. ISO 7027-1 distinguishes light-scattering nephelometry, useful for low-turbidity water, from attenuation measurement, more applicable to highly turbid water. Instruments with different optical designs need not return identical readings from the same sample. Compare measuring principle, source, geometry, range, standard and application as well as the displayed unit. ISO 7027-1
Do not apply a universal conversion from NTU to SS in mg/L. Particle composition, size, shape and colour change the relationship between optical response and mass. EPA explains that turbidity is not a direct measure of the amount of suspended solids. If the plant wants an SS estimate, collect representative samples, compare them with laboratory SS results, and verify a separate relationship for each relevant process stream. Raw water, post-coagulation water and treated water may not share a useful conversion. EPA turbidity overview
Choose measurement points in process and wastewater lines
“One meter at the wastewater plant” leaves the intended fault undefined. Inlet load, clarified water, filter outlet and final effluent have different particle properties and operational purposes. Mark sample points, pumps, chemical dosing, backwash, bypasses and discharge destinations on the process flow diagram. Separate where a disturbance begins from where it must be detected. A common tank far downstream can delay detection of a filter problem; a low-range meter at a rough inlet may spend time beyond its useful range.
For each candidate point, record normal and exceptional values, flow, temperature, pressure, bubbles, oil, sludge, chemicals, sunlight and maintenance access. Add who receives an alarm and whether the next step is sampling, a field inspection or an approved operating change. Collect related signals such as flow, pump state, valve position, chemical dosing and filter differential pressure. They make a turbidity change interpretable later.
A plant whose wastewater programme already follows BOD, COD, pH and flow should position the turbidity meter as an early indication of particle-related change. Our factory wastewater monitoring guide covers the broader monitoring and reporting picture. This article concentrates on purchasing and accepting the turbidity instrument itself. Do not assume an online display replaces a laboratory method or a legally required measurement.
Compare optical methods against the actual sample
Clear water, ordinary process water and high-solids wastewater need different instruments. A low-range scattering instrument can reveal small changes but may be sensitive to bubbles and optical-window contamination. At higher concentrations, more solids do not always yield a continually rising reading: absorption and multiple scattering can alter the response. The Endress+Hauser CUS51D manual warns that a reading can decrease when the instrument’s operational range is exceeded even while turbidity or total solids rise. Test the range over which the signal remains useful with the plant’s own sample, rather than relying on the upper number in a catalogue. CUS51D operating instructions
Insertion or immersion designs put a sensor in the pipe or tank. Bypass designs bring a sample to the instrument. The first arrangement reduces sample plumbing but needs safe removal, cleaning and calibration access. The second can put service work in a convenient location but adds risks of blockage, leaks, low flow, bubbles and sample delay. Even if a vendor calls a design “non-contact,” draw exactly where water is measured, what becomes dirty, and where it drains. Ask vendors to show suitability with the real sample, not merely name an optical method.
Build the comparison around usable range, particle and colour sensitivity, bubble handling, cleaning, verification, spare parts and mechanical fit. EPA Method 180.1 identifies fine bubbles as a potential source of high readings and true colour or light-absorbing material as a source of low readings under its method. Do not assume every device has exactly the same error direction; verify candidates with plant samples containing the likely interferences. EPA Method 180.1
Specify the useful range, not merely the maximum
An RFP stating “0–1000 NTU” does not explain the decision band. Give normal variation, the band where an alarm matters, and the upper excursion during startup or cleaning separately. If the same instrument must see nearly clear water and backwash, ask for evidence that it can resolve changes at the low end and remain interpretable at the high end. Two measuring points may be clearer than one, depending on the process. There is no universal NTU threshold that selects one technology for all waters.
NTU and FNU appear on different instruments and methods. Record the optical method and calibration standard with the unit rather than treating displayed numbers as automatically interchangeable. If a turbidity value becomes a production quality gate, run the new online meter alongside the established laboratory meter on matched samples. The purpose is to understand their relationship and variability, not to force one instrument to imitate the other.
The procurement question is whether a reading supports the plant’s decision on this water. Trial samples should include normal water and foreseeable colour, solids, bubbles and pre-cleaning states. Assess signal stability over time, recovery after cleaning and blockage behaviour. A broad advertised range can narrow in practice with a strongly absorbing or changing process sample.
Design the in-line or bypass installation
For insertion and immersion measurement, seek a representative moving stream. Consider dead zones, high pockets where air accumulates, low pockets where sludge settles and points that cannot be reached for maintenance. Follow the selected instrument’s installation orientation and process-connection instructions. Do not suspend a sensor only from its electrical cable. Endress+Hauser’s installation checks cover physical damage, correct orientation and secure process mounting. CUS52D operating instructions

For a bypass, draw the whole route from representative sample tap to safe drain or return. Review flow adjustment, a sample pump if needed, bubble handling, isolation, drain, flushing, blockage clearance and low-flow detection. Hach’s discontinued 1720E is a historical low-range continuous turbidimeter with an internal bubble-removal path, not a current procurement recommendation. Its arrangement illustrates why air management is part of the measuring system, not proof that one design fits every factory. Hach 1720E
If bypass flow stops while the screen retains its last good value, operators may mistake stale water for a valid sample. Decide how low flow and pump failure invalidate the reading or generate a separate alarm. Sample transport delay matters when the value is used to time a process change. Specify how the line is isolated for cleaning and calibrated, then flushed and returned to service.
Separate fouling, bubbles and water changes
Optical-window fouling is a central operating constraint. Biofilm, oil, scale and chemical residue can cause drift or erratic values. The USGS continuous-monitoring guidance notes turbidity sensors’ sensitivity to fouling and that even a wiper may leave deposits. Compare not only whether an automatic cleaner is offered but also whether the cleaner itself can be inspected and replaced. USGS continuous monitoring guidance
Bubbles can occur after cleaning, pump suction, pressure reduction and at high points in a sample line. EPA Method 180.1 also identifies fine bubbles as a positive interference. Do not attribute every sharp peak to worsening water. Compare its timestamp with flow, valve state, pump starts and the cleaning cycle. Strong colour and changing particle sizes deserve grab samples and comparison with the laboratory method. Related OT signals help distinguish water from instrument faults.
Do not declare an arbitrary monthly cleaning interval on day one. During commissioning record readings before and after cleaning, visual condition and standard-check results. Use those observations and the manufacturer’s guidance to set a local interval. Wipers, compressed-air cleaning and ultrasonic cleaning each require compatible sample conditions, utilities and replaceable parts. “Automatic cleaning” does not mean “no maintenance.”
Plan calibration and verification separately
Calibration adjusts the instrument against a known standard. Verification checks whether the current configuration still meets an agreed tolerance, without automatically changing it. If every service visit starts with an adjustment, a trend in fouling or drift becomes difficult to see. Retain pre-cleaning, post-cleaning and post-adjustment values separately. USGS field guidance calls for clean optics, bubble-free standards and checks with materials of known quality. USGS turbidity field manual
EPA Method 180.1 tells users to follow instrument instructions and use standards spanning the ranges of interest. It is a laboratory method, not a ready-made statutory inspection programme for every online installation. Follow the chosen manufacturer’s procedure and the plant’s quality objective. Manage the standard’s expiry, storage, temperature and container cleanliness. A contaminated or bubbly standard can lead a technician to adjust a healthy meter incorrectly. EPA Method 180.1
Comparison with process water is a different exercise. Align the grab-sample time with the online timestamp and account for sample-line residence time. Settling solids and escaping bubbles can create a difference between field and laboratory readings without proving that one instrument is broken. Record conditions and repeat the comparison in similar operating states. An SS correlation needs renewed evidence if raw material, treatment chemistry or particle properties change.
Carry validity and maintenance states into the PLC
A 4–20 mA measurement alone may be insufficient. Ask how the controller reports dirty optics, cleaning, calibration, low sample flow, communication loss, out-of-range and equipment fault. Different products map these states to analog current, relays or digital messages in different ways. Prepare an I/O list covering normal, alarm, failure and maintenance outputs, wire-break behaviour, PLC scaling and historian tag names. Hach’s online product range illustrates available analog and network modules, but the final signal map must come from the selected configuration. Hach online product documents
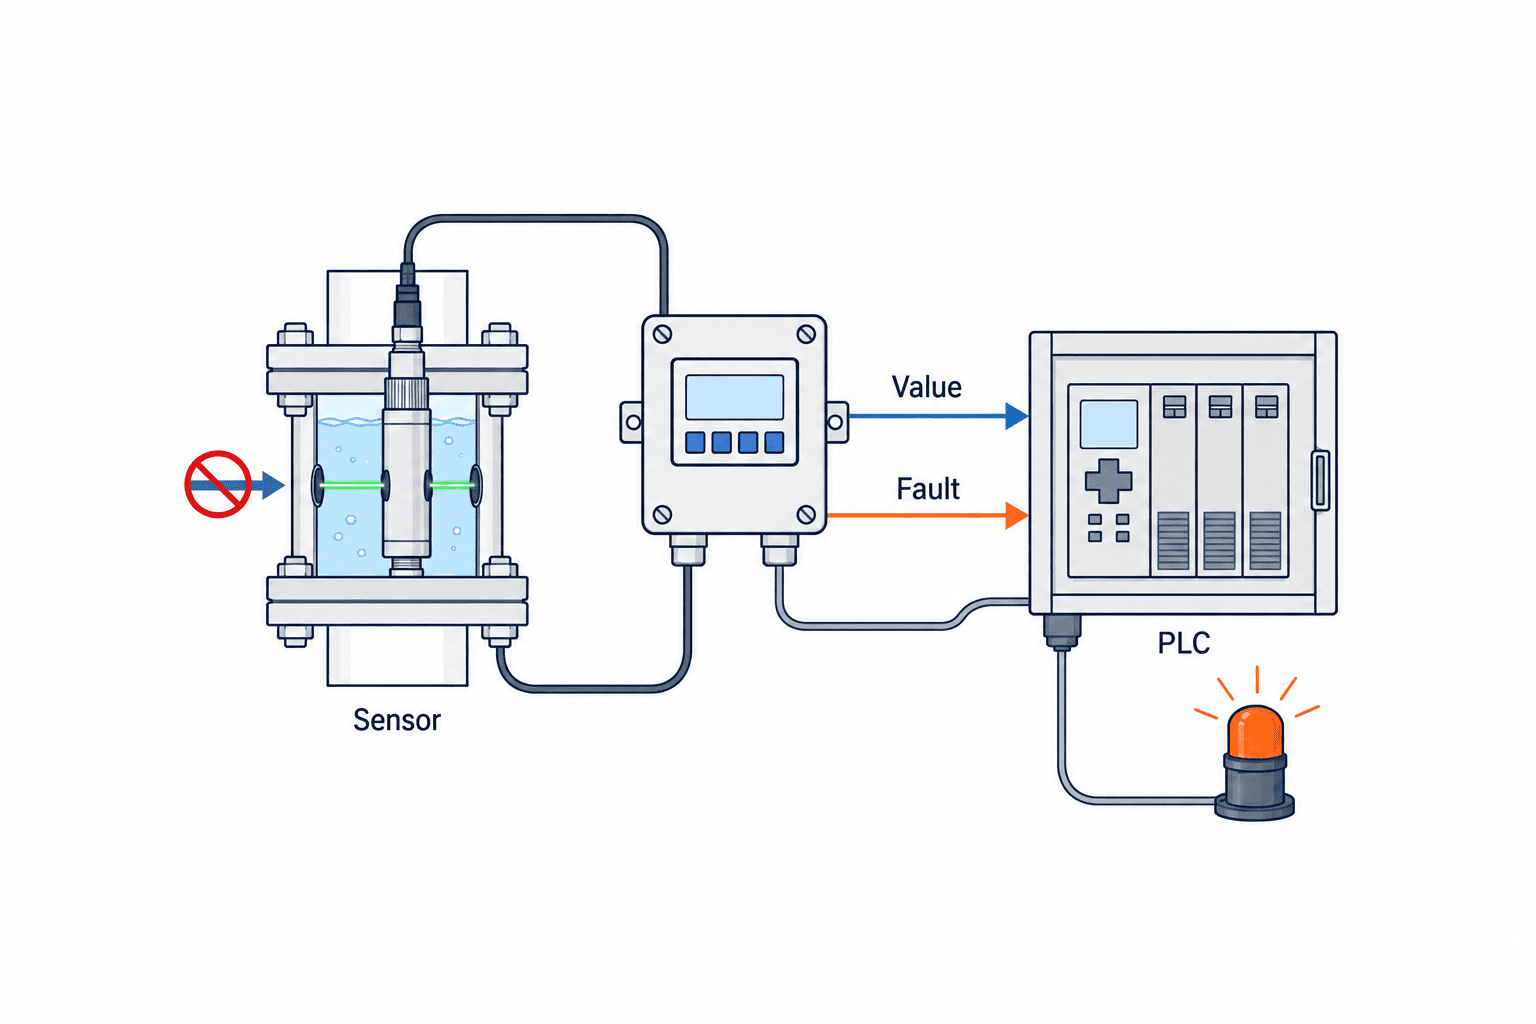
If high turbidity can divert discharge or stop filtration, a plain threshold comparison is not a complete control specification. Define persistence time, hysteresis, startup and cleaning inhibits, behaviour on instrument failure, manual intervention and reset in a Cause & Effect table. Where a discharge decision has legal implications, confirm the permitted measurement and decision process with the local environmental team. An alarm prompting a grab sample may be more appropriate than automatic diversion in some situations.
Store flow, pump state, backwash, chemical dosing, cleaning, calibration and fault states alongside turbidity on the same time axis. Align tag IDs, units, timestamps and invalid-data codes before connecting an existing SCADA or historian. As in our cooling-water leak detection guide, a sensor trend makes more sense when the state of its pipework is visible.
Include consumables and access in price comparisons
Break out the transmitter, mounting, flow cell, sample pump, bubble handling, flow switch, cleaning air or water, power, panel I/O, wiring, safe access, standards, wipers or lamps, commissioning and training. The difference between in-line and bypass life-cycle cost may sit in plumbing, maintenance and drainage rather than the sensor price. Whether the sample is returned or discharged also affects construction and operation.
A contract saying “periodic maintenance included” is too thin. Determine if a sensor can be withdrawn safely while running, how long a shutdown takes, whether standards and parts are locally available, and how the plant measures water quality during an outage. If a cleaner failure threatens data quality, define how that fault becomes visible. State the evaluation period and compare consumables and site visits on the same assumptions. Avoid invented savings percentages; measurable service effort and downtime conditions are more useful.
The instrument with the best catalogue precision is not necessarily best for a bubbly stream with rapid fouling and limited access. Add explicit comparison columns: tested on our sample, cleanable at this point, invalid data distinguishable, and recoverable after a fault. Compare evidence under the same factory conditions, not marketing phrases.
Put these requirements in the turbidity-meter RFP
Give vendors a response column, an exception column and room for evidence:
| Item | Plant input | Vendor evidence |
|---|---|---|
| Purpose | Water stream, decision and alarm response | Appropriate method and why |
| Sample | Normal and exceptional values, particles, colour, bubbles, temperature | Useful range, interferences and exclusions |
| Installation | P&ID, flow, pressure, power and access | Sample, drain and cleaning drawings |
| Performance | Decision band, response and comparison method | Datasheet and sample trial plan |
| Controls | PLC/SCADA and alarm/fault/maintenance states | I/O map and Cause & Effect |
| Service | Available shutdown, people and parts | Cleaning, verification, calibration and cost |
| Acceptance | FAT/SAT schedule and witnesses | Procedure, pass criteria and exception handling |
Provide samples from several operating states if possible. Check stability and cleaning response, not only a bench reading. If samples cannot be supplied before purchase, record that uncertainty and agree a site acceptance condition and remedy before contracting. This protects both the plant and the supplier from a meter that meets a catalogue specification but cannot be used on the actual stream.
Test the complete path in FAT and SAT
FAT can confirm the meter, transmitter, panel and PLC display before shipment. Check model, range, unit, tag, response to standards, analog scaling, alarms, simulated low flow and fault, calibration indication and reset. Keep a test that applies a standard to the sensor distinct from one that injects an electrical signal directly into the PLC. A changing number on a screen verifies only part of the path.
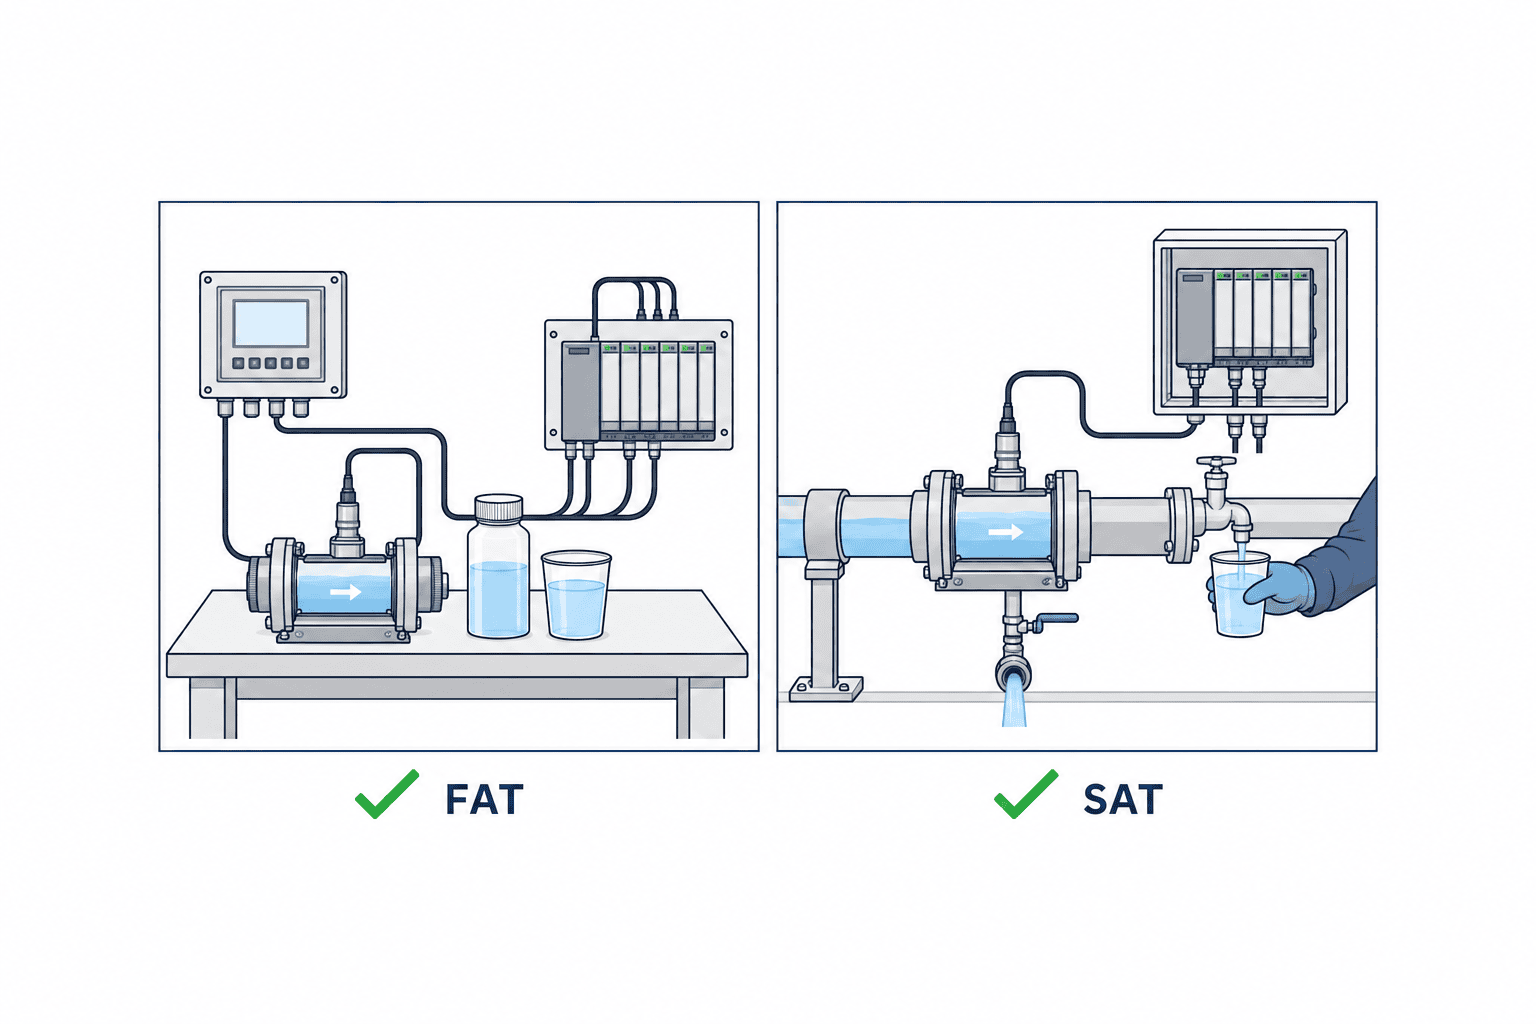
SAT checks the installed tap, flow cell or immersion mount, drain, actual flow, bubbles, cleaning access, wiring and power. Capture normal, startup and cleaning or backwash conditions. Where feasible, take matched samples and compare them with the agreed laboratory instrument. If results differ, investigate location, timing, bubbles, settling and calibration. Pass criteria should cover stable decisions and correct invalidation of faulty readings rather than one isolated number.
The record should show point ID, sample condition, flow, standard lot, before/after cleaning, input, expected and actual result, witness, open issues and retest date. If all process states cannot be recreated during SAT, identify the deferred checks and deadlines. Store subsequent threshold and cleaning-interval changes with their reasons and approvers.
Maintain data quality after handover
In the PLC and dashboard, keep a reading together with validity, cleaning, calibration, low flow and sensor-fault states. Do not label a held last value as good water. Daily reporting should include valid-data coverage and alarm or maintenance time as well as an average. Use flow and pump history to decide whether a jump came from the process or the instrument.
Start with the manufacturer’s service guidance, then adjust intervals using before/after cleaning data, standard checks and process changes. USGS procedures distinguish fouling from calibration drift in continuous records. A Thai factory’s water source, dosing, production mix and seasons can change, so last year’s interval is not automatically suitable. Reassess the representative point and useful range after pipework or process changes. Confirm local legal methods and reporting requirements with the plant’s qualified environmental personnel. USGS monitoring procedures
For a multi-contractor installation, assign ownership of the sample tap, bypass plumbing, power, PLC, standards, training and final documentation before ordering. At handover collect the final P&ID, settings, tag list, calibration record, standard specification, spare-part list, cleaning procedure and fault contacts. The commissioning result is only sustainable if local staff can repeat the verification and explain an invalid reading.
Procurement and handover at a Thai factory
Passing an overseas manufacturer’s specification straight to a local contractor can leave essential maintenance components out even when the instrument model is correct. The equipment supplier, wastewater contractor, electrical and instrumentation installer, PLC team, and environmental team may be different companies or departments. Use a responsibility matrix in the RFP to state who provides the sampling tap, connects the bypass and drain, installs power and panel I/O, and supplies calibration standards. Plan a signal test across those boundaries so that handover does not end with an instrument that operates locally but sends no data to the control room.
The local service quote should cover instructions in the language used on site, witnessed training, treatment of wastewater from cleaning and calibration, and lead times for spares. Define first response, records, and vendor escalation for a damaged optical window, blocked flow cell, or stopped sample pump. Specify a laboratory meter and sampling procedure for temporary alternative measurement. For imported consumables, ask the supplier to confirm standard-solution shelf life, storage conditions, and procurement time including customs clearance. These practical items rarely appear in a product brochure, yet determine whether monitoring can continue.
Collect more than test results at handover: the final P&ID, instrument settings, tag list, calibration records, standard-solution identification, spare-parts list, cleaning procedure, and emergency contacts. Mark the measuring point and drain destination on the as-built drawing. During the initial operating period, review time series from normal running and cleaning to confirm what each alarm means. Save both the old and new settings when tuning is needed, with approval from the environmental and equipment teams.
A comparison sequence that supports a purchase decision
For three candidate instruments, first reject any that cannot measure the target water, then ask whether each can be installed, and finally whether it can be maintained. The first gate checks normal and abnormal samples, particles, colour, bubbles, range and units, and required response. The second checks sampling and drain arrangements, power, pipe removal, cleaning clearance, and PLC signals. The third compares standards, consumables, service staff, fault response, and total cost. Reversing this sequence can force a pipe redesign around a cheap instrument and raise operating costs.
A scoring table is useful, but do not let strengths elsewhere offset an application failure. A meter that ceases to respond monotonically in concentrated wastewater, cannot signal a loss of sample flow, or requires a long production stop for maintenance fails an acceptance gate. If actual-sample testing is incomplete, make it a prerequisite before selection or a contractual SAT condition. Record what has and has not been verified.
Do not give suppliers only a clean normal-running sample at quotation time. List difficult states such as startup, chemical changeover, immediately after backwash or cleaning, and a raw-material change; collect real samples and operating records where feasible. Record sampling time and location, flow, temperature, visible colour and bubbles, and nearby process events for each sample. Give every bidder the same conditions. Mark conditions without a sample as “not evaluated” rather than substituting a brochure accuracy figure. This separates the usable on-site range and extra trial cost even where quoted specifications look alike.
Include post-acceptance change control in the purchase specification. If piping is moved, coagulant is changed, cleaning frequency is revised, or PLC scaling is corrected, identify affected measuring points and alarms. Check online readings before and after the change, a parallel laboratory reading, and the low-flow and fault signals; repeat the relevant SAT cases where necessary. Append the reason, approval, setting revision, and retest result to the handover register so that environmental and operations staff share changes made by a service provider.
Frequently asked questions
Can NTU be converted to suspended solids in mg/L?
Only through a validated relationship for the plant’s own samples, where particle properties stay suitably consistent. There is no universal factor. Changes in raw material, dosing or season can invalidate a correlation. Turbidity is not an automatic substitute for SS, BOD or COD methods.
Is an in-line or bypass online meter better?
It depends on the sample and access. In-line and immersion units avoid some sample plumbing but need service access. A bypass can move service to a convenient location but adds flow, bubbles, blockage, drain and transport-delay concerns. Compare drawings and service procedures for the same duty.
Does automatic optical cleaning eliminate calibration?
No. Cleaning reduces deposits; calibration and verification test a different question. Wipers and nozzles can wear or clog. Follow the selected instrument’s procedure and record both cleaning effects and standard-check results.
Should a high turbidity reading automatically stop discharge?
There is no universal answer. Exclude invalid readings caused by bubbles, low flow or cleaning, and define threshold, persistence, confirmation and reset. Check the consequence of an operating action and applicable local requirements, then verify the Cause & Effect logic at SAT. Starting with a prompt for sampling and field review may be appropriate.
Does one instrument still need an RFP and FAT/SAT?
The documents can be short. The water, location, useful range, cleaning, calibration, state signals and acceptance criteria still need to be agreed. A P&ID, I/O list and test sheet may suffice if they capture what was checked and by whom.
Summary
A factory turbidity-meter specification joins the decision to be made, a representative measuring point, a suitable optical method and range, bubble and fouling control, service procedures, validity signals and FAT/SAT. Maximum catalogue range and precision alone do not prove that useful data will continue at site. Share real sample and plumbing conditions before seeking quotations, and require placement rationale and an acceptance procedure.
If your team is still choosing a measuring point, bypass arrangement or PLC signal map, contact TOMAS TECH. We can use your water characteristics, P&ID and current wastewater practice to organise the purchase specification and site checks.
References
- ISO 7027-1:2016, quantitative methods for water turbidity
- EPA Method 180.1, nephelometry, interferences and calibration
- EPA, what turbidity does and does not measure
- USGS, continuous water-quality station procedures
- USGS, turbidity field calibration and verification
- Endress+Hauser CUS51D, wastewater and solids operation
- Endress+Hauser CUS52D, installation and cleaning
- Hach 1720E, continuous measurement with bubble removal


