


When deploying AI anomaly detection with thermal imaging in a factory, the first decision is not the model name. Decide which part of which asset will be compared, under which load and imaging conditions, and who will make the maintenance decision. An industrial thermal camera observes radiation from a surface. A red area on the display does not prove a fault: reflective metal, camera distance, and heat reflected from the surroundings can all alter the apparent temperature. This guide is for factory teams in Thailand preparing a procurement and implementation plan. It connects fixed and route-based inspection, image quality, AI, maintenance decisions, the request for proposal (RFP), factory acceptance testing (FAT), and site acceptance testing (SAT).
Scope and the deployment sequence
The examples are motor connections, bearing housings, electrical joints, pumps, and the external surfaces of heating equipment—locations where a thermal pattern can provide evidence about asset condition. For enclosure cooling capacity and thermal design, see our control panel thermal design guide. For a broader approach that combines vibration, current, and other measurements, see vacuum pump condition monitoring. Here we focus on turning thermal images into comparable evidence and routing suspected anomalies to a person who can act.
The sequence is: specify a failure mode and decision owner; control image acquisition; record normal variation; establish a simple rule baseline; test whether AI adds value; and accept the system at the site. Do not order a shutdown from a colour palette alone, or treat an AI alert as a confirmed repair order. A thermal image estimates surface temperature and its distribution from radiation in the field of view. It does not by itself identify root cause, remaining useful life, or the need to stop. FLIR’s measurement documentation highlights emissivity and reflected apparent temperature as particularly important parameters.
Define the anomaly before buying a thermal imaging AI system
“Notify us when it gets hot” produces alarms whenever operating load rises. Connect an asset, a component, and a suspected failure mode in one statement. For example: at a specified motor operating mode, a connector in the terminal box remains hotter than comparable connectors and the difference cannot be explained by current, so a maintenance technician should inspect it. An anomaly may be a threshold exceedance, but it may also be a phase-to-phase difference, a change relative to the same part’s history, a cooling profile, or a residual relative to load and ambient conditions.
Do not assume that identical model numbers imply identical operating temperatures. Speed, load, ventilation, covers, surface finish, and placement change the measurement. Rank candidate assets by the consequence of failure, whether the relevant failure mode produces observable heat, access and line-of-sight, safe imaging, availability of load data, and whether there is a feasible action after an alert. A high-risk internal component that cannot be viewed is a poor candidate for thermal imaging as the sole sensor.
Failure modes and what to observe
| Suspected issue | Thermal observation | Additional context | Human check |
|---|---|---|---|
| Local heating at a connection | Difference from comparable connections and growth of the hot region | Current, operating duration, enclosure ventilation | Connection, discoloration, and contact under the applicable safety procedure |
| Rising temperature near a bearing | Surface pattern and trend in steady operation | Vibration, speed, lubrication and load history | Lubrication, misalignment, wear, and other possible causes |
| Asymmetric heating on a pump casing | Difference between predefined suction and discharge regions of interest (ROIs) | Flow, pressure and operating mode | Process conditions and the asset itself |
| Hot area on the exterior of a furnace | Location and persistence of an external hotspot | Setpoint, production stage, insulation repair history | Safety measures and insulation condition |
This table is an investigation entry point, not a diagnosis guarantee. A hot bearing housing cannot be labelled “insufficient lubrication” from the image alone. Compare operating history and other signals, then inspect the asset if needed. AI can prioritise images and components for investigation; it should not silently assert the root cause.
Fixed camera or inspection route?
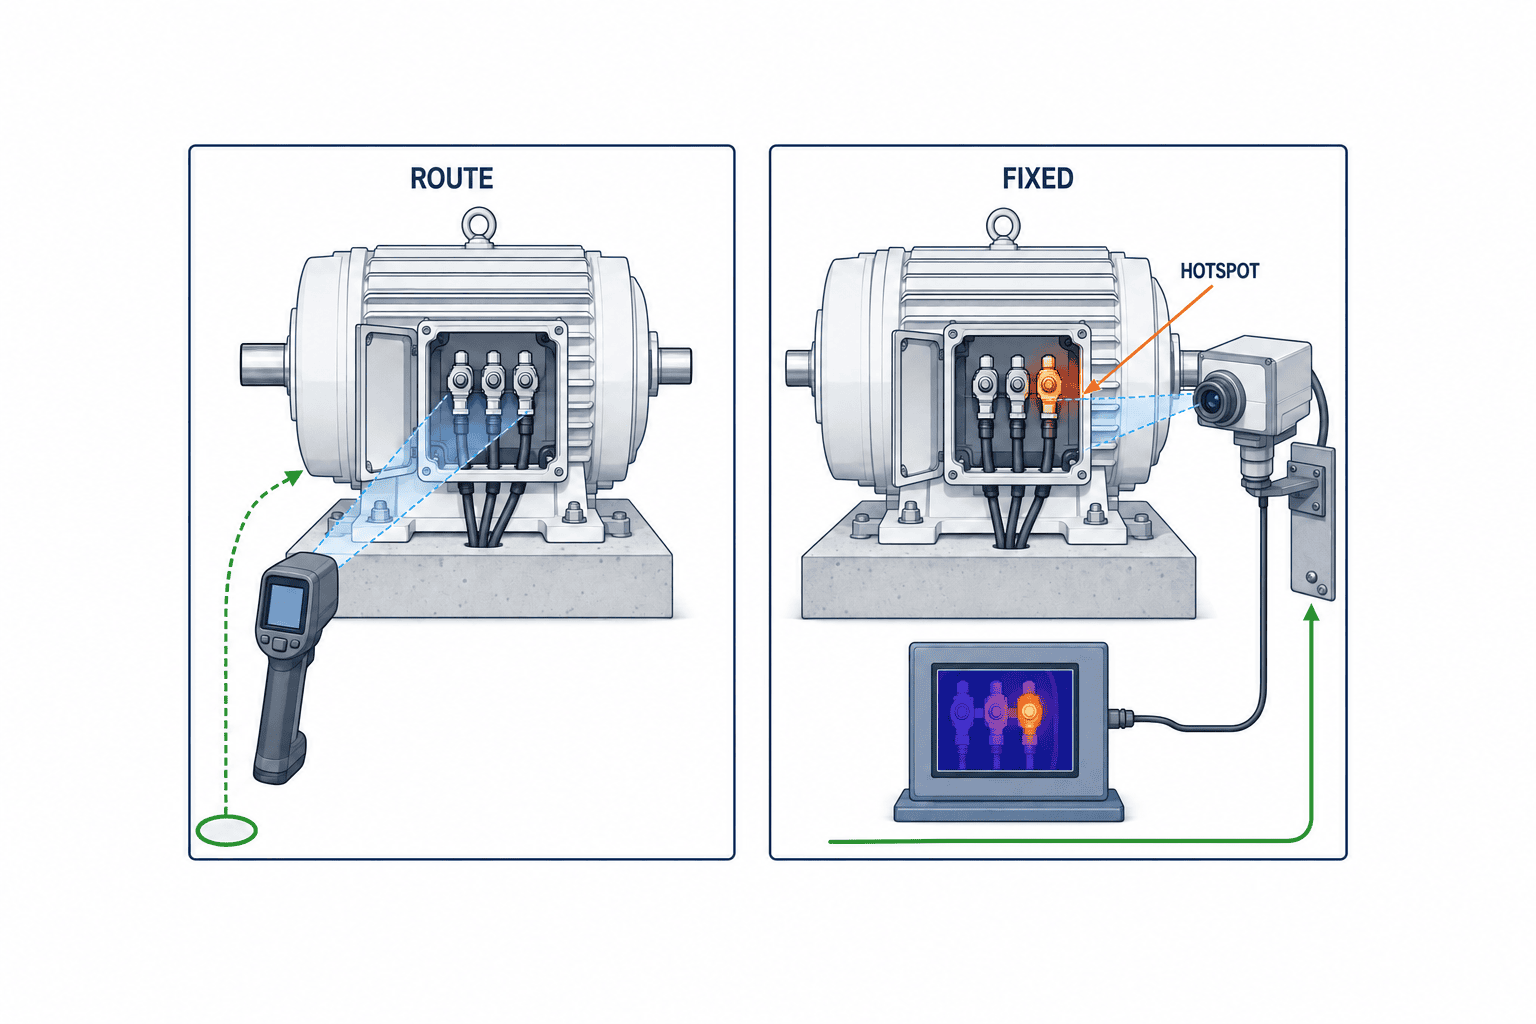
A fixed camera observes the same region from a stable position continuously. It can suit difficult-to-access locations, rapidly developing faults, and high-consequence assets that require a short time to alert. FLIR’s continuous-monitoring overview describes fixed cameras and temperature-threshold alarms. However, fixed monitoring also brings lens selection, mounts, protective enclosures, power, wiring, cleaning, calibration, networking, and software integration. It cannot observe surfaces behind an obstruction or outside its field of view.
A route-based inspection can cover many assets without installing a camera at each one. Its weakness is repeatability. If the technician changes the angle, distance, focus, operating load or measurement settings, the trend is unreliable. Define an asset ID, viewpoint photograph, target ROI, route order, and operating conditions for each capture point. If a good view would require unsafe access, review the method with the site safety team instead of expecting a technician to move closer.
In an August 2026 FLIR case study, a data-centre operator moved from quarterly handheld inspections of critical electrical assets to fixed continuous monitoring with alerts linked to each asset’s operating parameters. It illustrates the timing and routing decision; the case’s insurance result is not a forecast for Thai factories.
The approaches can be combined. A route can establish which failure modes are visible before important points are converted to fixed monitoring. Conversely, a rapidly developing problem during unstaffed hours may not tolerate the gap between route visits. Evaluate the allowable interval from fault onset to action, stability of the view, access, outage consequence, and staffed response hours. Comparing only the purchase price hides both unattended risk and the labour required to manage alarms.
Control the imaging conditions before training AI
Store capture conditions with each image. At minimum, record asset and component IDs, camera and lens, position, angle and distance, focus, emissivity setting, reflected apparent temperature setting, ambient conditions, timestamp, operating mode, load indicator, and work status. Keep the camera’s measurement metadata and join plant-specific information from the PLC, MES, asset register, and inspection records. Otherwise, the team cannot later explain whether a temperature rise followed a load change.
Emissivity, reflection, and shiny surfaces
The same true surface temperature can produce different observed radiation on surfaces with different finishes. Do not compare two components by their displayed numbers alone when one has a different coating. Shiny metal can reflect a nearby hot object and appear hot itself. If a reference surface or treatment is considered, confirm equipment safety, electrical safety, and warranty implications first. Specify in the RFP whether emissivity will be measured on site, drawn from appropriate product data, or avoided by restricting comparisons to the same surface over time. FLIR’s measurement guide discusses emissivity, reflected temperature, and distance corrections.
Target size, distance, and focus
A hotspot visible in the image may occupy too few detector pixels for reliable temperature measurement. Small terminals, bolts, and belt edges are especially vulnerable to mixing with the background. FLIR’s distance guide explains that the target needs to fill the measurement spot. A camera placement guide for a specific FLIR device discusses a 3-by-3-pixel condition; this is not a universal performance promise for every product and application. Test the proposed camera, lens, installation distance, and smallest relevant anomaly on the actual asset. Poor focus blurs the pattern as well as the measurement. A lens chosen only to fit a whole machine in one picture may fail to resolve the component that matters.
Load and operating stage
Motor and electrical-joint temperatures respond to load. Comparing a low-load baseline with a high-load production image can generate a false alert. Choose a load proxy such as current, rotational speed, throughput, or operating state. When none is available, maintain separate baselines by operating mode and return “not comparable” when conditions cannot be matched. A request to capture again is more honest than forcing an unexplained image into a normal or abnormal class.
Environmental variation in Thai factories
Indoor versus outdoor placement, sun exposure, rain, changes in air conditioning or ventilation, and recent washing can all change the image. Humidity, condensation, dust, oil, and dirt on a protective window degrade quality. Do not merely raise every threshold because the site is in Thailand. Define a usable environmental range and a cleaning or revalidation trigger for each location. Sample normal conditions across relevant shifts, product changeovers, and seasonal operation. If environmental changes are repeatedly labelled as faults, technicians will stop trusting the alarms.
Put the measurement plan on one page before production use
If the team registers a single “normal image” immediately after installing the camera and then starts live alerts, it will not know the normal range of variation. Create a measurement plan for each asset and define what “comparable conditions” mean first. Each row should identify the asset, component, suspected failure mode, ROI, reference component or image, minimum operating conditions, camera viewpoint, measurement settings, and decision owner. For a fixed installation, attach the field-of-view drawing and mount location. For a route, attach a photo of where the technician should stand and the camera orientation. Complete this plan before collecting baseline images; selecting a convenient comparator only after seeing an apparent hotspot can distort the conclusion.
Normal data should cover variation on the same asset, not merely a large number of assets. Distinguish start-up, steady operation, the period following a load change, and the approach to shutdown. Where sun exposure or air conditioning matters, sample the relevant times of day. There is no universal number of days or frames. Continue until the relevant operating modes recur, matching load and images are available, and the plant team can explain ordinary temperature movement. You need not wait for a rare failure to establish what is normal. Record why an image was retaken and whether the surface or protective window was cleaned.
Entry conditions for an assessable image
Place a quality gate ahead of the model. Do not score the difference from history as an equipment fault when the asset is outside the field of view, the ROI is blocked, the image is out of focus, the camera clock is out of step with the load record, the load is outside the agreed range, a window is dirty, or a measurement setting changed. The screen should say “unable to assess,” explain why, and route the user to retake the image, clean the window, synchronise clocks, or wait for comparable operating conditions. Without this gate, the model may react to missing context or capture defects while maintenance cannot distinguish them from an actual asset problem.
Do not finalise candidate alarm limits from images at a desk. Match previous inspection and repair records to their timestamps and check whether a thermal change was visible beforehand. If the available history contains no confirmed thermal fault, do not assume that the camera has demonstrated predictive value for that asset. Continue the controlled comparison. Agree with technicians on the sign to detect, the workload of false alerts they can manage, and a separate list of high-consequence events that must not be missed. Run a simple absolute limit, a relative comparison, and the AI method on the same period of data to isolate the AI’s additional benefit.
Walk one alarm through the whole process
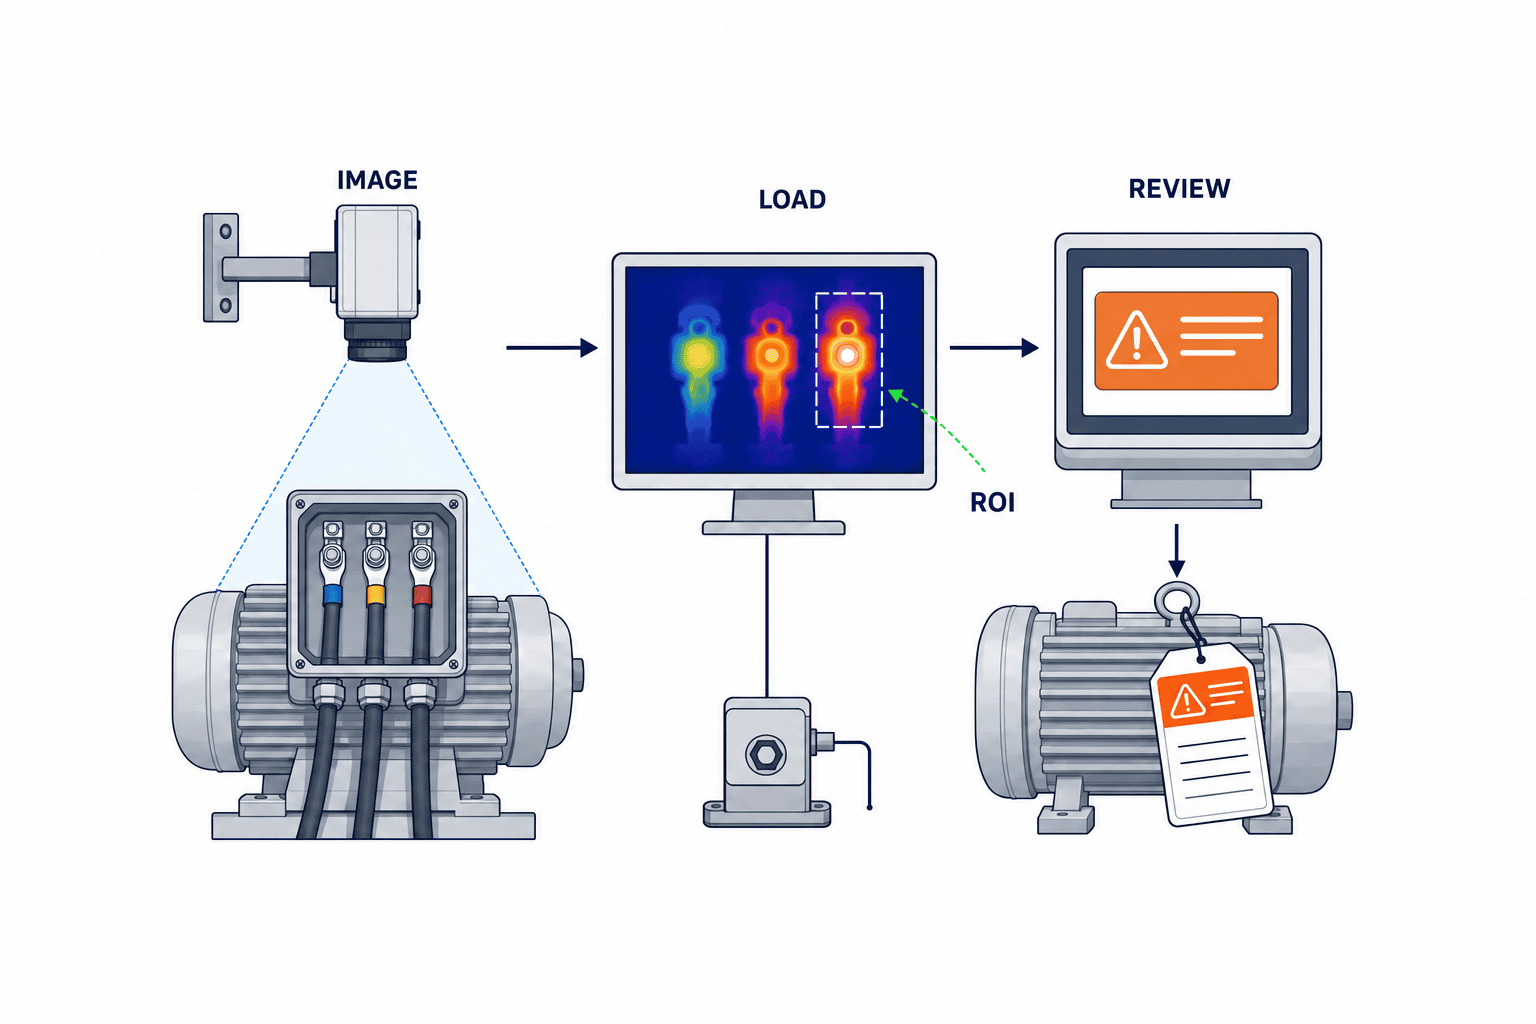
A small trial should not stop after a simulated hotspot image triggers a model alert. Confirm that the site screen identifies the correct asset and component, the alert reaches the actual duty recipient, and the recipient can open the thermal image, visible reference and load history, order a repeat capture or inspection, and return the finding to the asset history. Test a brief network outage: how late is the notice, and does recovery cause duplicate alerts? A simulated image can verify this end-to-end route, but it cannot establish the detection rate for genuine equipment failures.
Set response targets, including any number of minutes, with the plant’s staffing pattern and the asset’s consequence in mind. Continuous night-time capture with no night-time responder may produce records without reducing risk. For a different asset, a route inspection reviewed the following morning may be sufficient. Treat the response and documentation process as an acceptance requirement with the same weight as the camera and model specifications.
Give AI three distinct responsibilities
First is image-quality gating. Is the component in frame? Has the viewpoint moved? Is the focus sufficient? Is the window clean? Are the operating conditions comparable? If not, return “unable to assess.” Second is thermal-pattern comparison: predefined ROI distributions, the size of a hot region, differences between comparable components, persistence, and residuals relative to load may all be informative. Third is operational routing: decide whether the technician should retake the image, check another signal, schedule an inspection, or escalate to a shutdown decision.
Retain a fixed threshold and a like-for-like component comparison as baselines. Rare failures may not support a supervised classifier for every fault type. Consider normal-behaviour modelling, comparison with matched historical images, or supervised classification only where the labels and maintenance purpose justify it. Compare methods by alerts per asset and shift, missed confirmed events, and time from detection to human review, as well as conventional precision and recall. The evaluation unit should be a maintenance event and its response, not merely a large number of near-identical image frames.
Data splits and labels
If adjacent frames from one fault appear in both training and test sets, the measured performance is inflated. Hold out periods, assets, and operating conditions in a way that resembles deployment. Component replacement, camera exchange, lens change, and a shifted mount change the data distribution; record these interventions. Separate “AI raised an alert” from “inspection confirmed a loose connection.” An alert without a confirmed investigation is not a verified fault label.
Tuning only to reduce alert counts may lower the apparent false-alarm rate while increasing misses. Specify both the cost of missing a serious event and the number of alerts people can realistically handle. Keep existing safety circuits, protective relays, and operating procedures clearly distinct from AI advisory output. A model update or network failure must not leave the responsibility for asset protection ambiguous.
Design an alarm that maintenance can use
An alert should include asset and component, current and reference images, ROI, load and operating mode at comparison, recent trend, image-quality state, reason for the alert, and the immediate next action. Pair a visual-light reference with the thermal image so that a moved camera can be recognised. Record who reviewed the event, what was checked, the result of a repeat capture, the work order, any cleaning or repair, and confirmation that the issue was resolved. These verified outcomes are the most valuable future training data.
Route notifications according to priority and staffing: the asset owner during normal hours, the duty team at night, and an authorised manager for a shutdown decision. Suppress repeated notifications from one continuing event, distinguish a network or camera fault from equipment overheating, and escalate unattended alerts. For operators new to thermal imaging, keep the first choices simple: immediate escalation, on-site check, planned inspection, or retake. If the data flows into an AI-assisted maintenance work report, preserving evidence and asset IDs matters more than generating polished prose automatically.
Compare total implementation cost, not camera price
Request separate prices for the site survey, camera and lens, mounting and protection, power and network, edge or server hardware, storage, plant-system integration, initial data capture, annotation, FAT/SAT, training, calibration, cleaning, service, and model updates. Route-based inspection also consumes planning, technician training, capture time, file management, and review time.
An investment case needs historical failure frequency, whether a failure is likely to appear as heat before action is required, existing inspection coverage, expected outage impact, and alarm-handling effort. Rare failures cannot always produce a demonstrable saving during a short proof of concept (PoC). In that case, do not invent a payback claim. First accept repeatable capture, the smallest detectable target under agreed conditions, and an actionable alarm; measure avoided failures over a longer period. A camera’s catalogued thermal sensitivity or temperature accuracy is not the same as field fault-detection accuracy.
Set the exit conditions for a small PoC
Before the PoC begins, specify what success will trigger and what a failed result will change. Test different loads, times of day, viewpoints, and operators on the first asset before multiplying installations. Run AI suggestions alongside the existing human process; do not turn them directly into shutdown commands. Classify false alerts by imaging, operating context, model, or maintenance interpretation. A camera-position fix cannot be achieved by retraining a model.
The public abstract of ISO 18434-1:2008 identifies reflected apparent temperature, emissivity and attenuating media among the compensation topics for machinery thermography. The public abstract of ISO 18434-2:2019 identifies image interpretation, anomaly severity, safety and reporting. These abstracts help frame procurement questions; this article does not claim compliance with requirements in the paid full standards.
RFP: what suppliers should be asked to deliver
“Thermal AI system, one set” is not a comparable specification. Request the following per asset group.
| Topic | Requirement or question | Evidence |
|---|---|---|
| Coverage | Asset IDs, components, smallest hotspot, inspection frequency | Layout, field-of-view drawing, blind spots |
| Imaging and measurement | Camera and lens, distance, angle, focus, emissivity and reflection treatment | Sample images from the proposed setup and measurement settings |
| Operating context | Load proxy, modes, conditions that prevent comparison | PLC/MES data map |
| AI decision | ROI, rule baseline, “unable to assess,” updates, explanation display | Decision logs on representative data |
| Notification | Priority, recipient, response target, escalation | Alert screen, history, work-order interface |
| Reliability | Power and network loss, camera fault, cleaning, calibration, cybersecurity | Fault procedures and responsibility matrix |
| Acceptance | FAT/SAT conditions, retesting, treatment of unmet criteria | Test plan, result forms, handover documents |
“Smallest hotspot” means the physical size of the event the plant needs to detect. Check whether it can be resolved from the actual mounting point, not merely whether the catalogue lists enough pixels. Ask what raw radiometric data and metadata can be exported, in which format, who owns them, what APIs exist, and whether historical images remain comparable after an upgrade.
Reject a bare claim of “AI accuracy X%” as an acceptance criterion. Ask which assets, loads, periods, and independent confirmed maintenance events supported it. Safe simulated anomalies can test the detection path, but their success is not a field detection rate for actual failures. Any performance commitment must use metrics measurable in the local installation.
FAT: test functions before shipment
FAT checks whether the supplied system performs the agreed functions before installation. It cannot reproduce all site conditions and should not be described as proof that every future site fault will be detected. Test camera input, ROI configuration, context-data mapping, rule and AI outputs, notification, audit logs, access control, recovery from network loss, and model rollback. Deliberately introduce a mismatch between image and PLC timestamps. These are defects that can be corrected before the installation team goes to site.
For each case, record the input, conditions, expected result, observed result, evidence file, pass/fail result, and retest owner. Include images with the target absent, poor focus, missing metadata, and a changed operating mode. The intended result may be “unable to assess,” not “fault.” Route test alerts to a test recipient. A demonstration using only pristine catalogue images does not establish operational readiness.
SAT: accept the system in the real plant
SAT checks the installed system with actual equipment, conditions, and responders. Verify mount stability and vibration, dirty protective windows, solar reflection, power interruption, network delay, PLC/MES load inputs, night recipients, and technician response. Capture site baseline images and document that the specified component occupies the intended field of view and sufficient pixels at acceptable focus. Passing FAT does not replace this site check.
The observation period must cover the operating modes agreed for acceptance. Do not sign off high-load performance after observing only low-load production. Any safe thermal test target must stay within the plant’s safety procedures and equipment limits. If no real fault occurs during SAT, do not calculate a fictional fault-detection rate. Accept imaging quality, missing-context handling, notification delivery, human review, and classification of false alerts; carry verified fault performance into a longer operational review.

Accept the device, data and human response separately
Acceptance has three layers. Device: the target is imaged and camera or network faults are visible. Data: image and operating state can be joined, and non-comparable conditions are identified. People: the named responder receives, reviews, checks and documents an event within the agreed time. Passing one layer alone does not deliver a functioning maintenance process. The handover should name owners, out-of-hours coverage, cleaning frequency, recalibration trigger, model-change authority, and the cadence for reviewing unresolved alerts.
Keep the baseline current after deployment
Record camera relocation, lens replacement, repainting, insulation repair, part exchange, recipe changes, and seasonal changes in ventilation or air conditioning. Tie the date, location, and reason to the image history. Decide when a new baseline is required and whether older data remain comparable. Compare old and new models on the same evaluation set and review real alert and miss behaviour before deployment.
Review time to investigation and action, cause of alarms, recurrence, and faults outside the thermal camera’s scope—not just alert counts. Rising “unable to assess” events from dirt indicate a cleaning issue. Alerts only at high load suggest missing context. A missed fault that never produced a thermal signature may call for vibration, current, pressure, or another method. Improving acquisition and data joins can be more effective than repeatedly changing the model.
Frequently asked questions
Can a factory start with temperature thresholds rather than AI?
Yes. Specify comparable operating conditions, ROI, threshold, persistence, and recipient. This rule is also the benchmark against which to test AI. Add AI when the plant demonstrates a specific limitation: load-sensitive thresholds, complex patterns, or multiple relevant components. A simple rule is sufficient for some assets.
Should we buy fixed or handheld thermal cameras?
Consider fixed monitoring when a fault could develop faster than the route interval and the view is stable. Consider a route when many targets develop slowly and technicians can reproduce capture conditions. Fixed cameras have blind spots and maintenance needs; routes cost labour and produce variable images. Decide using the allowable time to action for each asset.
How should we accept ROI and AI performance?
Define each ROI on a drawing and a real image; use “unable to assess” when the object disappears or the view moves. Evaluate on site data from independent periods and operating modes using missed confirmed events, actionable false alerts, and time to review. When faults are rare, accept the imaging and response workflow first and define longer-term verification. Do not equate a camera’s temperature specification with AI fault-detection performance.
Why are RFP, FAT, and SAT all necessary in a Thai plant?
The RFP aligns what bidders are pricing; FAT proves functions before installation; SAT tests load, sun, network, and people at the actual site. Each produces different evidence. Even a small first deployment benefits from recording all three so that acceptance and later improvements have an agreed basis.
Conclusion
Factory thermal imaging AI is a plan to acquire comparable evidence, not a purchase of coloured images or scores. Choose the asset and failure mode, control emissivity, reflection, target size, focus, load and environment, compare simple rules with AI, define “unable to assess,” and connect alerts to human maintenance decisions. One asset that can be imaged, compared, and acted upon is a better foundation for expansion than a large camera rollout without acceptance evidence.
If you are still selecting candidate assets or comparing a fixed installation with an inspection route, contact TOMAS TECH. We can help map operating conditions and existing maintenance steps before deciding what the image should measure and what requires a person or another sensor.
Sources
- FLIR, Measuring temperatures: emissivity, reflected apparent temperature and measurement settings.
- FLIR, How Far Can You Measure with a Thermal Camera?: distance, field of view and target size.
- FLIR, Camera placement guidelines: model-specific placement and hotspot-size guidance.
- FLIR, Continuous Monitoring: fixed monitoring and alarms.
- FLIR, Critical Asset Monitoring for Thermal Conditions: industrial examples of ROIs and alarms.
- ISO, ISO 18434-1:2008 public abstract: general thermography procedures and measurement-compensation topics.
- ISO, ISO 18434-2:2019 public abstract: image interpretation, severity, safety and reporting topics.
- FLIR, August 2026 fixed-monitoring case study: an example of moving from quarterly route inspections to continuous monitoring.
- FLIR, The secret to a good thermal image: focus, distance and recording operating conditions.
*The checklists and test cases are practical implementation examples derived from these sources. They do not guarantee the measuring performance of a particular device, electrical safety, a maintenance diagnosis or a financial return.*


