


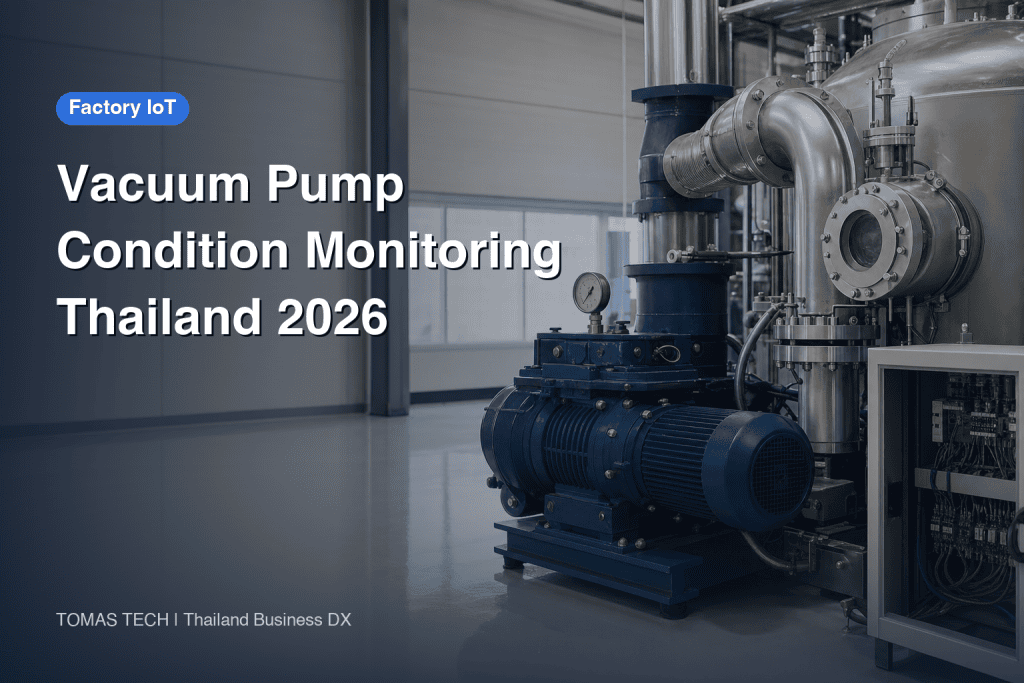
When considering the implementation of vacuum pump condition monitoring, the first decision should not be the sensor model number. It is essential to determine which aspect of “vacuum deficiency” directly impacts quality, downtime, or scrap in processes such as packaging, molding, drying, and coating. Then, design measurement points that can isolate these phenomena by analyzing the pump alone as well as the piping, chamber, and process conditions. Simply displaying the ultimate pressure on a screen and grouping alarms for leaks, filter clogging, cooling failure, and oil degradation together will not speed up on-site decision-making. This article organizes the measurement points, data design, RFP, FAT/SAT, and cost-effectiveness perspectives for monitoring existing vacuum pumps in Thai factories.
Do Not Limit Vacuum Pump Monitoring to “Pump Failure Prediction” Only
Manufacturing sites face issues beyond just motor abnormalities. For example, in vacuum packaging, the required pressure may not be reached before sealing; in vacuum drying, moisture may not be removed within the specified time; in vacuum conveying, the workpiece may fall; and in molding, defects may appear in the molded products. These process symptoms often appear first. Before competing on the accuracy of failure prediction, it is essential to record the process-required vacuum level, pump-down time, pressure rise during holding, the number of pumps operating simultaneously, and cycle time. All of these vary depending on the product, recipe, volume, valve operation, season, and whether maintenance was recently performed. It is important not to judge different operating condition values by a single threshold.
When investigating vacuum system malfunctions, Busch cites insufficient vacuum, prolonged pump-down time, unstable pressure, abnormal noise, overheating, and increased current, recommending that not only the pump but also piping and process condition changes be examined. Pfeiffer Vacuum also explains that the ultimate pressure is influenced not only by the pump’s exhaust speed but also by loads such as leaks and released gases. Therefore, operations that automatically conclude “pressure rise = pump failure” should be avoided. The success of monitoring is evaluated not by the rate of correctly identifying failure names but by whether the responsible personnel can narrow down the cause before it impacts quality.
Determine the Initial Monitoring Scope Based on the Process
When selecting targets, it is more effective to choose one system that significantly impacts stoppages, yield, and recovery time rather than uniformly attaching sensors to all units. The equipment ledger should consolidate pump type, model, serial number, oil-sealed or dry type classification, connection destination, standby units, maintenance responsible personnel, existing signals, drawings, and rated power supply. Next, review three to five recent vacuum deficiency cases, organizing them chronologically by “which pressure gauge was monitored and what was observed,” “which valve was closed,” and “whether recurrence occurred after maintenance work.” For equipment with no recorded symptoms, prioritize collecting baseline data during the first month.
Clearly define the monitoring boundary. Pressure on the chamber side indicates the process outcome, while pressure at the pump inlet is effective for isolating issues in piping, valves, and pumps. Values on the pump discharge side or before and after the exhaust filter serve as indicators for blockages or backpressure depending on the pump type. However, since measurement ports and allowable backpressure vary by model, first confirm the installation points with the manufacturer’s manual and safety conditions. For oil-sealed pumps, oil temperature, oil level, and oil replacement history are candidates; for water-cooled types, flow rate and inlet temperature are also candidates. Some dry pumps still use lubricating oil in their gearboxes or bearings. Section 7.5.1 of the Edwards EXS manual specifies oil-level checks for the gearbox and related components. Check the exact OEM model manual to decide whether and how to monitor oil level, and separate RFP requirements by model so flow meters are not requested for units without water cooling.

Select Measurement Points as “Combinations That Can Separate Causes”
The minimum configuration includes absolute pressure on the process side, pump operation signals, pump-down time, alarm history, and maintenance history. The next step adds inlet pressure, current or power consumption, and pump temperature. Vibration measurement is useful for monitoring bearings and installation conditions but should be added after deciding the pump type and measurement location. Pfeiffer’s Roots pump manual specifies measurement locations such as bearing side, opposite side, and motor side, and recommends evaluating trends relative to startup reference values. The same document also states that general uniform thresholds cannot be provided. This caution is not a basis for directly transferring numerical values to other pump types but should be used as a design principle of “fixing model, location, and conditions to observe changes.”
For pressure gauges, confirm measurement range, accuracy, contamination, condensation, cleaning, calibration method, and installation location. If the pressure difference between the chamber and inlet is large, suspect resistance in piping, valves, or filters; however, since flow rate and gas load changes also affect the difference, compare under the same recipe and process stage. Clearly specify start and target conditions for pump-down time. Simply stating “seconds from startup” cannot explain whether the pump was already warmed up, the chamber was open, or the workpiece load differed. Always retain units of pressure, whether absolute or gauge pressure, sampling interval, and time synchronization method in data tags.
Consolidating Five Types of Data into a Single Judgment
The first is process pressure. For each product, target values and exhaust curves are obtained, and three symptoms are distinguished: failure to reach the target, extended time to reach the target, and regression during the holding phase. The second is the pump’s thermal condition. Pump temperature and oil temperature are influenced by load, cooling, and ambient temperature. At the Thailand plant, recording ambient temperature during hot seasons and ventilation conditions in the machine room together makes it easier to interpret seasonal variations of the same pump. Edwards’ maintenance guidance recommends checking oil level, filters, and water cooling; rising temperature can have several causes. Decisions on parts replacement are not made based solely on temperature but are used as a basis for prioritizing inspections.
The third is electrical and mechanical condition. By examining current, power consumption, operating hours, start-up counts, and vibration levels simultaneously, it becomes easier to narrow down whether the load has changed or if the mechanical side has deteriorated. Vibration sensors are influenced by mounting rigidity, direction, rotational speed, measurement bandwidth, and the pump’s thermal environment. Numerical values obtained from a magnetically attached proof of concept (PoC) sensor should not be directly applied as thresholds for permanently mounted sensors fixed with screws. The fourth is auxiliary systems. Oil level, exhaust backpressure, cooling water flow rate, and filter differential pressure are acquired according to the system type. Signals listed in Busch’s remote monitoring products differ by pump model, and the configuration selects necessary signals such as oil temperature, inlet pressure, exhaust pressure, vibration, and cooling water flow rate.
The fifth is events. Without histories of workpiece loading, valve opening/closing, recipe changes, maintenance, filter replacement, leak repairs, and power outages/restorations, it is impossible to distinguish between good and bad waveforms. When passing sensor data to the MES, equipment ID, pump ID, chamber ID, product or lot ID, recipe, start/end times, results, responsible personnel, and maintenance events are linked by a common key. This prevents different departments from counting the same event under different names. Necessary items are selected according to the process, ensuring that personal information is not collected unnecessarily.
Three Comparisons to Diagnose Vacuum Deficiency
The first comparison is between the “current and baseline conditions of the same process.” Immediately after vacuum pump maintenance and verification of piping leaks, the pressure curve recorded during continuous operation of a representative recipe is saved as the baseline. After maintenance, the baseline is updated while retaining the old curves without deletion. The second comparison is between the “process side and the pump side.” If the vacuum pump inlet pressure is good but the chamber pressure is poor, the piping or valve side is suspected; if both are poor, the vacuum pump capacity and gas load are questioned. This is not a definitive diagnosis but serves as a guideline to determine the next isolation test. The third comparison is between “operation and shutdown.” Measuring the pressure rise after shutdown and valve closure provides an entry point to investigate system leaks and the influence of gas release. Pfeiffer’s technical explanation also describes the relationship between leak rate, pressure change, volume, and measurement time. Actual judgment is made considering the target volume and gas release.
Condition monitoring is not a substitute for safety protection. In processes where vacuum deficiency can cause workpiece drops or equipment damage, necessary interlocks should be implemented within the local control system to ensure protection even if remote dashboards or cloud connections are lost. Alarms should be designed to separate the roles of “caution, inspection, and stop” and avoid conflicts with existing alarms on the control panel. Defining authority for threshold adjustments and change history, nighttime contact points, and what the notified personnel should verify ensures alarms do not become mere emails.

Sensor and Connection Method Selection Table
| Selection Item | Points to Confirm | Evidence to Retain Upon Acceptance |
|---|---|---|
| Pressure Gauge | Required range, absolute pressure/gauge pressure, mounting port, resistance to contamination and condensation | Calibration records, simultaneous measurement comparison, list of units |
| Temperature | Measurement location, surface-mounted or built-in value, handling of ambient temperature | Installation photos, manufacturer recommended range, comparison under same conditions |
| Current/Power | Presence of inverter, number of phases, usability of existing meters | Wiring diagrams, power meter settings, records during stop and operation |
| Vibration | Mounting position, direction, fixing method, rotational speed, frequency band | Sensor position photos, reference waveform, procedures for reinstallation |
| Data Connection | PLC contacts, Modbus, OPC UA, availability of manufacturer-specific services | Tag list, communication interruption and recovery tests, ownership and output format |
| Alarm | Boundary with process stoppage, notification destination, confirmation responsibility | Simulated abnormality tests, history of read, re-notification, and cancellation |
For retrofitting existing equipment, first check built-in data provided by the OEM, then surplus I/O on the control panel, and finally independent external sensors in that order. Even if the manufacturer’s remote service is convenient, verify by contract the availability of raw data, retention period of history, exportable formats, and the factory’s authority for primary response. Examples such as Edwards’ GENIUS and Busch’s digital services allow confirmation of operating hours, temperature, pressure, energy, and maintenance alerts; however, applicability to specific models and scope of provision should be confirmed at the quotation stage. Do not assume the feature tables in product introductions guarantee all model types as-is.
8 Items to Include in the RFP
The first item is the target equipment and process. Specify the model, serial number, pump type, chamber volume, product group, operating shifts, and existing stop interlocks. The second item is the symptoms to be resolved. Instead of just “failure prediction,” describe observable issues such as “extended exhaust time for the representative recipe” or “unable to identify the cause of unplanned stops by the next day.” The third item is measurement points and accuracy. Create a table listing the ranges, cycles, units, calibration, and installation constraints for pressure, temperature, current, and vibration. The fourth item is the data model. Define associations with equipment, recipes, lots, timestamps, and maintenance events, as well as how missing data is displayed.
The fifth item is boundaries and security. Indicate signals sent from factory OT to external services, transmission directions, presence or absence of remote connections, accounts, logs, update responsibilities, and operation during communication outages. NIST SP 800-82 Rev.3 provides security measures considering OT performance, reliability, and safety requirements. Here, procurement principles are distilled as “do not change control to cloud dependency for monitoring” and “formalize connections.” The sixth item is notification operations. Specify who receives notifications within how many minutes, which inspection procedures are used on-site, and when escalation occurs. The seventh item is acceptance criteria. Enumerate normal, abnormal, communication outage, and sensor failure scenarios reproducible during FAT/SAT, along with evidence. The eighth item is maintenance and costs. Include estimates for sensor replacement, calibration, SIM/cloud, analysis, on-site visits, software updates, and data extraction upon vendor termination.
When the Thailand site collaborates with headquarters and local SI, implementation requirements include not limiting alarm messages and work standards to Japanese only. Local maintenance should be able to perform primary confirmation in Thai, and headquarters should review using the same equipment ID and graphs. Acceptance testing should verify whether local personnel can read sensor values during communication failures and whether safe isolation is possible before manufacturer maintenance personnel arrive. Cross-border data handling, internal connection reviews, and customer-specified network policies must be confirmed for each project.
The Meaning of “Same Symptom” Changes Depending on Pump Type
For oil-sealed rotary vane pumps, inspection candidates include oil contamination and quantity, gas ballast, filters, and exhaust paths. A dry screw pump can have an oil-free pumping chamber while its gearbox or bearings still use lubricant. For models such as the Edwards EXS, check oil level as specified by the OEM; also evaluate cooling, exhaust load, temperature, rotation, and process gas effects. In systems including Roots boosters, record startup conditions, inlet pressure, cooling, and motor status separately for the upstream pump and booster under different equipment IDs. The vacuum generation method’s operation manual takes top priority, and the examples in this article should not be uniformly applied to all models.
Design differs between cases where each molding or packaging machine has its own pump and where multiple processes share a central vacuum system. In central systems, a leak in one branch affects other processes, and average pump-side pressure alone does not reveal the problem location. Link pressure, valves, and process start times for each branch and check if the curve returns when isolating the target process. Conversely, individual pumps are relatively easy to associate with lots and recipes, but a large number of units increases maintenance costs for sensors, calibration, and network settings. Attaching system diagrams and monitoring priority to the RFP enables comparison of proposal prices.
Translating Candidate Causes into On-Site Procedures
If “exhaust time is long but pump inlet pressure is normal,” the first inspection targets are chamber seals, valves, branches, and filters. If “both process pressure and pump inlet pressure are poor, and current and temperature are high,” check load, cooling, exhaust side, and pump internals. If “pressure recovers only during hold,” suspect leakage in shut-off valves or seals, or gas release from the workpiece. If “vibration has increased but vacuum performance is maintained,” investigate mounting conditions, bearings, couplings, and vibration propagation from surrounding machinery. These are not definitive diagnostic results but the order of checks to perform on-site. Decisions on part replacement or shutdown follow manufacturer procedures and safety officer judgment.
When linking symptoms and responses, do not embed technicians’ heuristics only as screen notes; link to version-controlled inspection procedures. For example, “pressure drop → leak check” alone does not specify which valve to close, how long to hold, or which pressure gauge to read. Procedures must clearly state the target equipment, isolation scope, required protective equipment, work permits, measurement methods, normal examples, and restart approvers. The effectiveness of monitoring implementation depends on whether the same test can be reproduced even if night-shift maintenance personnel change.
Do Not Conclude FAT and SAT Simply Because an Alarm Was Triggered
During FAT, verify the units of input values, scaling, timestamps, tag names, and process IDs. Simulate pressure sensor disconnection, ammeter zeroing, communication interruptions, abnormal values, and recovery after power outages, and record whether the screen display, notifications, and history conform to specifications. If the supplier’s test environment cannot reproduce the actual load, move that item to SAT and do not consider it complete at FAT. Prioritize clarity in records over dashboard aesthetics—ensure that blanks in records are identifiable as blanks, retransmitted data do not duplicate, and there are no discrepancies in date and time.
During SAT, establish baselines by separating conditions such as representative recipes, normal load, low load, post-filter replacement, and continuous operation. Within safety limits, test simulated leaks, valve closure omissions, cooling reductions, etc., and verify not only pressure but also that inspection instructions reach the responsible personnel. Tests that intentionally induce dangerous abnormalities are unnecessary. Follow the safety officer’s and OEM’s conditions on-site for test methods, substituting with simulators or signal injections as needed. At minimum, record “who viewed which screen, inspected which equipment, and on what evidence the alarm was cleared.”
Acceptance or rejection cannot be decided solely by how many days in advance a failure was predicted. Since failure cases are few during commissioning, relying only on that metric makes evaluation impossible. Instead, base acceptance on measurement completeness, reproducibility under representative conditions, notification routes during abnormalities, narrowing down candidate causes, and behavior during communication interruptions. After operation begins, track monthly the number of stops due to vacuum shortage, primary diagnosis time, recurrence count, and scrap/rework cases. Record the sample size if process changes occur to avoid exaggerating effects through simple before-and-after comparisons.
Acceptance Test Values Are Determined by the On-Site Baseline
Pressure accuracy depends not only on instrument specifications but also on measurement location, piping volume, response speed, and data acquisition cycle. Therefore, a single line stating “pressure error within ○%” is insufficient. The acceptance plan should specify where the reference instrument for comparison is installed, the process state during simultaneous measurement, allowable tolerance, zero-point confirmation method, and scope of calibration certificates. Pump-down time is also measured by fixing the start and end pressures, valve states, and presence or absence of workpieces. Temperature rise and vibration baselines are taken under stable conditions after warm-up, recording ambient temperature and operating time.
Communication quality verification involves confirming not only that data arrives but also that missing data can be identified. Ensure that sensor disconnection, PLC stoppage, gateway reboot, and network disconnection do not cause the last valid value to be displayed as a new value. If the on-site terminal and headquarters screen use different time zones, clearly separate and indicate event save time and display time. Test retransmission order, duplicate elimination, and alarm reset conditions after communication is restored. These are not flashy analytical functions but essential quality features when investigating “whether vacuum shortage or pump stoppage occurred first” at a later date.

Separate Initial Investment and Operational Burden in Cost Estimation
In rough estimates, we separate costs not only for the sensor unit itself but also for installation work, vacuum piping modifications, power supply, communication, control panels, displays, analysis, calibration, testing, and training. Especially when adding measurement ports to vacuum piping, a design that does not increase leaks or contamination is essential. The difficulty of the work varies depending on the allowable pump downtime, cleanliness level, gas used, and warranty conditions. Adding additional measuring instruments is counterproductive if it lowers process reliability. Besides initial costs, we compare annual expenses such as sensor wear, calibration, communication fees, cloud contracts, data storage, maintenance visits, and the labor hours required for personnel verification.
For effect assessment, record the number and duration of vacuum-related stoppages in the past year, scrap and rework, emergency maintenance dispatches, spare unit switching, and inspection delays. Only reductions achieved after countermeasures are counted as effects; routine periodic maintenance is not considered a “reduction.” For example, if a single vacuum deficiency is detected early and only a piping leak is repaired, it may be possible to avoid emergency shutdowns and pump replacements. However, the cost and payback period for individual factories cannot be determined without data on shutdown unit costs, occurrence frequency, and equipment configuration. It is reasonable to observe one unit and one process in a PoC before deciding whether to horizontally deploy to similar machines.
The phased introduction is divided into three stages. In Stage 1, prepare asset registers, drawings, and stoppage histories, and select one process KPI. In Stage 2, acquire pressure and operation event data without changing onsite controls and create baseline curves after maintenance. In Stage 3, add only signals that improve diagnostics such as temperature, power, and vibration. Each time alarms increase, confirm that there are predefined actions to be taken upon receiving notifications. This approach separates increasing monitoring targets from increasing the workload on maintenance personnel.
Decision Table for Horizontal Deployment from PoC
At the start of the PoC, four judgments are made. The first is “Was measurement successful?” This means that pressure and operation events are collected for all required process cycles, and missing data or unit inconsistencies can be identified. The second is “Was the cause narrowed down?” Using simulated abnormalities and past cases, the responsible personnel can explain whether to inspect the pump side, piping side, or process conditions. The third is “Is it usable onsite?” Notifications in Thai, nighttime contact, reset after recovery, and history reference upon recurrence must all function properly. The fourth is “Is expansion possible?” Tags, screens, and inspection procedures can be reused for the same model, and differences for other models are clearly defined.
If the number of units is increased without meeting these criteria, the monitoring screen area and alarm count will grow, but the time for maintenance decision-making will not shorten. Before investing in sensors, some equipment can be improved simply by organizing leak inspection procedures and filter replacement histories. Conversely, for equipment where stoppage impact is large and continuous human monitoring is impossible, remote early detection of process pressure changes is highly valuable. The decision to introduce depends on the importance of the monitored target, failure frequency, and onsite response capability.
To prevent alarm fatigue, transient states immediately after startup and steady operation are separated. Because pressure and current temporarily fluctuate at startup, applying static thresholds without considering operation mode causes notifications every cycle. Set conditions for continuous abnormality duration, re-notification intervals for the same equipment, and criteria for acknowledging recovery, and record reasons for stopping notifications. During commissioning, measure not only the number of alarms but also the number of cases requiring actual response, false alarms, missed alarms, and the time personnel spent on verification. Even correct alarms are ineffective if the required actions are unclear and ignored. Weekly brief reviews reduce unnecessary notifications and align critical abnormalities with onsite protective circuits.
Additionally, mark the dates of instrument replacements or piping modifications on the display. Even if the tag name remains the same, changes in measurement location or calibration status alter the meaning of trend comparisons. When expanding horizontally, link drawing versions, sensor model numbers, software settings, and acceptance test results to each equipment ID.
Differentiation from Existing Articles and How to Consult at Thai Factories
Condition monitoring of vacuum pumps differs in measurement equipment and failure modes from the selection of vacuum ejectors used to grip workpieces, as discussed in Vacuum Ejector Selection. The vacuum ejector article focuses on the generator of adsorption transport and acceptance testing, whereas this article focuses on isolating the condition of central and process-specific vacuum pumps, piping, and chambers. The general Industrial Historian Implementation article serves as a reference when deciding the platform for storing and utilizing equipment data, while this article prioritizes determining which phenomena to measure at which points. By distinguishing the roles of existing articles, premature sensor purchases can be avoided.
Before placing an order, compiling a single document that includes equipment model lists, process flows, piping system diagrams, existing alarms, recent vacuum deficiency cases, connection rules, and maintenance contact chains will facilitate comparing vendor quotations. Even if all materials are not complete, if you understand “which product, at what point, and what kind of defect occurs,” you can discuss the initial measurement points. The key to implementation is to enable acceptance testing to be verified on-site so that both Thai and Japanese personnel share the same decision criteria.
Frequently Asked Questions
What sensor should be installed first when introducing vacuum pump condition monitoring?
If appropriate pressure measurement is not available on the process side, start by recording absolute pressure and pump-down time. If pressure data is already obtainable, link operating events, recipes, and maintenance history to identify what cannot be isolated. Rather than installing oil temperature or vibration sensors on all units on day one, it is more important to first obtain a baseline curve for one process. The pressure gauge range and installation method vary depending on the specifications of the pump and the process.
Can vacuum pump failure be predicted by vibration alone?
Vibration provides clues to abnormalities such as bearing or installation issues, but it cannot independently explain piping leaks, gas load changes, filter clogging, or process modifications. Combine trend data with fixed measurement positions, mounting methods, and operating conditions along with pressure, temperature, current, and maintenance history. As Pfeiffer explains, it is important not to use uniform threshold values that ignore the pump model for actual shutdown decisions.
Which is better: manufacturer remote monitoring service or in-house IoT?
Manufacturer services offer easier access to signals tailored to the pump model and maintenance support; however, it is necessary to confirm available data, supported models, communication methods, data export, and handling after contract termination. In-house IoT facilitates integration with factory-wide data, but calibration, diagnostics, and maintenance responsibilities for sensors fall on the company or system integrator. If needed, consider receiving OEM data while keeping local protective controls on site.
How do you estimate installation costs and payback period?
Separate initial costs for instrumentation, construction, connections, user interface, and testing from annual costs for calibration, communication, contracts, and maintenance. Benefits are counted only as reductions in vacuum-related stoppages, quality defects, and emergency maintenance after proof of concept, based on past records. Because target equipment and stoppage unit costs differ, it is more reliable to estimate using a representative single process rather than presenting general fixed prices or uniform payback periods.
Summary
The purpose of implementing vacuum pump condition monitoring is not to increase the number of pressure or vibration measurement points, but to quickly detect vacuum deficiencies in the process and safely isolate the pump, piping, chamber, and process conditions. Define the target process and KPIs, use the pressure curve as a baseline, and add necessary temperature, power, and vibration measurements. The RFP should clearly specify measurement points, data context, communication boundaries, actions upon alarms, FAT/SAT evidence, and maintenance costs. After confirming through a PoC that the site can narrow down the cause, expand the monitoring to other pumps.
If you are considering monitoring existing vacuum pumps at your Thailand factory or linking process pressure with MES and maintenance records, please consult TOMAS TECH starting from an equipment list and examples of problematic stoppages or quality issues. You can begin by organizing measurement points and acceptance criteria focused on a single process.
Reference Information
- Busch Vacuum, “7 Things to Check When Troubleshooting a Vacuum System” (2026-09-14)
- Busch Vacuum, Digital Services / OTTO
- Edwards Vacuum, GENIUS Remote Connectivity and Monitoring
- Pfeiffer Vacuum, Roots pump operating instructions (sensor position and baseline)
- Pfeiffer Vacuum, Influences in Vacuum Systems
- Edwards Vacuum, Vacuum Pump Do-It-Yourself Maintenance
- Edwards Vacuum, EXS Dry Screw Vacuum Pump Instructions §7.5.1
- NIST, SP 800-82 Rev. 3, Guide to Operational Technology Security


