


Installing a differential pressure transmitter on a dust collector does not, by itself, tell maintenance when to replace its bag or cartridge filters. A usable system connects pressure drop across the filters to actual airflow, fan operation, pulse cleaning, hopper discharge and maintenance events. This guide turns that requirement into a practical specification for an existing collector in a Thai factory, including sensor taps, alarm logic, RFP deliverables and FAT/SAT acceptance. The subject is filter pressure drop inside a dust collector, not room-to-room pressure control or cleanroom environmental monitoring.
Begin with the decisions the monitoring system must support
Differential pressure is the difference between static pressure on the dirty-air and clean-air sides of the collector. Dust captured by the bags or cartridges changes flow resistance; pulse-jet cleaning removes some of the dust cake and changes the pressure trend again. Air volume, dust loading, media, moisture and cleaning settings also influence the reading. A high number does not automatically mean “replace filter,” and a low number does not automatically mean “healthy filter.” The US EPA monitoring guidance treats pressure drop as a useful performance indicator while cautioning that it does not by itself prove compliance with emission limits.
Set three decisions before requesting quotations. First, can operators identify rising resistance that no longer recovers after cleaning? Second, can they investigate a sudden fall or clean-side problem without overlooking a torn filter, failed seal or disconnected measuring tube? Third, does the system maintain the extraction airflow needed at the process hood while controlling unnecessary compressed air and fan energy? These decisions lead to different measurements and actions. A display with a pressure number alone answers none of them reliably.
Separate a live value from a decision-ready record
A daily gauge reading is a starting point, but it mixes production modes, shifts and readings before and after a cleaning pulse. Put a timestamp, collector ID, run/stop state, filter pressure drop, fan state, pulse event and maintenance event on one timeline. Add measured airflow where practical, or a validated proxy where direct flow measurement is not feasible. Where the fan uses a variable-frequency drive, compare data at comparable speeds or airflow bands. A Camfil operating example monitors pressure drop together with airflow, pulses, compressed air, fan data and hopper levels.
Draw the equipment boundary
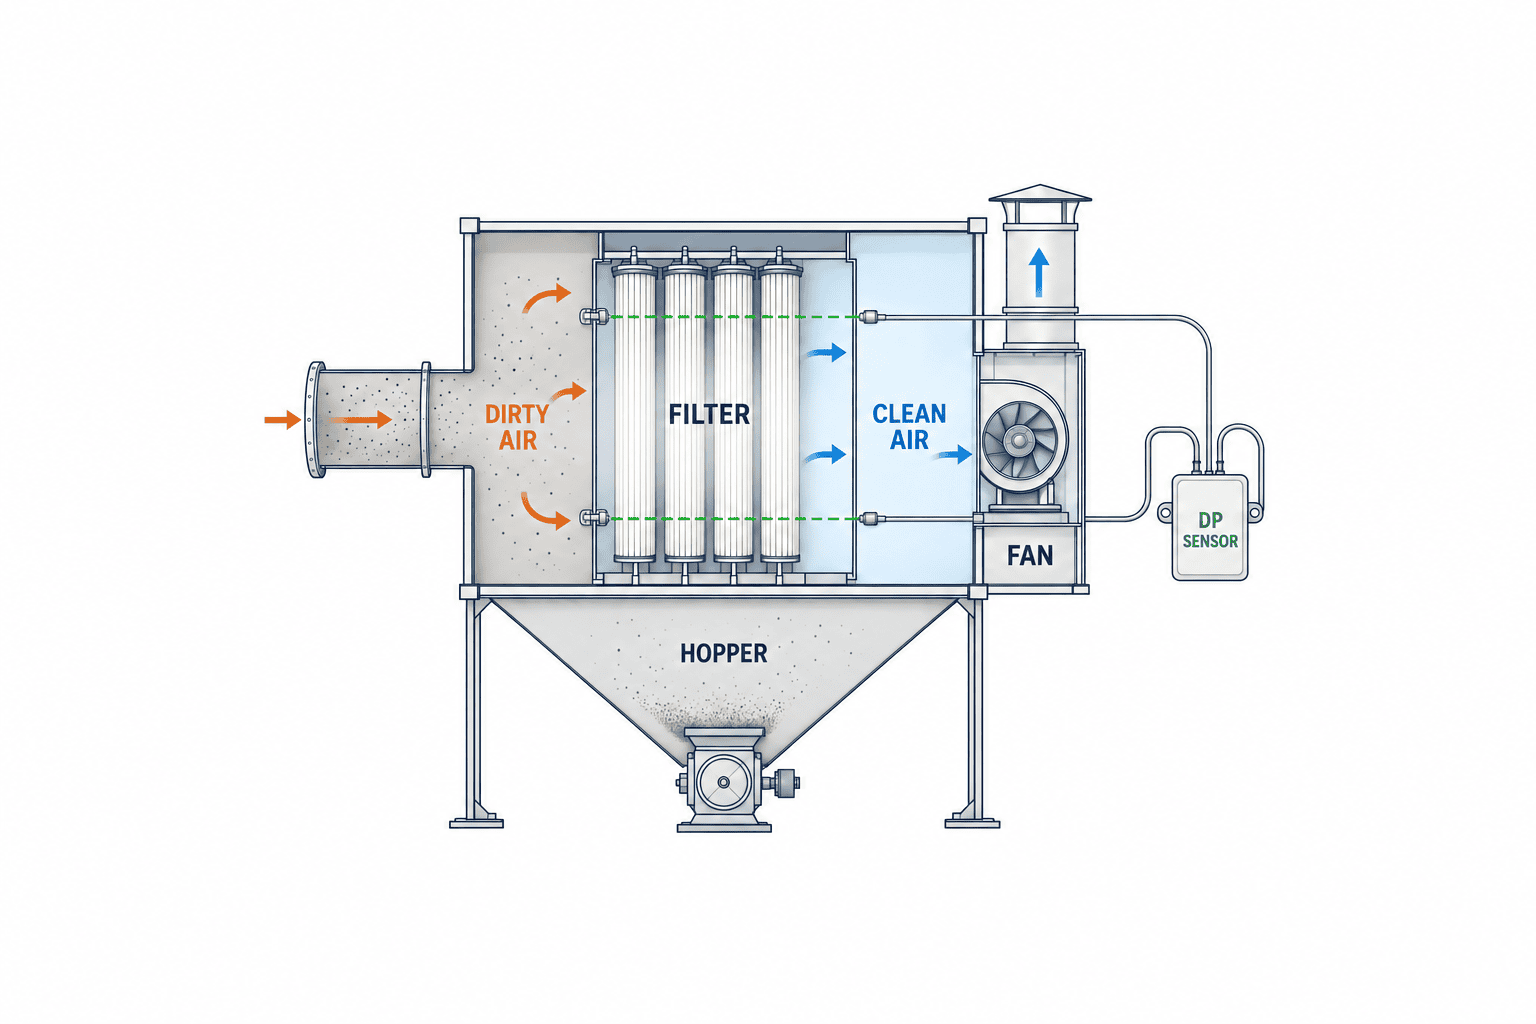
Map the hood, duct, dirty-air chamber, bag or cartridge bank, clean-air chamber, fan, exhaust and hopper. Connect the two pressure taps across the collector filter, one on each side. The hopper removes collected dust; the pulse system dislodges dust from the media. A cleanroom pressure monitor instead measures a pressure relationship between rooms for a different control purpose. Its thresholds must not be copied into this application.
Why pressure drop alone cannot set filter replacement dates
Adding an extraction point can raise airflow and pressure drop even with the same filter. Slowing a VFD fan can lower both, even if extraction at a hood has become inadequate. A low value could be a leak or damaged element, but it could also be loss of airflow or a measurement fault. Donaldson’s explanation defines differential pressure between dirty and clean plenums and notes that it includes several resistances, not only the dust cake.
Establish a site baseline rather than copying a threshold
During commissioning, record a clean or newly serviced filter at representative dust loads and production modes. For fixed-speed fans, establish a baseline by operating mode. For VFD fans, use speed or airflow bands. Save the high pressure immediately before a pulse, the low pressure immediately afterward, pulse frequency, the rate of increase between pulses and behavior after shutdown and restart. A gradually rising post-cleaning low point can reveal a loss of recoverability that a daily average hides. The EPA fabric-filter operation manual emphasizes comparison with a baseline and observation of the upper and lower parts of the cleaning cycle.
Treat a pressure number in a manufacturer’s manual as specific to that machine and configuration. Media area, dust properties, fan curve and duct resistance differ. Review the collector manufacturer’s limits and design airflow, then approve site-specific normal bands, warning points and any stop conditions. A Donaldson DFPRE manual describes pressure-connection checks and maintenance limits for that model; it is not a universal setting for other collectors.
Keep several fault hypotheses open
Persistent high pressure drop can reflect heavier dust load, blinded media, wet or oily material, a failed pulse valve, inadequate compressed air, a full hopper, increased flow or a blocked pressure tap. A low reading can reflect a torn element, failed seal, fan shutdown, low speed, duct leakage, a loose measuring line or sensor failure. The alarm should state what was observed, not declare a root cause. In the work instruction, set a safe inspection order for airflow, fan, compressed air, pulse valves, hopper, taps, filter elements and clean-side dust. Record the confirmed cause after inspection.
Design the sensor taps and impulse lines for maintenance
On a retrofit, the pressure takeoff points and tubing are often harder than selecting the transmitter. Dust can plug the dirty-side tap; condensation, leakage or a reversed connection can distort either line. The EPA recordkeeping guidance explicitly identifies tap blockage and pressure-line leakage as limitations of pressure-drop measurement.
Survey the flow direction, collector drawings, existing gauge connections, manufacturer-approved ports, access doors and maintenance space. Avoid positions subject to local jets or deposits, following the equipment manufacturer’s instructions. Route tubing where technicians can inspect and replace it; assess dust pockets, condensate, vibration, heat and cleaning damage. Show the high/low connection, tube run, fittings, isolation and zero-check method on the installation drawing. If the dust may be combustible, involve the collector manufacturer and site safety team before drilling or adding electrical devices, and preserve the existing explosion-protection, bonding and isolation design.
Specify measurement range with expected pressure and startup/cleaning transients in mind. The selection sheet should also state accuracy, zero drift, overpressure tolerance, response time, wetted materials, enclosure rating, temperature, calibration and output. For 4–20 mA inputs to a PLC, treat wire break, out-of-range and bad PLC input as separate quality states. If an edge gateway is used because the PLC has no spare inputs, keep safety-related trips and interlocks in the approved local controls, not in a cloud connection.
At SAT, check zero, simulated pressure and live operating readings. Verify that the two taps truly straddle the filter, the polarity and engineering units are correct, and the PLC/display values match a portable reference instrument within the agreed tolerance. Simulate a disconnected sensor and communication loss: the display must mark the value invalid with a timestamp rather than present a stale number as current.
Combine airflow, fan, pulse and hopper signals
Air volume gives pressure drop its operating context. Where possible, measure at a suitable duct section and validate extraction at the source hood. If a permanent flow meter is not practical, collect fan speed, motor current, damper position, static pressure and operating mode, then verify how the proxy relates to airflow during commissioning. Motor current alone is not an exact airflow meter. Duct changes and dust properties change the relationship.
Compare before and after each cleaning pulse
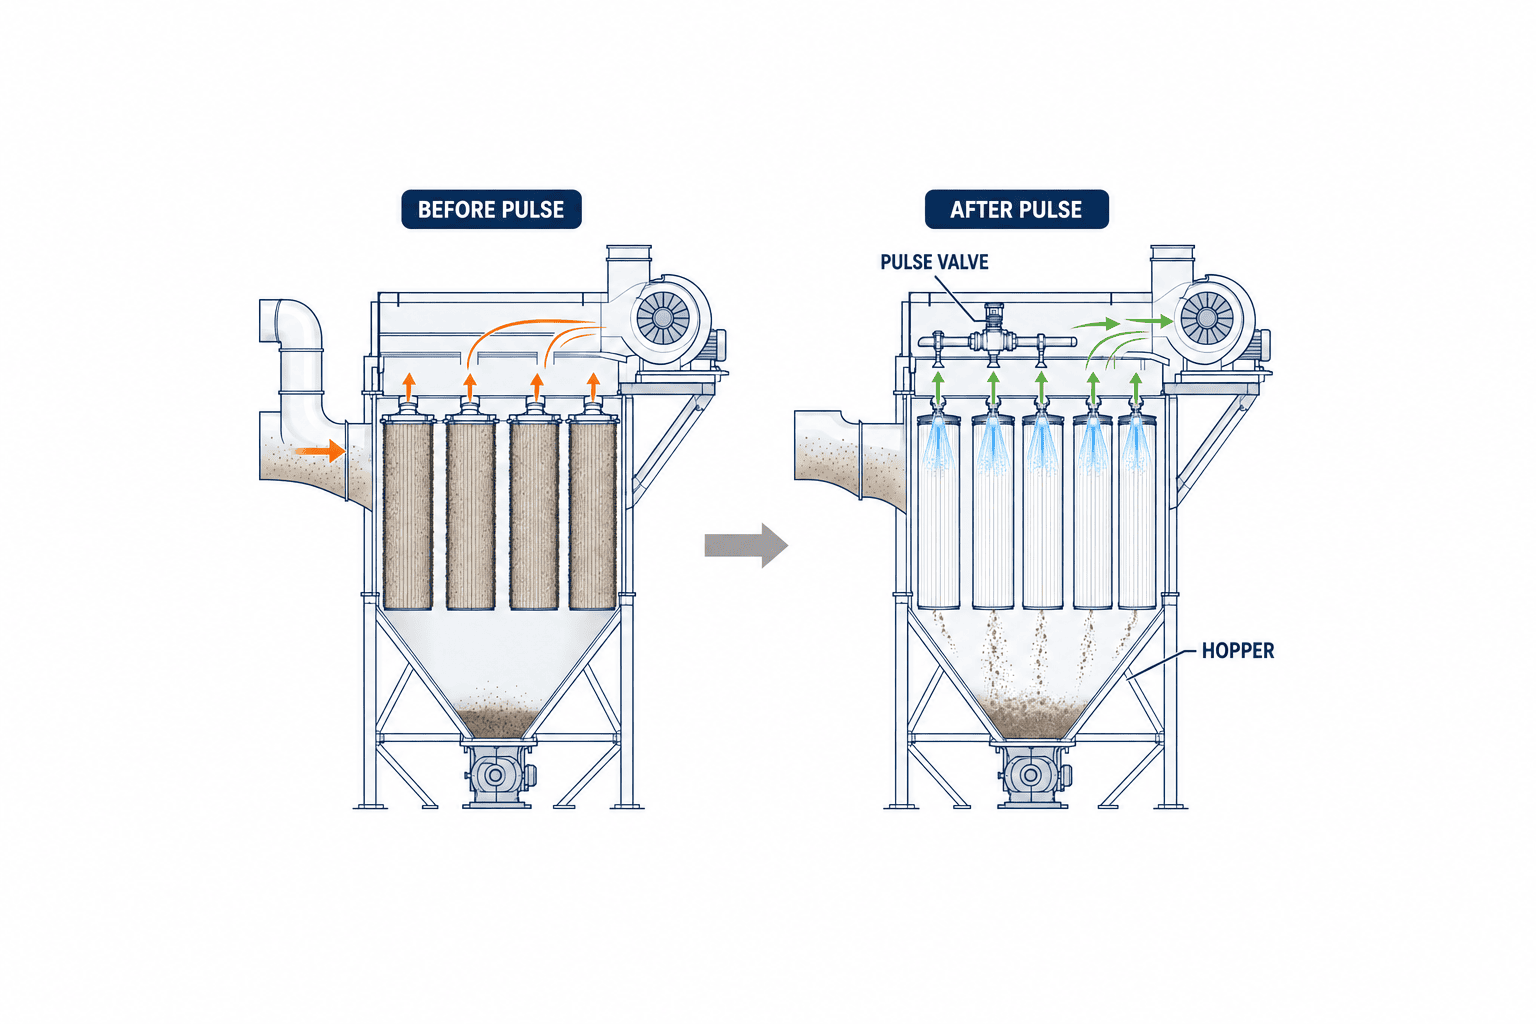
In a pulse-jet collector, brief compressed-air pulses dislodge dust. On-demand control starts and stops cleaning at separate pressure points. Compare the pressure reduction after a pulse and the interval until the next pulse, preferably at comparable airflow. Camfil’s pulse-cleaning guidance describes differential-pressure-based on-demand cleaning. If pulse frequency rises but the post-pulse baseline does not improve, inspect media blinding, valves, compressed air and dust discharge. More frequent pulsing is not always a remedy.
Include dust discharge
Dust released from the filter still has to leave the hopper. A stopped rotary valve or screw, a full container or a bridged hopper can undermine collection and diagnosis. Capture the installed discharge device’s run and fault signals. If no level sensor exists, time-stamp container changes and blockage clearing as maintenance events. A pressure-rise episode coinciding with a discharge fault can then lead to the right inspection before premature filter replacement. Camfil’s monitoring example includes hopper and waste level among the observed points.
Specify alarms as conditions plus actions
An RFP that only says “email when pressure is high” will generate noise during shutdown, startup, cleaning and low-speed VFD operation. Each rule needs an operating condition, persistence period, clear condition, first check, owner and escalation. Set numerical values from the site baseline and manufacturer limits, not from a generic article.
| Observed event | Condition to test | First action |
|---|---|---|
| Sustained high drop | Above the approved band at comparable airflow; check post-pulse value | Verify extraction, air supply, pulse valves, hopper and pressure taps |
| Poor cleaning recovery | Post-pulse low point rises over repeated comparable cycles | Inspect media and cleaning hardware |
| Abnormally low drop | Below the approved band while fan and airflow are present | Check media, seals, bypass, tubes and clean-side dust |
| Rising pulse frequency | Intervals shorten at similar product and airflow | Check dust load, moisture, compressed air and discharge |
| Bad measurement quality | Broken wire, fixed reading, reversed polarity or overdue calibration | Mark data invalid and compare with a local instrument |
Do not compare unlike modes against one limit. Use airflow-specific bands or explicitly limit the monitored operating envelope. Apply startup delay and noise filtering, then test the delay so a real problem is not hidden. Log acknowledgement, inspection, correction and return to service; a shift change must not silently clear an unresolved alarm.
Dust collection can have combustible-dust, ventilation and worker-exposure implications. Before allowing an IoT application to stop the fan or process, review existing safety circuits, the site risk assessment and manufacturer instructions. Whether a process may run without the collector and how fire or explosion isolation operates are site-specific control questions. Start monitoring as a read-only layer for evidence and maintenance; treat any new automatic trip as a separate engineered control change with its own test.
Data architecture and procurement cost
A PLC analog input is suitable when spare I/O exists and collector states are already available. A separate logger or edge gateway can work where PLC changes are constrained. If the controller already exposes pressure and pulse data, ask the manufacturer for a supported read interface. Draw the ownership boundary and confirm that a monitoring failure will not alter the collector’s existing approved control behavior.
The tag list should include collector and line ID, synchronized time, pressure value/unit/quality, run state, fan speed or current, airflow or validated proxy, pulse command and feedback, compressed-air pressure, hopper/discharge state, production mode, alarms and maintenance events. Mark unmeasured items explicitly. Select collection periods that preserve the pressure change before and after pulses. High-rate samples can be retained around events and routine periods summarized, but do not average away cleaning-cycle evidence. Mark calibration, filter changes and gaps so users do not treat different conditions as one continuous trend. See our PLC data collection guide and factory IoT implementation guide for interface and storage design.
An alert should open a maintenance workflow. Record technician, time, pressure and airflow checked, pulse and hopper findings, parts replaced, confirmed cause and recurrence. A CMMS can hold the ticket; a consistent form is enough for a pilot. Without labeled maintenance outcomes, a promised filter-life prediction model has little reliable learning material. Our predictive-maintenance implementation guide explains this operational link.
Break the budget into five lines: (1) site survey, drawings and safety review; (2) pressure taps, tubing, transmitter, wiring and panel work; (3) PLC/edge connection and time synchronization; (4) alarms, dashboard and maintenance records; and (5) FAT/SAT, training, calibration and support. For multiple collectors, separate shared software cost from per-machine installation and show the marginal expansion price. Costs vary with existing ports, shutdown access, I/O, network and the scope of shared screens. Do not paste a case-study saving into a local ROI model. Measure your own baseline airflow, cleaning frequency, fan power, compressed-air use, downtime and maintenance effort first.
What the RFP should require
Provide the equipment list, dust types, filter design, drawings, control architecture, design airflow, operating modes and manufacturer constraints. Ask bidders for:
- A drawing of dirty/clean pressure tap locations, tube routes, cleaning access and calibration procedure.
- Sensor range, accuracy, environment, fault detection, panel/interface and time-sync specifications.
- A mode-aware baseline method, alarm state table, invalid-data behavior, notification and escalation rules.
- Availability of fan, pulse, compressed-air and hopper signals and a diagnostic fallback where a point is absent.
- OT access rights, change log, backup/recovery, retention and service responsibilities.
- FAT/SAT protocols, calibration evidence, training, spare parts and response time.
Score proposals on maintainable tapping, fault discrimination and reproducible acceptance tests, not dashboard appearance. If a bidder proposes AI-based replacement prediction, ask for its training data, explanation and validation method. When historical failure labels are sparse, rules based on post-cleaning baseline, airflow and pulse frequency are easier to verify.
Four situations that often produce a wrong diagnosis
The first is a product changeover. Particle size, adhesion and dust generation change the rise of pressure drop and the time between pulses, even with the same filter. Without a timestamped changeover, a comparison with last month can confuse process conditions with filter aging. A full product-code integration is not necessary for a pilot: a small number of dust-condition groups recorded in the shift log can provide enough context for comparisons.
The second is immediately after filter replacement. A new medium may behave differently until a dust cake forms. Record replacement date, media type and batch, number of elements, gaskets and the post-work inspection. Do not blindly apply the old filter’s baseline to the new one. Follow the manufacturer’s startup procedure, verify stabilized airflow and establish a new reference. If the fan setpoint also changed, record it so an apparent improvement is not attributed entirely to the filter.
The third is a pressure reading that never moves. This can look like stable operation while a tap is plugged, a tube has come loose, an output is fixed or the PLC is holding the last value. If the fan stops/restarts or pulses occur without any plausible pressure response, treat it as a potential measurement-quality fault. Align the time of a portable-gauge measurement with the system history and locate where the value stopped changing: instrument, input, network or display.
The fourth is a shared duct or production line. Adjusting one damper can affect another collector’s airflow and pressure. Draw common ducts, branches, standby-unit changeover and operating combinations on the system diagram. Match the collector ID across the screen, control panel nameplate, field label and maintenance register so a technician reaches the correct machine. Correct outdated drawings with a field walk before SAT.
Divide routine responsibilities
Each shift, operators can review major alarms, suction condition, hopper discharge and visible dust escape, then hand findings to maintenance. Weekly, maintenance can review pressure trends, post-cleaning lows, pulse frequency, compressed air, fan data and unresolved tickets. After replacement or tap cleaning, record before/after pressure and airflow, work performed, parts and restart check in one record. These frequencies are an operating example; hazard assessment and manufacturer instructions take priority. Separate viewing, alarm approval and threshold-change permissions, and log why and when a setting changes.
Define a 90-day pilot exit before starting
Use the first month to establish measurement reliability, the next to exercise decisions and field response, and the final month to check reproducibility and rollout readiness. Example exit conditions: missing sensor data can be diagnosed; representative operating modes have airflow and pressure baselines; simulated high/low alarms lead the responsible person to a work order; and pulse or hopper faults can be distinguished from filter faults. If a real failure does not occur within 90 days, do not claim a measured fault-detection rate. Report simulated-test evidence and the quality of normal operating data. Remove or redesign screens and notifications that maintainers do not use before expanding to every machine.
FAT and SAT: prove the monitoring works on the machine
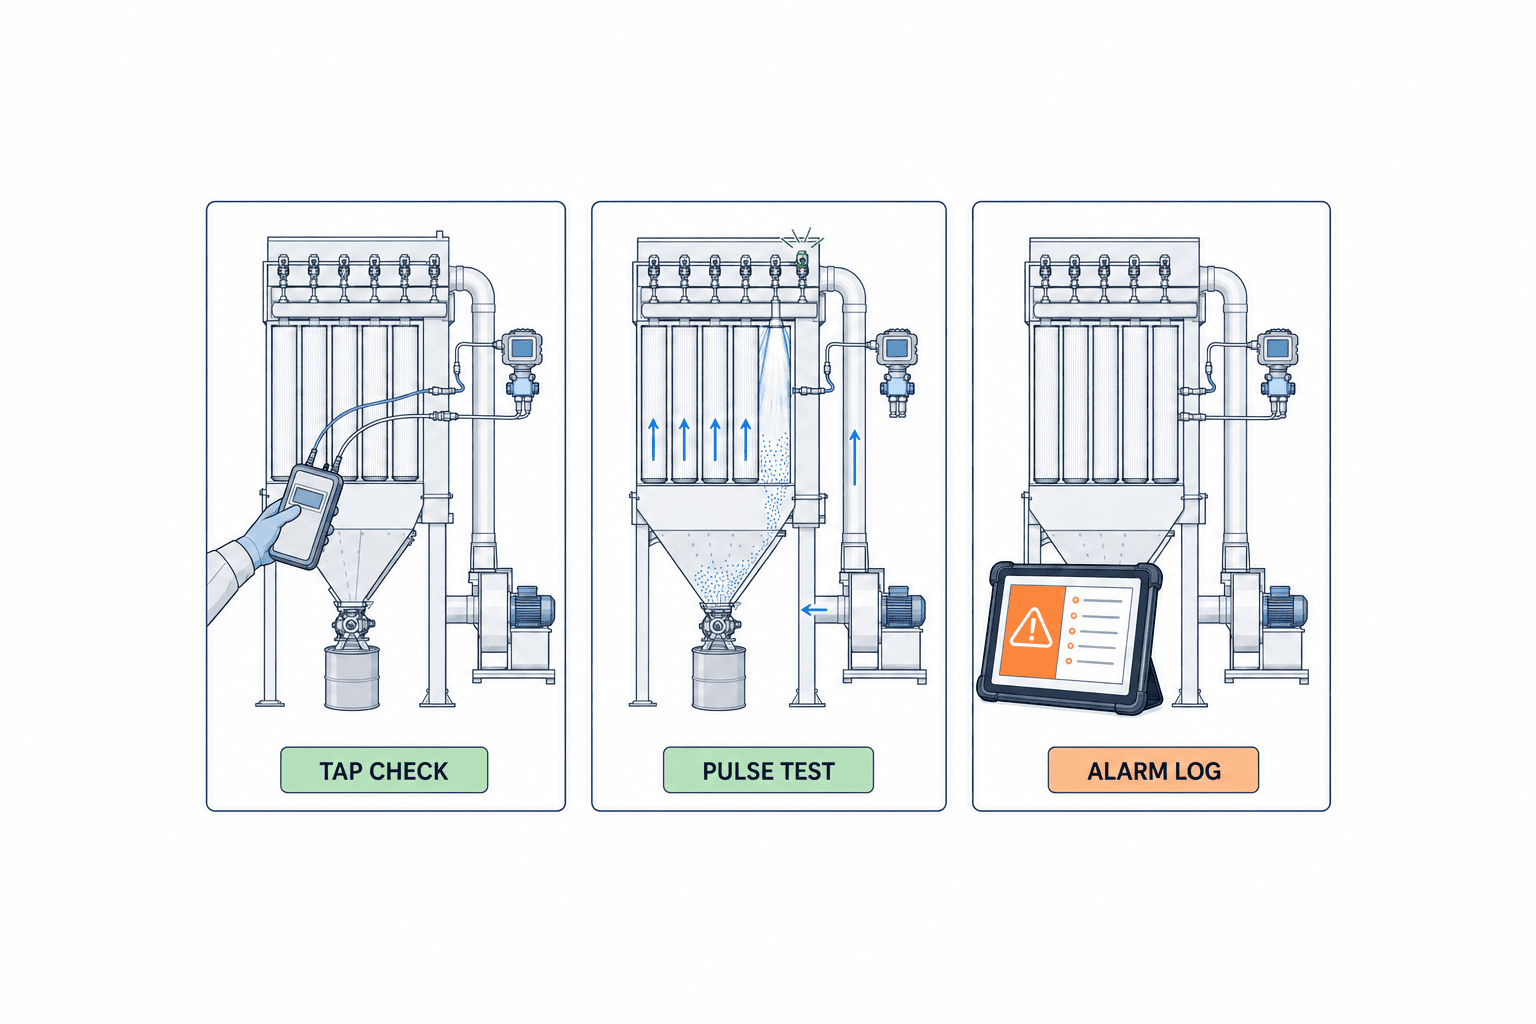
In FAT, simulate zero, normal, high, low, open circuit, out-of-range, stopped collector, pulse feedback and lost communication. Check engineering units, sign, timezone, time synchronization, display quality, notification delay, history and recovery. Verify that acknowledging an alert does not erase an unresolved maintenance task and unauthorized users cannot change alarm limits.
In SAT, confirm actual tap positions and tube connections, compare with a portable instrument, capture baselines by operating mode, observe pulse-cycle response and check fan stop/restart and hopper-discharge records. If intentionally stopping a pulse valve is unsafe or impractical, use a safe simulated input or a scheduled maintenance opportunity, and mark the untested case. Separately measure whether extraction at the source meets its requirement. A functioning pressure dashboard does not prove adequate capture airflow.
Acceptance criteria need evidence: an approved baseline for each mode; invalid display on broken-sensor test; timestamped pre/post-pulse behavior; delivered high/low alarms; and a maintenance record linked back to source data. Define tolerance, delivery time, permitted gaps and retention before testing. Use the installed collector, not only the vendor’s demonstration system. Pilot one representative unit with drawings and maintenance history, close the inspection-and-adjustment loop, then repeat on a unit with a different dust, medium or fan mode before copying configuration across the plant. Our factory IoT PoC guide covers exit criteria for a staged trial.
Frequently asked questions
Can dust collector differential pressure alone tell me when to change a filter?
It is a strong indicator, not a conclusive date. Compare pressure at similar airflow, the post-cleaning low point, pulse behavior and confirmed inspections. Follow the collector manufacturer’s maintenance limits. Both unusually high and low pressure drop can merit investigation, as described in the EPA guidance.
Can a sensor be retrofitted to an existing collector?
Often yes, after checking approved tap locations, collector structure, dust properties, electrical and explosion-protection requirements, and shutdown access. Include cleanable taps and calibration access in the retrofit scope.
Does a sudden low value mean the filter is torn?
It is one possibility. Check whether fan and airflow are present, then examine seals, clean-side dust, tubing and the transmitter according to site procedures. Word the alarm as an observed low pressure drop until inspection confirms a cause.
What pressure alarm threshold should I use?
There is no universal Pa value. Set site-specific bands using the collector/filter manufacturer’s instructions, design airflow, dust loading, pulse settings and baseline data. Approve persistence time and response actions together with the threshold.
Will more frequent pulse cleaning always lower pressure drop?
No. Failed valves, low or contaminated compressed air, blinded media, wet dust or blocked discharge can defeat additional pulses. Compare the pressure recovery, air use and hopper condition before changing the cleaning program.
Summary
Useful dust collector differential-pressure monitoring is an operating system for decisions, not a transmitter purchase. Install maintainable taps across the filter, record pressure with airflow, fan, pulse and hopper context, and define machine-specific baselines and response actions. Put field installation, fault diagnosis, maintenance history and FAT/SAT evidence into the RFP.
Even if drawings for an existing collector are incomplete, you can contact TOMAS TECH while evaluating the first machine. We can help frame the measurement points, PLC interface, alarm rules and site acceptance test before a plant-wide rollout.
Sources
- US EPA, Chapter 4 Section 2: Monitors
- US EPA, Operation and Maintenance Manual for Fabric Filters
- US EPA, Recommended Recordkeeping Systems for Air Pollution Control Equipment
- Donaldson, What Is Differential Pressure?
- Donaldson, DFPRE IOM
- Camfil, Monitoring Dust Collector Performance Data
- Camfil, Pulse Cleaning Controls


