


“What temperature did this board actually see when it went through the reflow oven?” When a customer audit or an escaped-defect investigation raises that question, many plants have nothing more to show than the results of a few thermocouple runs and a screen showing the oven setpoints. We often hear this concern about reflow profile management from board assembly plants in Thailand. The more product changeovers a line has, the more often it has to be measured, and the line stops needed for measurement become a burden as well.
This article makes one argument. Reflow profile management should be designed not around “how often you measure,” but around “whether you can later prove which board went through which conditions.” In concrete terms, that comes down to six points.
- Oven setpoints (zone temperatures and conveyor speed) are not the actual temperature of the board. Both the setpoints and the measured profile need to be recorded.
- Whether a profile passes or fails is determined from two sides: the recommended range of the solder paste and the heat-resistance limits of the components. This “process window” is documented for each combination of paste, components and board, and expressed as a single number using an index such as PWI.
- Thermocouple profilers are not going away. Continuous monitoring is a mechanism that builds on the baseline created with thermocouples and watches every board that flows between one measurement and the next.
- The value of continuous monitoring lies in shortening the delay before a deviation is noticed, and in board-level records.
- The records are connected to MES and traceability. The board serial (board ID) is linked with the profile judgment result, the oven settings and the N2/O2 status. IPC-HERMES-9852 between machines and IPC-CFX to higher-level systems are the options.
- On that basis, the RFP states “what is stored, at what unit, for how long, and how the line is stopped when a deviation occurs,” and acceptance testing (FAT/SAT) tests the comparison against thermocouple measurements and the stop behavior on deviation.
Please note that this article is not a product recommendation or ranking. All product capabilities described here are “vendor claims” based on each vendor’s published materials. The calculation in the second half uses hypothetical numbers for illustration and is not data from an actual plant.
What Is a Reflow Profile? Preheat, Soak, Reflow, Cooling, TAL and Peak
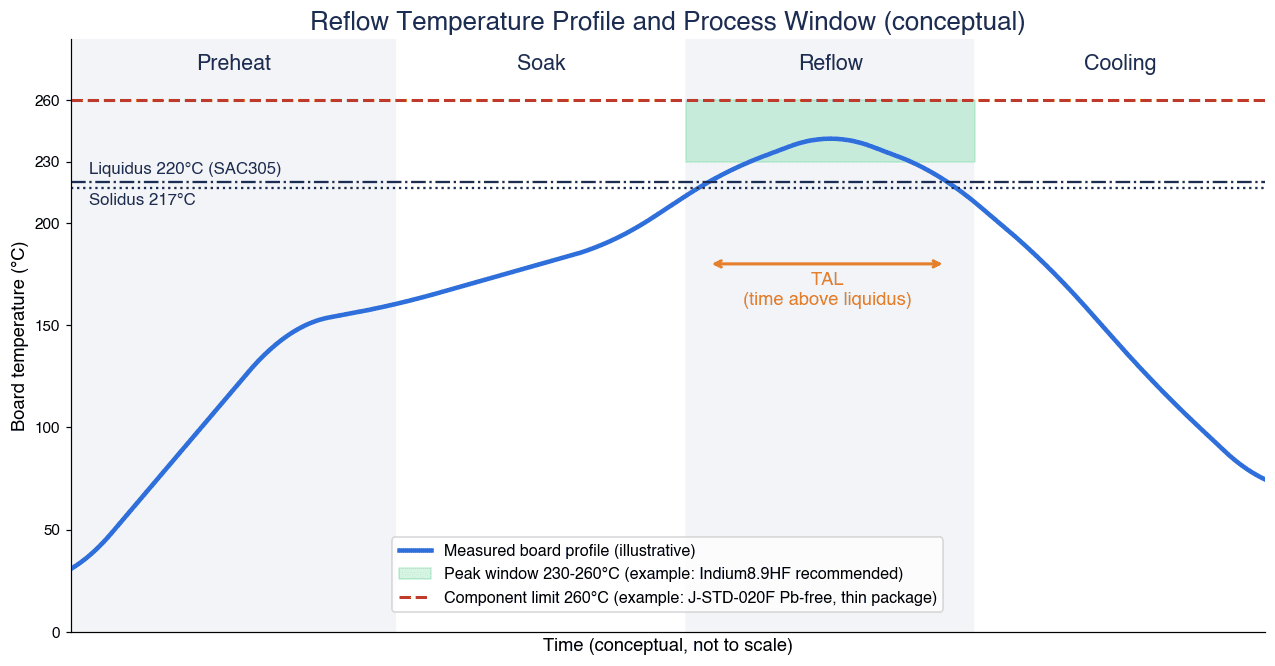
A reflow temperature profile is the change in temperature over time (a temperature-time curve) experienced by measurement points on a board as it passes through a reflow oven. Thermocouples are attached to representative components, and the temperatures are recorded by sending the board through the oven together with a measuring instrument. It is generally considered that each assembled board has its own characteristic curve.
In the table of contents of IPC-7530B “Guidelines for Temperature Profiling for Mass Soldering Processes (Reflow and Wave)” (January 2025 edition, Rev. B), IPC’s profiling guideline, the chapter on convection reflow profiling lists four zones: Preheat, Soak, Reflow and Cooling. The defined terms include Liquidus, Solidus, Peak, Ramp Rate and Time Above Liquidus (TAL). The body of this standard is paid content, and this article covers only what could be confirmed from the table of contents.
The roles of the four zones can be roughly summarized as follows.
| Zone | Main role | Example values to monitor |
|---|---|---|
| Preheat | Gradually heats the board and components from room temperature | Ramp rate (°C/s) |
| Soak | Reduces temperature differences across the board and activates the flux | Soak temperature and time |
| Reflow | Melts the solder and forms the joints | Peak temperature, TAL |
| Cooling | Solidifies the solder and forms its microstructure | Cooling rate (°C/s) |
Is the Liquidus 217°C or 220°C?
SAC305 (Sn-3.0Ag-0.5Cu), widely used as a lead-free solder, has a solidus of 217°C and a liquidus of 220°C according to AIM’s technical data sheet. In Senju Metal Industry’s 2025 soldering materials catalogue, M705 (Sn-3.0Ag-0.5Cu) likewise has a solidus of 217°C and a liquidus of 220°C. In other words, SAC305 is an alloy that passes through a “partly molten” state between 217°C and 220°C.
On the other hand, some component manufacturers’ documents use 217°C as the reference temperature for TAL. Nexperia’s “Reflow soldering profile” (Rev. 1.2, February 10, 2026) sets the liquidus temperature TL for lead-free processes at 217°C and defines time above liquidus on that basis.
For this reason, the reference temperature used to measure TAL differs from document to document (217°C is the more common choice). Rather than treating either one as the only correct answer, what matters is to state explicitly in your own process window document that “TAL is measured against X°C.” A 3°C difference in the reference temperature changes the number of seconds of TAL for the very same curve, and that can change the pass/fail result.
“Typical” Guidelines for Peak and TAL
Indium Corporation’s technical paper “Best Practices Reflow Profiling for Lead-Free SMT Assembly” (2016, republished on the KIC website) states that “TAL is typically 30-90 seconds in order to form effective intermetallics,” that “the peak temperature is generally 20-30°C above the liquidus temperature of the alloy,” and that “a cooling rate of ~4°C/second is normal.” All of these are phrased with “typically” or “generally,” and the paper is also 10 years old. In actual production, the ranges are set from the data for the paste and components in use, as described in the next section.
Defining the Process Window: Paste Recommendations and Component Heat Limits
To judge whether a profile passes or fails, you need a range that defines what counts as good, in other words a process window. It is easier to organize this if you think of the window as determined mainly by the recommended range of the solder paste, with the upper limit narrowed further by the heat-resistance limits of the components.
Paste Side: The Indium8.9HF Data Sheet as an Example
As an example, here is the recommended profile for SAC305 from the product data sheet for Indium8.9HF (T5/T6 powder) (Form No. 99211 R6, ©2026). These are the recommended values for this particular paste product; other companies’ pastes and other products have different values.
| Parameter | Recommended | Acceptable | Notes in the data sheet |
|---|---|---|---|
| Ramp (average, ambient to peak) | 1.0–1.5°C/s | 0.5–2.5°C/s | Reduces solder balling, beading and hot slump |
| Soak (optional) time | 20–60 s | 30–120 s | May reduce voiding in BGA/CSP |
| Soak temperature | 140–160°C | 140–170°C | – |
| TAL (time above liquidus) | 45–60 s | 30–100 s | Value measured with thermocouples |
| Peak temperature | 230–260°C | 230–262°C | – |
| Cooling rate | 2–6°C/s | 0.5–6°C/s | Rapid cooling forms a fine microstructure |
| Atmosphere | N2 (recommended for small components under 180µm) | – | – |
The data sheet states clearly that these are general guidelines, and that going outside these ranges because of process requirements such as board size, thickness and component density is acceptable and may even be necessary. It carries the caveat: “All parameters are for reference only. Modifications may be required to fit process and design.”
Component Side: J-STD-020F Classification Temperatures
A reference point for the heat-resistance limits of components is the classification temperature (Tc) in IPC/JEDEC J-STD-020F (Moisture/Reflow Sensitivity Classification for Non-hermetic Surface Mount Devices). Nexperia’s document (February 2026) explains that J-STD-020F defines classification temperatures for components, that the peak temperature qualified by the component supplier is at or above Tc, and that users are recommended to keep the peak below Tc. Because smaller and thinner packages tend to reach higher body temperatures, Tc is determined by package thickness and volume.
The classification temperatures for lead-free (SAC alloy) processes in the table of that document are as follows.
| Package thickness | Volume under 350mm³ | 350–2,000mm³ | Over 2,000mm³ |
|---|---|---|---|
| Under 1.6mm | 260°C | 260°C | 260°C |
| 1.6–2.5mm | 260°C | 250°C | 245°C |
| Over 2.5mm | 250°C | 245°C | 245°C |
Note that the thicker and larger the component, the lower its Tc. When thick, large packages are mixed onto a board, the component-side constraint can take effect before the recommended peak upper limit in the paste data sheet (260°C in the example above). Conversely, areas with large components have a high heat capacity and reach lower peak temperatures, so peak and TAL tend to sit toward the lower end of the window. For its own components (thickness 2.5mm or less and volume under 350mm³), Nexperia gives recommendations such as a maximum cooling rate of 6°C/s and a maximum of 8 minutes from 25°C to peak, and cites 245°C as a typical peak. Nexperia notes that this 245°C reflects typical settings and not the maximum values.
Documenting the Window per “Combination”
In practice, the window is defined and documented for each combination of the following three elements.
- Paste: product name, powder size, data sheet revision
- Components: the component on the board with the lowest heat-resistance limit, and the component that heats up most slowly
- Board: thickness, layer count, amount of copper, component density, panelization
Even among pastes in the same SAC305 family, the recommended range in the data sheet changes when the product changes. Adding components or switching to alternate parts can also change Tc. Putting revision control on the window document, and keeping records in a form that shows “which revision of the window was used for the judgment,” makes it easier to explain things in later audits. Component heat resistance and moisture control are two sides of the same coin, and floor life management is covered in detail in our article on implementing an MSD management system.
Why Oven Setpoints and Actual Board Temperature Differ
“The oven zones run at the same settings every day, so the board temperature must be the same too.” This is a common assumption in reflow profile management.
KIC’s technical article “The Science Behind Conveyor Oven Thermal Profiling” (2006, an older source) explains that while the oven profile depends mainly on the zone setpoints, it is also affected by the airflow inside the oven, the total heat capacity of the load and how it is placed, and the ambient room temperature. Areas with large components have a high heat capacity and reach lower peak temperatures. The article even states that, without independent monitoring of the temperature inside the oven, detecting drift during production is “almost impossible.”
In other words, even with identical setpoints, the temperature a board experiences changes with factors such as:
- Board thickness, layer count, amount of copper, and whether there are large components
- How many boards are on the conveyor and at what spacing (loading)
- Changes in airflow due to the condition of fans and nozzles
- The room temperature in the factory
Here it helps to sort out “what each type of record can tell you.”
| Record type | Content | What it can show | What it cannot show |
|---|---|---|---|
| Oven log | Zone setpoints and actual values, conveyor speed, O2 concentration, etc. | Whether the oven ran as set | Whether the components on the board received the intended thermal history |
| Thermocouple profile | Temperature-time curve at measurement points on the profiling board | Whether that one measured board received the intended thermal history at that point in time | The condition of the boards that flowed between measurements |
| Continuous monitoring | Per-board profile calculated from permanently installed in-oven sensors and conveyor speed | Judgment of each board against the window (estimate-based) | Absolute actual temperature without a baseline |
Oven setpoints and oven logs are records of “the oven’s state,” not of “the board’s temperature.” In many cases, it is the latter that audits ask about. That is exactly why both the setpoints and the measured profile need to be kept.
Defects Attributed to the Reflow Profile
What kinds of defects can a profile deviation lead to? The table below summarizes what the Indium technical paper (2016) mentioned above and the paste data sheet say, keeping the strength of their original wording.
| Defect | Explanation in the source | Examples given as profile-side countermeasures |
|---|---|---|
| Voids | Occur in BGA, SGA, QFN, LGA and others, and increase at higher reflow temperatures (paper). In lead-free soldering, a soak to reduce voiding is not as effective as with SnPb (paper) | A soak may reduce voiding in BGA/CSP (Indium8.9HF data sheet) |
| Head-in-pillow (HiP) | Occurs when BGA solder balls lose contact with the paste and oxidize (paper) | A Ramp-to-Peak profile with little or no soak, a slow ramp of 1–1.5°C/s, and a lower peak temperature (paper). Reducing the soak may help reduce HiP and graping (data sheet) |
| Tombstoning | Mainly in passive components, caused by an imbalance of wetting forces. Uneven heating due to ground planes, traces and shadowing by large components (paper) | A slower ambient-to-peak ramp, or a short soak just below the melting point (paper) |
| Solder balling / beading | If the ramp is too fast, flux solvents vaporize violently; if it is too slow, the flux flows out (paper) | A maximum ambient-to-peak ramp of 1–1.5°C/s is recommended (paper) |
| Graping | Unmelted particles remain on the solder surface. More likely with high temperatures, small print deposits and fine powder (paper) | A slow ramp below 1°C/s can make it worse (paper) |
| Cooling and microstructure | Rapid cooling forms a fine microstructure (data sheet). Cooling rate is considered one of the factors affecting solder microstructure and intermetallic morphology | Including the cooling rate in the window and managing it |
Bridging is not included in this table because, in this research, we did not find a primary source describing a direct relationship between bridging and the profile. When a defect is found, isolating “which condition in which process had an effect” requires being able to match inspection results and profile records by the same board ID. Handling of AOI judgment data is explained in our article on AI for solder joint inspection, and inspection of hidden joints such as BGAs in our article on AXI X-ray inspection.
Three Approaches to Reflow Profiling and Monitoring: Thermocouple Profilers, Automatic Profiling and In-Oven Continuous Monitoring
Reflow profile measurement methods fall broadly into three types. The latter two follow the idea of continuous profiling, which tries to see every board even between measurements, and this article treats them as mechanisms for reflow oven profile monitoring. Everything below consists of “vendor claims” based on each vendor’s published materials, and pricing is not covered.
Approach 1: Thermocouple Profiler (Sending the Instrument Through with the Board)
This is the most basic method. A profiling board fitted with thermocouples and a data logger housed in a thermal barrier are sent through the oven.
- Fluke Process Instruments’ Datapaq Reflow Tracker consists of a logger, a thermal barrier, thermocouples and analysis software, and is said to measure with up to 12 sensors (a 2021 trade magazine product feature). The same feature gives the DP5 logger’s accuracy as ±0.5°C and its resolution as ±0.1°C.
- Solderstar lists in its product range 6/9/12-channel profilers as well as oven temperature checkers, oven verification shuttles, and process verification and SPC software.
Its strength is that it directly measures actual measurement points on the board, but it can only measure “one profiling board” at “the moment of measurement.”
Approach 2: Automatic Profiling (Estimating the Profile of Every Board)
KIC’s product page says ProBot “compliments the reflow oven by automatically recording the profile for each and every processed PCB.” The profiles are said to be compared on the spot against the established process window, judging whether each one is within spec without human intervention and without stopping production. At the same time, the page states explicitly that “the ProBot is programmed by running a manual profile using a KIC profiler.” A function that reads barcodes and matches each board’s profile to its number is also listed.
In a webinar announced by KIC and E-tronix in May 2026, automatic profiling was likewise introduced as using embedded sensors and predictive algorithms to generate real-time thermal profiles for all production boards without stopping production.
Approach 3: Continuous Reflow Monitoring in the Oven (Calculating Per-Board Profiles from Permanent Sensors)
According to KIC’s brochure (Rev 2301A), its RPI (Reflow Process Inspection) consists of two thermocouple probes permanently installed in the oven (15 thermocouples each), a data acquisition unit, a speed encoder, a board sensor, alarm relays, a light tower and software. The data acquisition unit is stated to have an accuracy of ±1.2°C and to take 13 readings per second. Listed functions include per-board profiles and their fit to the window, production information such as product name, lot ID, date/time and oven name, per-board traceability, SPC, and Pareto charts of out-of-spec events. It is also a vendor claim that barcode reading prevents “wrong oven program” and “wrong PCBs” errors, and that the system notifies immediately when the process goes out of spec and can stop the loading conveyor if necessary. The brochure also notes: “The RPI requires a KIC profiler.”
On the oven manufacturer side, Rehm’s ProCap is described in a company blog post (2020) as continuously measuring the temperature and heat input across the entire assembly with sensors and storing parameters for each product. This is covered later in the section on oven manufacturers’ logging functions.
Comparing the Three Approaches
| Aspect | Thermocouple profiler | Automatic profiling | In-oven continuous monitoring |
|---|---|---|---|
| What is measured | Actual temperature at measurement points on the profiling board | Profile of each board (by sensors and calculation) | Profile of each board (calculated from permanent sensors and conveyor speed) |
| Boards covered | One profiling board | All boards (vendor claim) | All boards (vendor claim) |
| Stops for measurement | Often required (depends on operation) | Does not stop production (vendor claim) | Does not stop production (vendor claim) |
| Link to board ID | Only the profiling board’s record | Matched via barcode (vendor claim) | Matched via barcode (vendor claim) |
| Role of thermocouples | The measurement itself | A manual profile is assumed for initial setup | A profiler is explicitly required |
| Weakness | Cannot see the boards between measurements | Estimate-based, depends on the quality of the baseline | Estimate-based, depends on the quality of the baseline |
The point we want to emphasize here is that continuous monitoring and automatic profiling do not replace thermocouple measurement. Only when there is a baseline profile created with thermocouples can per-board profiles be calculated from the in-oven sensor values. Put another way, thermocouple measurement shifts its role to “creating the baseline and periodic verification,” while continuous monitoring watches every board between measurements.
Expressing a Profile as One Number with PWI (Process Window Index)
A profile has multiple control values, such as peak temperature, TAL, ramp rate and cooling rate, and there is a set of them for every thermocouple. Comparing all of them every time is hard work. This is where PWI (Process Window Index) comes in.
According to KIC’s explanation “What is your PWI?”, PWI is an index that expresses as a single number how well a profile fits within a user-defined process window (upper and lower limits). It is calculated as follows.
- For each thermocouple and each statistic (peak, TAL, slopes, etc.), “the difference between the measured value and the midpoint of the limits” is divided by “half the width of the limits” and expressed as a percentage
- The maximum of these values (the worst case) is the PWI
- A PWI below 100% is within spec, and 100% or above is out of spec. The smaller the value, the closer the profile is to the center of the window
As a formula: PWI = max(|measured value − midpoint of the limits| ÷ (width of the limits ÷ 2)) × 100%.
Worked Example (Hypothetical Values)
The values below are hypothetical, used only to show how the calculation works, and are not actual measurement results. For the window, we use the Indium8.9HF recommended ranges cited in the section on defining the process window as an example.
| Statistic | Window (example) | Midpoint | Half-width | Measured (hypothetical) | Ratio |
|---|---|---|---|---|---|
| Peak temperature | 230–260°C | 245°C | 15°C | 251°C | 6 ÷ 15 = 40% |
| TAL | 45–60 s | 52.5 s | 7.5 s | 58 s | 5.5 ÷ 7.5 ≈ 73% |
In this example, the PWI is about 73%, the larger of the two. Since it is below 100%, the profile is within spec, but it shows that TAL is leaning toward the upper side of the window. In practice, the same calculation is done for every thermocouple and every statistic, and the maximum is taken.
There are two caveats. First, PWI is an index developed and trademarked by KIC, not an index defined by an industry standard. Second, the PWI value changes depending on how the window is set. A wider window produces a smaller PWI, so “a small PWI means a good process” holds only when the basis of the window (the paste and component data) is documented. If an RFP asks for PWI or an equivalent index, it makes sense to require the window settings and revision control along with it.
Oven Manufacturers’ Logging Functions
Separately from dedicated continuous monitoring systems, reflow ovens themselves also have data output and logging functions. Here too, the content consists of “vendor claims” taken from each company’s published materials.
| Manufacturer / function | What could be confirmed in published materials | Notes |
|---|---|---|
| BTU (Amtech) Wincon | Reading a barcode at the oven entrance creates a production log for that board. Each board’s record is time-stamped, tied to the recipe, and can be linked to MES. Records the setpoint and actual value of each zone, the conveyor speed setpoint and actual value, and O2 concentration (when equipped with a gas sampling unit). Supports GEM, CFX, MQTT, OPC, REST and Hermes | What is recorded is the oven’s state, not the temperature of components on the board |
| Rehm ProCap | Continuously measures temperature and heat input across the entire assembly with sensors, and automatically stores parameters per product. To create the baseline, the first 50 boards of a product, or a metal plate or dummy board, are measured for comparison. Alarm on deviation from the baseline. Detects gradual changes such as nozzle clogging. PDF report output, linked with ViCON software | Based on a 2020 blog post |
| Heller MK7 | A 2026 case study article reports that built-in process monitoring and Industry 4.0 connectivity provided visibility into process status and traceability | Details of supported protocols could not be confirmed this time |
| Kurtz Ersa HOTFLOW THREE | Network platform “Kurtz Ersa CONNECT,” program management “ERSASOFT 5,” and power units said to capture precise process data for each zone | MES connectivity and communication standards could not be confirmed on the product page |
For Japanese oven manufacturers, we could not find published materials describing the traceability functions of their reflow ovens in this research. This does not mean such functions do not exist, so if your plant uses their ovens, please check directly with the manufacturer.
The key point about oven logs, just as in the section on why oven setpoints and actual board temperature differ, is that an oven log is a record of “whether the oven ran as set.” Zone actual values, conveyor speed and O2 concentration are essential information when looking for the cause of a profile deviation, but on their own they cannot tell you “what temperature the components on this board reached.” Only by overlaying the oven log with the thermocouple and continuous monitoring profiles under the same board ID can cause and effect be explained as a single record. For the idea of linking equipment operating data with product history, our article on production equipment traceability is also a useful reference.
Board-Level Records and SMT Traceability: Serial Linking and MES Integration
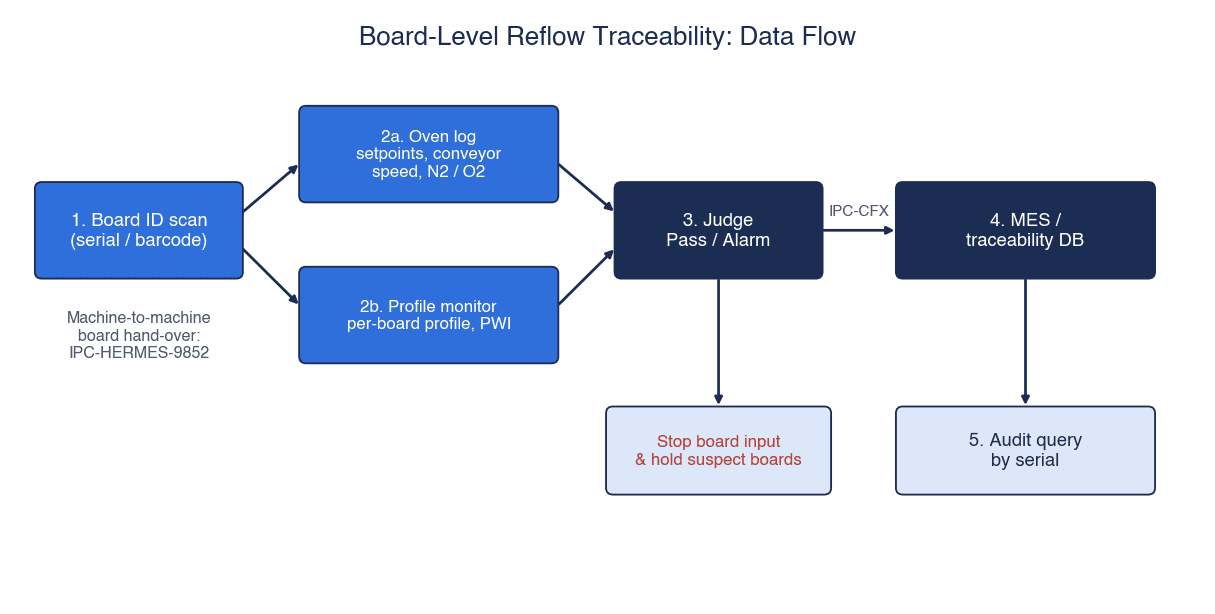
Now let us assemble everything so far into “records that can prove things after the fact.” From an SMT traceability perspective, what reflow condition records need is for the following four elements to be linked to the same board ID.
- Board ID: serial of the board or panel (barcode, 2D code, etc.)
- Oven conditions: recipe name and revision, zone setpoints and actual values, conveyor speed, N2/O2 status
- Profile results: profile of each board (estimated by continuous monitoring), indices such as PWI, pass/fail
- Baseline information: revision of the window used for the judgment, date/time and result of the most recent thermocouple measurement
Where to Read the Board ID
The basic approach is to read the board ID at the oven entrance. BTU says Wincon reads the barcode at the oven entrance to create a per-board log, and KIC’s RPI also advertises per-board traceability through barcode reading. On lines that already read the board ID at the printer or mounter stage, carrying that ID through to the oven (for example with Hermes, described in the next section) is also an option.
For panels (multi-up boards), you need to decide whether records are held by “panel ID” or by “individual board ID.” Since reflow is done panel by panel, one possible design is to hold the oven records by panel ID and keep the panel-to-board mapping table on the MES side.
Record Granularity and Retention Period
The storage capacity required changes greatly depending on whether you keep “the profile curve itself for each board” or limit the records to “per-board summary values (peak, TAL, PWI, pass/fail).” After confirming whether audits may require the curves themselves, as well as customer requirements and product warranty periods, consider tiered retention, such as keeping curves for a set period and summary values for longer. Retention periods are determined by customer requirements and your own quality policy, and this article does not suggest a uniform number of years.
Dividing Roles with the MES
A common division of roles is that the monitoring system “judges and records profiles,” while the MES “links process results to the board ID and uses them for shipping and search.” On the MES side, it is also possible to set up interlocks such as not letting boards whose reflow judgment is “fail” or “no record” move on to the next process. What to use as the tracking unit in an electronics plant is covered in our article on electronics traceability, and the overall design of process condition recording in our article on process parameter recording systems. For plants that serve the automotive sector and undergo IATF 16949 audits, aligning how evidence is kept with our article on IATF 16949 traceability makes the work more efficient.
IPC-CFX and IPC-HERMES-9852: What to Send over Which
Two communication standards often come up for connecting board-level records: IPC-HERMES-9852 and IPC-CFX (IPC-2591). Their names sound similar, but their roles are different.
IPC-HERMES-9852: Passing Boards and Data Between Machines Within the Line
The latest version of IPC-HERMES-9852 is Version 1.7 (June 2026). According to its table of contents and scope description, it is a TCP/IP-based protocol for exchanging board transport on an SMT line, and the data that accompanies it, between machines (M2M). Its stated purposes include replacing the IPC-SMEMA-9851 electrical interface and conveying the unique board ID, the ID of the machine that first detected the board, barcodes, conveyor speed and route, and a lightweight digital twin of the product (product type ID, length, width, thickness, board state).
What matters for reflow records is how the board ID is handled. The Board ID is a GUID generated by the first machine in a continuous chain of Hermes-capable machines and handed from machine to machine. If a machine that does not support Hermes sits in between, the ID is lost and the next supporting machine generates a new ID. In other words, if you want a single ID to run from the printer to the reflow oven, every machine in between has to support it. The table of contents also lists BoardArrived/BoardDeparted for higher-level systems, and an “Oven Error Loop” scenario in an appendix. The revision history begins with v1.0 (March 2017) and runs through v1.6 (2024) to v1.7.
IPC-CFX: Connecting Machines to Higher-Level Systems
IPC-2591 CFX (Connected Factory Exchange) is a communication standard for plug-and-play connections between machines, and between machines and systems. Version 2.0, announced by IPC on April 22, 2025, added hand soldering and wave soldering, bringing the number of supported equipment types to 14. It also cites fields for tracking board variations (such as identifying the board vendor), expanded SMT placement cycle information, and improved handling of dynamic recipe changes during production. However, the release does not describe any additions specific to reflow.
Choosing Between Them
| Aspect | IPC-HERMES-9852 | IPC-CFX |
|---|---|---|
| What it connects | Adjacent machines within the line | Machine to machine, and machines to higher-level systems (MES, etc.) |
| Main content | Board transport, board ID, barcode, conveyor speed, board dimensions and state | Messages between machines and higher-level systems (v2.0 expanded fields for tracking board variations, such as board vendor identification, among other things) |
| Use in reflow records | Carrying the board ID from upstream to the oven | Sending results from the oven or monitoring system to the MES |
| Caveat | The ID breaks if a non-supporting machine sits in between | Support in each oven and monitoring system must be checked product by product |
In practice, you need to check product by product “which messages of which standard the oven or monitoring system supports.” For example, BTU’s Wincon claims support for GEM, MQTT, OPC and REST in addition to CFX and Hermes, but that is not necessarily true of other products. The reliable approach in an RFP is to specify not only the names of the standards but also “which data is sent, in which message, and to where.”
Model Calculation: Line Stop Time and Detection Delay, Manual Measurement vs Continuous Monitoring
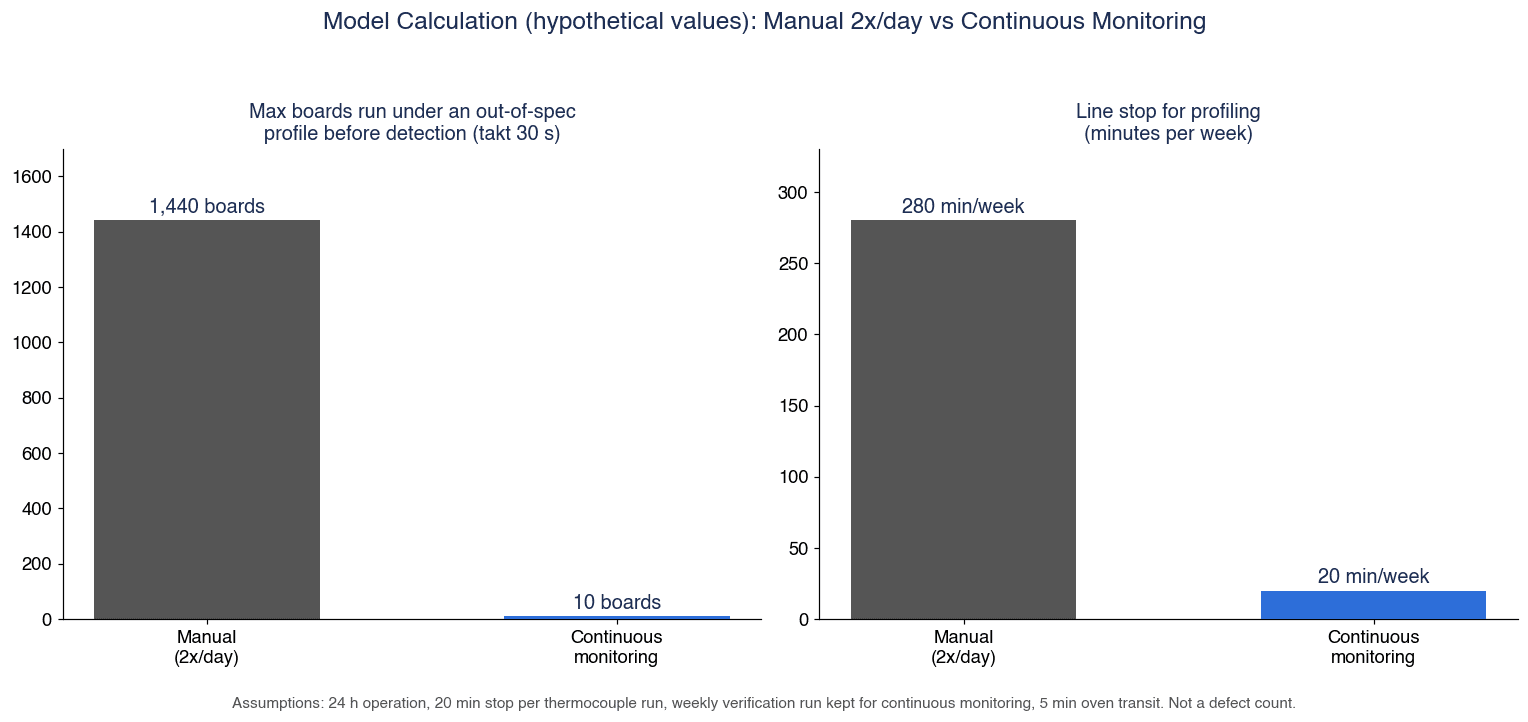
Here we compare manual thermocouple measurement with continuous monitoring on two measures: “line stop time for measurement” and “how many boards can flow before a deviation is noticed.” All numbers are hypothetical values for illustration and are not data from an actual plant. They are not converted into defect counts or monetary amounts.
Assumptions (All Hypothetical)
- Line: 24-hour operation (1 day = 1,440 minutes), reflow oven takt time of 30 s per board
- Manual approach: measured 2 times a day (every 12 hours) with a profiling board fitted with thermocouples. Each measurement stops the line for 20 minutes
- Continuous monitoring approach: every board is judged by permanent in-oven sensors. Thermocouple measurement for baseline creation and verification is kept at once a week (20-minute stop)
- Oven transit time (entrance to exit): 5 minutes (= 300 s)
Thermocouple measurement is not reduced to zero even with continuous monitoring because, as explained above, continuous monitoring presupposes a baseline created with thermocouples.
(1) Line Stop Time for Measurement
| Item | Manual (2 times a day) | Continuous monitoring (weekly verification only) |
|---|---|---|
| Per day | 2 × 20 min = 40 min | 20 min ÷ 7 days ≈ 2.86 min |
| Per week | 40 min × 7 days = 280 min | 20 min |
| Difference (per week) | 280 min − 20 min = 260 min | – |
| Boards not produced during stops (per day) | 40 min × 60 s ÷ 30 s = 80 boards | 2.86 min × 60 s ÷ 30 s ≈ 5.7 boards |
(2) Detection Delay After a Deviation
| Item | Manual (every 12 hours) | Continuous monitoring |
|---|---|---|
| Maximum undetected time | Measurement interval of 12 hours = 720 min = 43,200 s | Oven transit time of 5 min = 300 s |
| Maximum boards that can flow | 43,200 s ÷ 30 s = 1,440 boards | 300 s ÷ 30 s = 10 boards (the boards inside the oven) |
| Average undetected boards (assuming the start of the deviation is uniformly distributed within the measurement interval) | 1,440 boards ÷ 2 = 720 boards | 10 boards or fewer |
| Ratio (maximum) | 1,440 ÷ 10 = 144 times | – |
(3) Changing Only the Takt Time (Manual, Maximum Undetected Boards)
| Takt time | Calculation | Maximum boards that can flow |
|---|---|---|
| 20 s | 43,200 s ÷ 20 s | 2,160 boards |
| 30 s | 43,200 s ÷ 30 s | 1,440 boards |
| 60 s | 43,200 s ÷ 60 s | 720 boards |
The shorter the takt time (that is, the higher the output), the more boards flow between measurements. Halving the measurement interval halves the number of undetected boards, but increases the stop time for measurement accordingly. The key point of this calculation is that with the manual approach, “speed of detection” and “stop time” are a trade-off, whereas continuous monitoring can potentially reduce both at the same time.
Caveats for This Calculation
- The manual approach’s “maximum of 1,440 boards” is the upper bound for the case where a deviation starts right after a measurement and goes unnoticed until the next one. The possibility that problems are caught as defects in downstream processes such as AOI or X-ray inspection is not included in this calculation.
- “Boards that flowed under deviated conditions” are not the same as “defective products.” Going outside the process window does not necessarily result in an immediate defect. For this reason, nothing here is converted into defect rates or loss amounts.
- The 10 boards on the continuous monitoring side are “the boards inside the oven until the judgment comes out at the oven exit.” The operational delay between receiving the alarm and stopping the loading is not included.
- The 20 minutes per measurement, 2 measurements a day, weekly verification, 5 minutes in the oven and 30 s takt time are all assumptions. Actual values differ by plant, oven and product.
When running your own calculation, start by replacing the current “measurement frequency,” “stop time per measurement,” “takt time” and “oven transit time” with measured values. That alone gives you material for explaining the effect of continuous monitoring.
Trends in Thailand’s Electronics Industry, and Why Now
Investment in and exports from Thailand’s electronics industry continue to grow. Because the scope and timing of the figures differ by source, we list them side by side.
| Indicator | Value | Scope / timing | Source |
|---|---|---|---|
| Thailand goods exports | USD 34.62 billion, +24.3% YoY (industrial products +27.1%) | August 2026 single month, USD basis | Trade Policy and Strategy Office, Ministry of Commerce (The Nation, September 25, 2026) |
| Thailand goods exports, cumulative | USD 266.15 billion, +18.9% | January–August 2026 | Same as above |
| BOI investment promotion applications (electrical and electronics) | THB 120.23 billion, 179 projects | January–June 2026, application basis | The Nation (July 23, 2026) |
| BOI investment promotion applications (total) | THB 1.47 trillion (USD 47.47 billion), 1,299 projects, +37% YoY | January–June 2026 | BOI Press Release No.124/2569 |
| HDD export value | USD 9.8 billion, +21.1% | January–October 2025 | Krungsri Research (December 17, 2025) |
| IC export value | USD 9.3 billion, +30.5% | January–October 2025 | Same as above |
For August 2026 exports, computers and parts, integrated circuits and printed circuits were reported to have performed strongly on the back of AI infrastructure investment. The BOI’s release of August 4, 2026 also states that there is momentum in photonics devices, PCB and semiconductor-related activities in the electrical and electronics and AI supply chain sectors.
On the PCB sector, BOI Press Release No.122/2569 (August 3, 2026) states that investment promotion applications in the semiconductor and advanced electronics sectors over the past 3 years exceeded USD 26.8 billion, of which the PCB sector accounted for 224 projects and USD 9.85 billion (approx. THB 331 billion). The aggregation period for PCB alone is not stated explicitly in the original. In the same release, the BOI Secretary-General says that “more than half of the world’s top PCB manufacturers have now selected Thailand as their production base.”
Separately, The Nation (February 23, 2026), citing BOI data, reported that more than 180 PCB investment projects worth over THB 200 billion were applied for between 2022 and June 2025. Because these two figures cover different periods and scopes, they cannot be added together or compared.
Krungsri Research projects that Thailand’s HDD export value will grow 7.5–8.5% per year and its IC export value 2.5–3.5% per year in 2026–2028 (the company’s forecast).
Why Revisit Reflow Profile Management Now
As more new PCB and electronic component plants are established in Thailand, it is conceivable that process condition records will be compared more closely than before when customers select suppliers and conduct audits. The more product changeovers a plant has, the more its manual measurement count and stop time pile up. At this stage, while capital investment plans are being drawn up, there is value in revisiting the profile management mechanism together with oven replacement or expansion.
Implementation Steps: A Phased Approach over About 90 Days
The following is a guideline for how to proceed. Durations will vary with plant size, number of lines, and the state of existing ovens and systems.
| Phase | Indicative timing | Main work | Deliverables |
|---|---|---|---|
| 1. Current-state inventory | Weeks 1–3 | Check thermocouple measurement frequency and where and in what format records are stored; check oven models and data output; check where board IDs are read | List of current records; whether process window documents exist for each product |
| 2. Documenting windows | Weeks 2–5 | Organize windows for each combination of paste, components and board; state the TAL reference temperature; set rules for revision control | Process window documents (with revisions) |
| 3. Comparison on one line | Weeks 5–10 | Trial continuous monitoring (or oven logs) on one line and run thermocouple measurements over the same period for comparison | Comparison results, draft alarm conditions |
| 4. MES integration | Weeks 8–12 | Link board IDs with profile results and oven conditions, design interlocks, check search screens | Integration specification, test records |
| 5. Rollout decision | Week 12 onward | Decide the scope and order of rollout to other lines and the operating rules (thermocouple measurement frequency, response to alarms) | Rollout plan, operating procedures |
A situation often found in Phase 1 is that “thermocouple results are kept, but which window was used for the pass/fail judgment is not,” or that “the change history of oven recipes is not kept.” The results of this inventory alone settle many of the RFP requirements. In Phase 3, it is also worth drafting an operating rule on which to trust when continuous monitoring alarms and thermocouple results disagree.
For how reflow records fit into the overall picture of a production management system, see also our article on production management systems for electronics and EMS plants.
12 Items to Include in the RFP
We have organized into 12 items what you will want to include in an RFP when procuring a reflow profile management system. At the center is “what is stored, at what unit, for how long, and how the line is stopped when a deviation occurs.”
| No. | Item | Example content |
|---|---|---|
| 1 | Scope | Number of target lines, oven models and count, relationship with existing systems (MES, etc.) |
| 2 | Recording unit | Panel ID or individual board ID, and where the panel-to-board mapping is held |
| 3 | Recorded items | Board ID, recipe name and revision, zone setpoints and actual values, conveyor speed, N2/O2 status, profile summary values, index, pass/fail |
| 4 | Profile judgment method | How the window is defined (statistics, upper and lower limits), TAL reference temperature, calculation method for indices such as PWI |
| 5 | Window revision control | Records of who made changes, when, and approvals; record of the revision used for each judgment |
| 6 | Baseline creation and verification | Procedure for creating baseline profiles with thermocouples, periodic verification method, storage of verification results |
| 7 | Behavior on deviation | How alarms are raised (screen, light tower, notifications), whether and under what conditions loading is stopped, authority to release |
| 8 | Mix-up prevention | Matching board ID and recipe, checks at product changeover |
| 9 | Retention period and capacity | Retention periods for curve data and for summary values, capacity estimate |
| 10 | Search and output | Search by board ID, date/time and lot; output format for audits |
| 11 | Integration with higher-level systems | Data to be sent, communication standards (CFX, Hermes, etc.) and supported messages, handling of integration failures |
| 12 | Maintenance and training | Sensor calibration and replacement, software updates, operator training in local languages, support structure within Thailand |
“Recorded items” and “behavior on deviation” are where the scope of standard functions differs between vendors. Even where a vendor says “it can,” this may presuppose additional sensors or equipment (for example, a gas sampling unit for O2 concentration), so asking vendors to answer including those prerequisites makes comparison easier.
Acceptance Testing (FAT/SAT) Checklist
Acceptance testing should confirm not only “whether records are captured as specified” but also “whether the line really stops when a deviation occurs.” Numerical pass/fail criteria are decided by your own company to fit the product, customer requirements and process capability, and written into the RFP and test plan in advance.
| Check item | Test method | How to set pass/fail criteria |
|---|---|---|
| Comparison with thermocouple measurements | Run the same board with thermocouples attached and compare continuous monitoring’s calculated values with measured values (peak, TAL, etc.) | Decide the acceptable difference in-house |
| Correctness of window judgment | Check whether judgment results match results calculated by hand from the window | Decide in-house, e.g. whether to require zero mismatches |
| Alarm on simulated deviation | Intentionally change the recipe or conveyor speed and record whether an alarm is raised and how long it takes | Decide the acceptable time in-house |
| Loading stop behavior | Check whether the loading conveyor stops in conjunction with the alarm and whether release authority is enforced | Whether behavior and authority match the specification |
| Missing serial links | Match the board IDs run during the test period against the recorded board IDs and count missing and duplicate entries | Decide the acceptable missing rate in-house |
| Mix-up prevention | Load the wrong recipe or the wrong board and check whether it is detected | Whether it is detected |
| Integration with higher-level systems | Check whether data arrives correctly at the MES, and how missing data and resends are handled when communication is cut | Whether it matches the integration specification |
| Storage and search | With data for the expected period loaded, search by board ID and measure the time until results appear | Decide the acceptable search time in-house |
| Time synchronization | Check whether the clocks of the oven, monitoring system and MES are aligned | Decide the acceptable time difference in-house |
In FAT (factory acceptance test), the functions are checked in the vendor’s environment; in SAT (site acceptance test), the same items are repeated with your own oven, your own boards and your own network. “Comparison with thermocouple measurements” in particular means nothing unless it is done with the real oven and real boards, so it should always be carried out at SAT.
Frequently Asked Questions
What is a reflow temperature profile?
It is the change in temperature over time (a temperature-time curve) experienced by measurement points on a board as it passes through a reflow oven. It is generally divided into preheat, soak, reflow and cooling zones, and managed through values such as ramp rate, soak temperature and time, peak temperature, TAL (time above liquidus) and cooling rate. The pass/fail range is determined from the data sheet of the solder paste in use and the heat-resistance limits of the components.
How often should reflow profiling be done?
In this research, we did not find a reliable source giving a common industry-standard frequency. In practice, it is decided based on the product, the frequency of changeovers, customer requirements and process stability. As the calculation in this article shows, the longer the measurement interval, the more boards can flow before a deviation is noticed, so whether that number of boards is acceptable is a useful basis for the decision.
If we introduce continuous reflow monitoring, can we stop thermocouple profiling?
No. For example, KIC states explicitly that its RPI and ProBot presuppose a manual profile from a thermocouple profiler. The role of thermocouple measurement shifts from “checking every time” to “creating the baseline and periodic verification,” but it does not go away.
What is PWI?
Short for Process Window Index, PWI is an index developed by KIC that expresses as a single number how well a profile fits within the process window. It takes the largest of the ratios obtained by dividing each statistic’s “deviation from the midpoint” by “half the window width,” and a value below 100% is treated as within spec. Keep in mind that it is not an index defined by an industry standard, and that its value changes with how the window is set.
Is the reflow oven log alone enough for traceability?
The oven log is a record of “whether the oven ran as set,” not a record of what temperature the components on the board reached. Oven logs linked to board IDs are useful for cause investigation, but to explain profile pass/fail they need to be combined with board profiles from thermocouple measurement or continuous monitoring.
What is the difference between IPC-CFX and Hermes?
IPC-HERMES-9852 is a protocol for passing board transport and data such as board IDs between adjacent machines on an SMT line. IPC-CFX is a communication standard that connects machines with each other and with higher-level systems (MES, etc.), and in reflow records it is used mainly for sending data upward. In reflow records, one possible division of roles is Hermes for carrying the board ID from upstream to the oven, and CFX for sending results from the oven or monitoring system to the MES.
How much does a reflow oven profile monitoring system cost?
The cost varies greatly with the number of target lines and ovens, how much data the existing ovens can output, whether continuous monitoring sensors are added, and whether and how far MES integration extends, so we cannot give a general figure. The reliable approach is to fix the scope, the recorded items and the integration scope in an RFP, and then obtain and compare quotes from multiple vendors.
Summary
- Reflow profile management is designed not around “how often you measure,” but around “whether you can later prove which board went through which conditions”
- Oven setpoints and oven logs are records of “the oven’s state,” not the actual board temperature. Both the setpoints and the measured profile need to be kept
- The process window is determined from both sides, the recommended range of the paste (e.g. Indium8.9HF recommended peak of 230–260°C and recommended TAL of 45–60 s) and the heat-resistance limits of the components (e.g. the J-STD-020F classification temperature of 260°C for lead-free packages under 1.6mm thick), and documented with revisions for each combination
- The TAL reference temperature (217°C or 220°C) differs between sources, so it should be stated explicitly in your own documents
- Continuous monitoring does not replace thermocouple measurement. Thermocouples shift their role to baseline creation and periodic verification
- In the hypothetical calculation, manual measurement 2 times a day allows up to 1,440 boards to flow under deviated conditions, versus around 10 boards inside the oven with continuous monitoring. Stop time for measurement goes from 280 minutes to 20 minutes per week (all hypothetical values)
- Oven conditions, profile results and the window revision are linked to the board ID. IPC-HERMES-9852 between machines and IPC-CFX to higher-level systems are the options
- The RFP states “what is stored, at what unit, for how long, and how the line is stopped when a deviation occurs,” and FAT/SAT tests the comparison with thermocouple measurements and the stop behavior
TOMAS TECH supports Japanese manufacturers in Thailand in building process condition recording and traceability systems. Even before a product has been selected, you are welcome to consult us at stages such as taking stock of your current measurement records, organizing process windows, designing MES integration or preparing an RFP. Please feel free to get in touch through our contact page.
References
- AIM Solder, SAC305 Lead-Free Solder Alloy TDS: https://assets.testequity.com/te1/Documents/AIM_SAC305_TDS.pdf
- Senju Metal Industry, 2025 soldering materials catalogue (2025-12): https://www.senju.com/ja/download/pdf/2025_soldering_materials_catalogue.pdf
- Indium Corporation, Indium8.9HF (T5/T6) Product Data Sheet Form No. 99211 R6: https://www.indium.com/wp-content/uploads/2025/01/Indium8.9HF-T5-and-T6-Powders-PDS-99211-R6-1.pdf
- IPC, IPC-7530B Table of Contents (January 2025 edition): https://www.ipc.org/TOC/IPC-7530B-TOC.pdf
- Indium Corporation (republished by KIC), Best Practices Reflow Profiling for Lead-Free SMT Assembly (2016): https://kicthermal.com/article-paper/best-practices-reflow-profiling-for-lead-free-smt-assembly/
- Nexperia, Reflow soldering profile Rev. 1.2 (2026-02-10): https://assets.nexperia.com/documents/other-type/REFLOW_BG-BD-1.pdf
- IPC, IPC Releases Version 2.0 of IPC-2591 Connected Factory Exchange (2025-04-22): https://www.electronics.org/news-release/ipc-releases-version-20-ipc-2591-connected-factory-exchange-expanded-device-coverage
- IPC, IPC-HERMES-9852 Version 1.7 Table of Contents (June 2026): https://www.electronics.org/TOC/IPC-HERMES-9852v1.7-toc.pdf
- EPP Europe News, Fluke Process Instruments showcases temperature profilers for reflow processes (2021-11-11): https://epp-europe-news.com/technology/products/fluke-process-instruments-showcases-temperature-profilers-for-reflow-processes/
- Solderstar, Reflow solutions: https://solderstar.com/en/solderstar-solutions/solutions-reflow
- KIC, RPI product page: https://kicthermal.com/kic-rpi/
- KIC, RPI brochure Rev 2301A: https://kicthermal.com/wp-content/uploads/2026/05/kic-rpi-en-r2301a.pdf
- KIC, ProBot: https://kicthermal.com/products/automatic-thermal-process-inspection/probot/
- KIC, KIC and E-tronix to Host Webinar on Automatic Profiling (2026-05-08): https://kicthermal.com/kic-and-e-tronix-to-host-webinar-on-automatic-profiling-for-modern-smt-manufacturing/
- KIC, What is your PWI?: https://kicthermal.com/why-kic/what-is-your-pwi/
- Rehm Thermal Systems, Reliable Soldering Through Innovative Process Monitoring (2020-10-14): https://www.rehm-group.com/en/news/blog/details/reliable-soldering-through-innovative-process-monitoring.html
- KIC, The Science Behind Conveyor Oven Thermal Profiling (2006): https://kicthermal.com/article-paper/the-science-behind-conveyor-oven-thermal-profiling/
- BTU International, Reflow Oven Traceability (Wincon): https://www.btu.com/fr/wincon-control-system/industry-4-0/
- Circuits Assembly, UberSMT Installs Heller MK7 Oven: https://www.circuitsassembly.com/ca/current/43297-smarter-reflow-stronger-output-ubersmt-installs-heller-mk7-oven.html
- Kurtz Ersa, HOTFLOW THREE: https://kurtzersa.com/products/electronics-production/soldering-machines/reflow-soldering-systems/hotflow-three
- The Nation Thailand (2026-09-25), August 2026 exports: https://www.nationthailand.com/business/economy/40071468
- The Nation Thailand (2026-07-23), BOI applications in the first half of 2026: https://www.nationthailand.com/business/economy/40068948
- BOI Press Release No.124/2569 (2026-08-04): https://www.boi.go.th/upload/content/No.124_2569.pdf
- BOI Press Release No.122/2569 (2026-08-03): https://www.boi.go.th/upload/content/PR122_2569EN.pdf
- The Nation Thailand (2026-02-23), PCB investment: https://www.nationthailand.com/business/investment/40062873
- Krungsri Research, Industry Outlook 2026-2028: Electronics Industry (2025-12-17): https://www.krungsri.com/en/research/industry/industry-outlook/hi-tech-industries/electronics/io/electronics-2026-2028


