


Factories in Thailand that are considering S&OP implementation tend to repeat the same scene every month. Sales builds its customer-by-customer sales outlook in its own Excel file. Production control copies last month’s production plan and edits the numbers. Purchasing maintains a materials procurement sheet, and Accounting keeps a budget-versus-actual sheet, each in a separate file. At the monthly meeting, the numbers in the 4 spreadsheets do not match, and 2 hours go by just reconciling which one is the correct number.
Meanwhile, customer forecasts (the provisional quantities customers share ahead of firm orders) keep moving. When a customer suddenly says next month’s volume will rise by 20%, production control schedules holiday work and purchasing brings in materials by air freight. When the forecast drops, half-finished products and freshly purchased materials pile up in the warehouse. The warehouse shelves fill up a little more every year, yet certain part numbers still run out, and Sales has to go and apologize to the customer. This is a familiar picture at Japanese-affiliated automotive parts, electronic components, plastic molding, metal processing and food plants in Ayutthaya, Chonburi, Rayong and the Bangkok area.
This article is a practical guide for plant managers, production control managers, sales administration, purchasing, corporate planning, accounting and IT staff at those plants. It covers what to decide, in what order, with which tools, how to compare options and how to move forward when starting S&OP (Sales and Operations Planning, the planning process that connects sales and business plans with production and supply plans).
Here is the main argument of this article up front.
The core of S&OP implementation is not software. It is an agreement on who decides what, every month, based on which numbers.
S&OP is a monthly decision-making process. It aligns the demand plan and the supply plan into one number, in other words one plan, and escalates the gaps that cannot be closed as issues for management to decide. Implementations typically go wrong in 3 ways:
- (1) There is a meeting, but what the meeting is supposed to decide has never been defined (it has become a reporting session)
- (2) The sales plan arrives with targets and expected figures mixed together
- (3) Supply-side constraints (equipment and labor capacity, material lead times, the BOI maximum stock and so on) are not organized before the meeting
That is why the sequence is: (1) the meeting’s decision items and the monthly calendar, then (2) one number (product family x month x quantity and value), then (3) measurement of forecast accuracy and bias, and only then (4) tools. A tool only pays back once inventory size, the number of items and the number of sites become large. The model calculation in the second half of the article shows this with figures for different inventory sizes.
Note that this article does not recommend specific products or rank them. Product functions are introduced as described in each vendor’s official documentation or in articles about the products (that is, as vendor claims). All inventory amounts, costs, hours and effects in the calculation are hypothetical figures created for this article.
Why factories in Thailand should revisit demand and supply balancing now
New orders are strong, but business sentiment stays below 50
The latest figures for Thai manufacturing do not point in the same direction.
According to Trading Economics, the S&P Global Thailand Manufacturing PMI was 54.3 in September 2026 (53.8 in August), the highest level since December 2025. Output grew at the fastest pace in 9 months and new orders rose at the strongest rate in 6 months. On the other hand, employment fell through attrition, and backlogs of work built up, which was reported as a sign of capacity pressure.
However, the Bank of Thailand (BOT) Business Sentiment Index (BSI) was 48.1 in September 2026 (49.8 in August), below 50 for the 9th consecutive month. The same report said sentiment in the automotive industry worsened, and that automotive parts makers in particular saw lower demand for domestically produced parts as EV imports increased. The BSI for the outlook 3 months ahead was 50.8 (50.5 in August).
PMI and BSI are indicators produced by different organizations with different survey targets. Neither one is the right one. What can be read from them is that a situation continues in which some companies report strong orders while many others report weak business sentiment.
Demand is moving in different directions by industry
Breaking it down by industry makes the difference even clearer.
On the electronics side, the figures are strong. According to a Reuters report, the Thai Ministry of Industry’s Manufacturing Production Index (MPI) rose 4.44% year on year in August 2026, beating the market forecast of 1.0%. The drivers cited were higher electronics output, government stimulus measures and a weaker baht. At the same time, however, the ministry revised the MPI calculation method, for example by adding new electronic products and changing the weights. According to Trading Economics, the August breakdown showed communication equipment up 24.41% year on year and computers and peripherals up 28.23%. Exports in August 2026 were reported at USD 34.6 billion, up 24.3% year on year, with computers and parts up 42.1%.
On the automotive side, month-to-month swings have become large. According to reports, Thai car production year on year was −7.55% in June 2026, +6.12% in July (117,383 units) and +10.93% in August (124,646 units). In August, domestic sales rose 25.59% while exports fell 2.04%. The Federation of Thai Industries (FTI) forecasts full-year 2026 car production to fall 3.33%. This is a downward revision from its previous forecast of a 3% increase, citing lower exports due to the situation in the Middle East.
In addition, in May 2026, 10 Thai automotive and parts industry associations (with more than 1,500 members) told the government that EV adoption was eroding domestic production and that parts makers were losing orders because they could not compete with cheap zero-tariff imports from China. They warned that the industry could fall off a cliff in 2027, when the EV production incentives end (Reuters).
Export conditions also change almost every month
Export conditions for the United States are moving too. According to The Nation (October 7, 2026), the US reciprocal tariff was lowered from 36% in 2025 to 19%, while Thai products are reportedly subject to a 12.5% tariff under Section 301 related to forced labor, and Thailand is negotiating to keep the total tariff burden down. In addition, a report by the White House Office of Trade and Manufacturing Policy (August 13, 2026) placed Thailand in Tier 2 for transshipment. It was reported that cargo that US Customs and Border Protection (CBP) judges to be illegally transshipped may face penalties such as an additional 40% tariff.
Re-aligning month by month, because demand swings month by month
The figures above all have different scopes and definitions. They cannot be added together or applied to your own sales for next month. The point of this article is simpler than that.
Even within Thai manufacturing, the direction of demand differs by industry, and it swings from month to month. Electronics plants tend to struggle with orders that are too strong for their capacity. Automotive parts plants tend to struggle with not being able to read next month’s volume. In both cases, if a plant keeps running on a budget built once a year or a capacity plan made 6 months ago, the shop floor ends up absorbing the gap with express shipments and holiday work, month after month.
Reviewing demand and supply every month on the same table, and raising gaps to management decisions early: that is the role of S&OP.
What is S&OP: the 5-step monthly cycle
A fixed monthly procedure for building one plan
According to TechTarget, S&OP is a process in which the sales department works with the operations (production and supply) department to create a single production plan, so that a manufacturer’s supply better matches demand. It is usually run through monthly meetings and proceeds in 5 steps: (1) data gathering, (2) demand planning, (3) production (supply) planning, (4) reconciliation and (5) an executive meeting.
An SAPinsider article describes the same 5 steps as follows.
- STEP 1 Data gathering: review sales actuals, prepare the data and finalize the statistical forecasting model
- STEP 2 Demand planning: close with a consensus (agreed) forecast
- STEP 3 Supply planning: confirm capacity and material constraints
- STEP 4 Pre-S&OP meeting: decide the recommendations and agenda for the executive meeting
- STEP 5 Executive S&OP: issue the organization’s action plan
Each step is carried out according to a calendar fixed for every month. This is the key point. S&OP is not a meeting held when needed. It is a procedure run every month in the same order with the same cut-off dates.
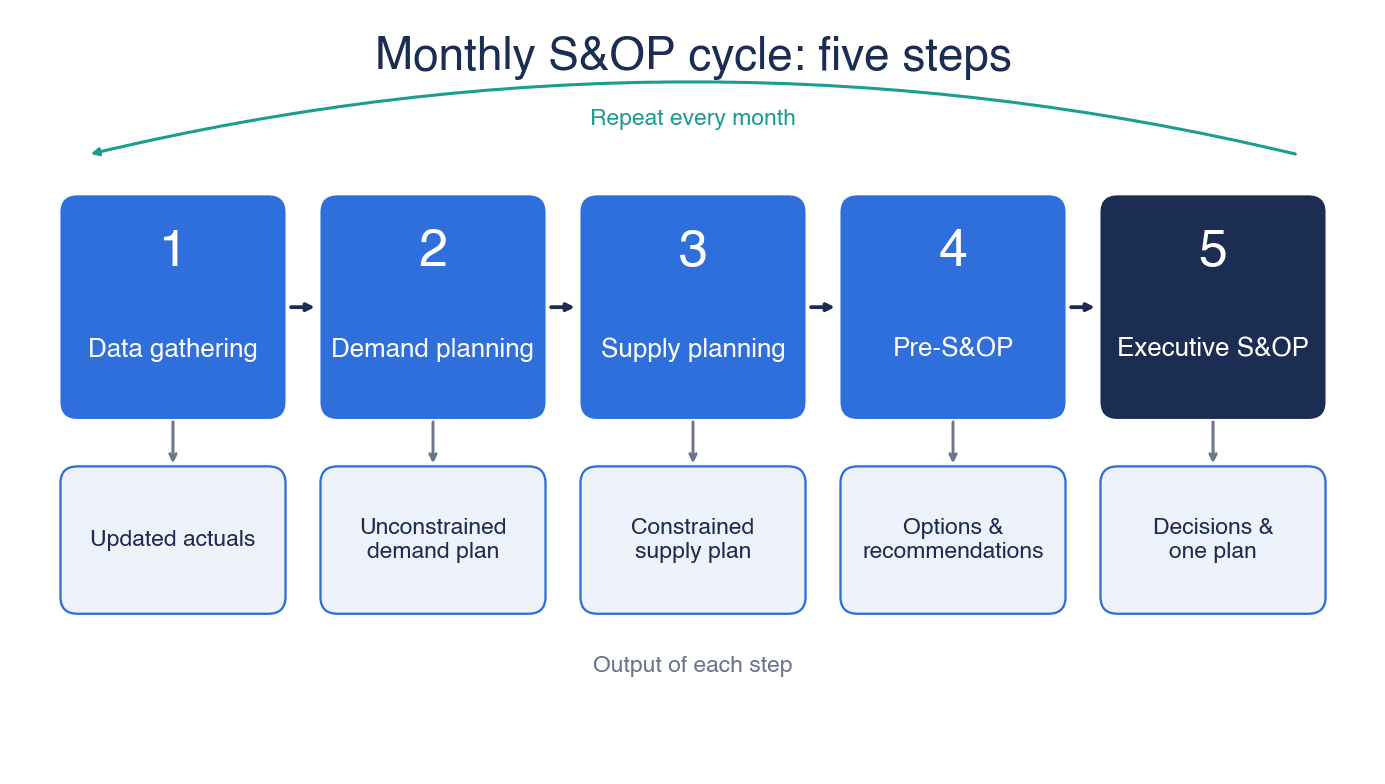
Inputs, outputs and participants for each step
Translated to a Japanese-affiliated plant in Thailand, the 5 steps could look like the table below. The durations are one example of a rough guide for running one cycle from the start of the month to the middle of the month. They vary with company size and meeting frequency.
| Step | Main inputs | Output | Main participants | Rough duration (one example) |
|---|---|---|---|---|
| 1 Data gathering | Last month’s shipment, production and inventory actuals, order backlog, customer forecasts | Updated actuals (closed numbers) | Production control, sales administration, warehouse, IT | About 3 business days at the start of the month |
| 2 Demand planning | Statistical forecast, customer forecasts, firm orders, sales judgment | Unconstrained demand plan | Sales, sales administration, demand planner | About 3 business days |
| 3 Supply planning | Demand plan, equipment and labor capacity, material lead times, inventory policy | Constrained supply plan | Production control, manufacturing, purchasing, warehouse | About 3 business days |
| 4 Pre-S&OP | Gap between demand plan and supply plan, financial impact | Options and recommendations, agenda for the executive meeting | Section managers from each department, accounting | 1 to 2 days (the meeting itself takes about half a day) |
| 5 Executive S&OP | Recommendations, quantity and value for each option | Decisions and one plan | President or plant manager, department heads, head of accounting | Meeting of 1 to 2 hours |
The key point is that the output of step 2 is an unconstrained demand plan. Sales should not hold back by thinking “capacity is short, so let’s submit a lower number”. It submits the volume it actually expects to sell. Capacity and material constraints are applied in step 3. Done this way, the volume that could be sold but cannot be produced becomes clearly visible, and what to do about it becomes the issue for steps 4 and 5.
S&OP vs PSI planning vs IBP
PSI planning balances quantities; S&OP makes management decisions on quantity and value
In Japanese manufacturing, the term PSI planning may be more familiar than S&OP. PSI stands for Production, Sales and Inventory, and it is a term widely used on Japanese shop floors (some explanations read the P as Purchase instead).
According to an explanation on the Japanese site IT Trend, PSI management is a method that links the plans and actuals of production and purchasing, sales and inventory, and manages what to make, buy, sell and hold on the same time axis in order to balance supply and demand. It then explains that while PSI management focuses on the operational balance of supply and demand, S&OP differs in that it builds financial indicators such as revenue and profit into decision-making.
KPMG Consulting also contrasts the two. It describes conventional PSI planning as focused mainly on quantity-based, shop-floor-level adjustment and centered on responding to short-term issues, whereas S&OP is a strategy-linked decision-making process that integrates management and the shop floor from a mid- to long-term perspective.
IBP extends S&OP to strategy and finance
Another term that comes up often is IBP (Integrated Business Planning). The consulting firm Oliver Wight defines IBP as a decision-making process that aligns strategy, portfolio, demand, supply and the resulting financials through a monthly re-planning process. It describes IBP as an exception-driven review that projects the plan on a rolling basis 24 months ahead and focuses every month on what has changed since the previous plan. TechTarget also explains that S&OP is closely related to IBP (a more comprehensive, longer-term planning process) and is often a component of it.
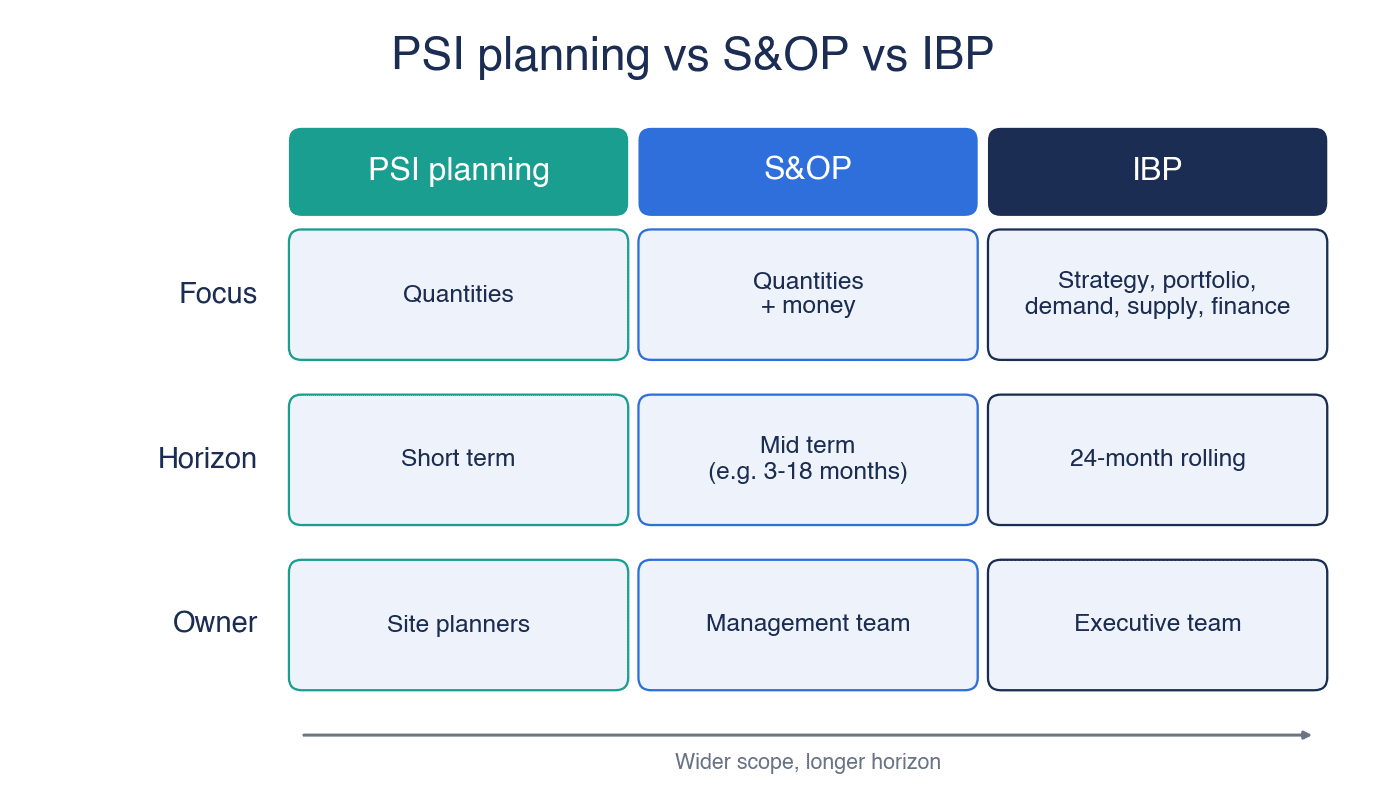
Putting the 3 side by side gives the following picture. The S&OP horizon of 3 to 18 months is a rough guide used in this article and refers to the core period for management decisions (from 3 months ahead to 18 months ahead). The plan itself covers the period from the end of the freeze window to 18 months ahead (see below).
| Aspect | PSI planning | S&OP | IBP |
|---|---|---|---|
| Core numbers | Quantities (production, sales, inventory) | Quantities + value | Strategy, portfolio, demand, supply, finance |
| Main purpose | Balancing supply and demand on the shop floor | Aligning demand and supply into one plan, with management deciding the gaps | Aligning the whole business plan every month |
| Horizon | Short term (mainly weeks to a few months) | Mid term (3 to 18 months as a rough guide in this article) | 24-month rolling |
| Main owners | Site planners | Management team (plant manager, department heads, accounting) | Executive team |
| Nature of the meeting | Adjustment and confirmation | Comparing options and deciding | Deciding mainly on changes (exceptions) since the previous plan |
The 3 are not alternatives to choose from. They are stages. A plant that has not yet balanced its quantities in PSI planning will not succeed by aiming straight for IBP. For many Japanese-affiliated plants in Thailand, the realistic order is to first put PSI quantities onto the monthly S&OP cycle, then add value on top of them.
Boundaries with production schedulers and the freeze window
S&OP is often confused with production schedulers (APS), which build detailed day-to-week schedules. S&OP is the monthly forum where people agree, at product family level, on how much to make, sell and hold, in both quantity and value. Its output (production volume per product family for next month onward) is then broken down in the APS into a daily sequence for each machine. Moving from Excel schedules to an APS is covered in Production Planning Excel Migration | APS Guide for Thai Factories, and how to compare products is covered in Production Scheduler Comparison 2026 for Thailand Factories.
The rule that keeps the plan for the next few weeks fixed is defined as the freeze window. S&OP handles the period beyond the freeze window. If the period inside the freeze window is governed by change approval rules and the period beyond it by the monthly S&OP agreement, the shop floor no longer has to wonder which period’s numbers may be changed and on whose judgment. For how to set the freeze window, see Production Plan Freeze Window: Rules, Exceptions and Acceptance Tests.
3 reasons S&OP implementations go wrong
A plant reads a book on S&OP, builds a 5-step calendar and launches a monthly meeting. Even so, 6 months later it is back to the old meeting where people just reconcile numbers. Such plants are not rare. The reasons usually come down to the following 3.
Reason 1: What the meeting decides has not been defined
The most common case is a monthly meeting that has become a reporting session. Sales explains last month’s sales actuals and next month’s outlook, production control explains production actuals and utilization, purchasing explains the status of incoming materials and accounting explains the gap against budget. Time runs out just as everyone finishes, and the meeting closes with “let’s keep watching this next month”.
Reporting can be done with materials before the meeting. What the meeting should really do is decide, wherever demand and supply diverge, which side to move toward. If the decision items are not defined in advance, the meeting fills up with reports.
Reason 2: The sales plan mixes targets and expected figures
The second reason is the nature of the sales plan that comes from Sales. Sales numbers tend to mix 2 kinds of figures. One is the target (budget): “this is how much we want to sell this term”. The other is the expected figure (forecast): “based on customer forecasts and ongoing deals, this is about how much it will actually be”.
If targets go into the production plan, inventory piles up by the amount that is not achieved. Conversely, if Sales submits a low outlook so as not to be blamed for missing targets, the plant ends up absorbing upside in customer forecasts with express shipments and holiday work. The situation described at the start, where inventory is rising and yet stockouts still occur, tends to arise when the nature of the numbers varies from item to item.
Reason 3: Supply-side constraints are not organized before the meeting
The third reason is supply-side information. When asked “can we increase this product family by 20% next month?”, production control often cannot answer on the spot. The reason is that constraints such as equipment capacity, people and shifts, the number of molds and jigs, material lead times and minimum order quantities (MOQ), and the maximum stock approved by the BOI have not been organized into one table before the meeting.
When no one can answer on the spot, the response becomes “we’ll check and get back to you”, and the decision is carried over to the next month. While it is carried over, the customer forecast quantities become firm, and in the end the shop floor absorbs them with overtime.
The following chapters explain a procedure for each of these 3 reasons in turn. Reason 1 is addressed by defining the decision items first, reason 2 by building one number and separating targets from expected figures, and reason 3 by organizing constraints in advance in supply planning.
Decide what to decide first: Executive S&OP decision items
Examples of decision items on the monthly agenda
The first thing to build in S&OP implementation is not a system screen. It is the list of items the Executive S&OP decides every month. For a Japanese-affiliated plant in Thailand, candidates could include the following.
| Decision item | Typical options | Decided by (example) |
|---|---|---|
| Allocating demand that exceeds capacity | Which customers and items to supply first | President or plant manager, sales director |
| How to absorb demand peaks | Build inventory in advance / cover with overtime and holiday work / outsource | Plant manager, production control director, head of accounting |
| How to respond to demand troughs | Reduce production / build ahead as inventory / pull forward other items | Plant manager, production control director |
| Linking with promotions and price increases | Whether to time price increases to spare supply capacity, or hold back promotions | President, sales director |
| Handling the gap against budget | Revise the budget, take measures to close the gap, or accept the gap | President, head of accounting |
| Advance procurement of materials | Whether to order long-lead-time materials before customer forecasts become firm | Production control director, head of purchasing |
| Launching new products and replacement items | By when to use up old-item inventory, and when to switch over | Plant manager, sales director, head of engineering |
Once this list exists, the role of the Pre-S&OP becomes clear. The Pre-S&OP is the meeting that selects only the items on this list that need a decision this month, and prepares 2 to 3 options for each, along with the quantity and value for each option.
See which stage your S&OP is at
According to an article in Consumer Goods Technology, Gartner presents a 5-stage S&OP maturity model. The stage names are Stage 1 React, Stage 2 Anticipate, Stage 3 Integrate, Stage 4 Collaborate and Stage 5 Orchestrate. In the article’s summary, Stage 1 is an informal process with no shared S&OP goals, Stage 2 has a formal process owned by the supply chain function but is still reactive, and Stage 3 is the stage at which volume plans and financial plans are aligned (Gartner’s original material is paid, so only the summary from this secondary source is introduced here).
A plant like the one described at the start, with separate Excel files by department and meetings that end with reconciling numbers, is in many cases close to Stage 1. The first goal is Stage 2, where the cycle runs every month with a fixed procedure. Stage 3, where quantity and value are viewed on the same table, is the next goal after that. Climbing one stage at a time is more reliable than aiming for a higher stage right away.
Note that no primary survey of S&OP adoption rates or maturity limited to Southeast Asian manufacturers or Japanese-affiliated companies in Thailand was found in the research for this article. Rather than comparing with other companies, it is more practical to check whether your own plant has moved up one stage since last month.
Build one number: product family x month x quantity and value
Agree at product family level, not SKU level
The one number in S&OP is not a number per item (SKU). A plant with 1,500 items cannot discuss 1,500 rows in a monthly meeting. In S&OP, items are grouped into product families, and agreement is reached at that level.
In practice, the criterion for defining product families is whether they share the same supply-side constraints. Examples are plastic parts made on the same group of injection molding machines, metal parts made on the same press line, or boards that go through the same mounting line. Defined this way, it is immediately clear which equipment will run short if a product family is increased by 20%. Views by customer or by application can simply be kept as layers below the product family.
The basic form of one number is product family x month x quantity and value. Quantities are used by production control and purchasing, and values by accounting and management. Being able to convert between quantity and value on the same table is the first step in moving from PSI planning to S&OP.
Planning horizon: period, freeze and review
The time axis also needs to be decided at the outset. For example:
- Planning period: from the end of the freeze window to 18 months ahead (a rough guide in this article; the core period for management decisions is 3 to 18 months ahead)
- Freeze window: the next few weeks are not changed in S&OP (they are handled by change approval rules)
- Review frequency: once a month, the whole period is reviewed on the same calendar
- Granularity: monthly for the next 3 months, monthly or quarterly beyond that
Applying for BOI maximum stock requires a 6-month export forecast (see below). Keeping monthly quantities for at least 6 months ahead therefore makes the numbers easier to use when preparing the application as well.
Keep targets and expected figures separate
As mentioned under reason 2, sales numbers are held on separate rows for targets and expected figures. On the table, a layout like the following is easy to understand.
- Budget (target): the revenue target set at the start of the year; as a rule, it is not changed during the term
- Demand plan (expected): the quantity that is actually likely, reviewed every month
- Gap: expected minus budget; this gap becomes the issue on which the Executive S&OP decides whether to close it or accept it
Production and material plans use the expected figures, not the targets. The gap against the target is shown openly on the table and discussed.
Layering customer forecasts, firm orders, statistical forecasts and sales judgment
The expected figures in the demand plan are built by layering several sources of information by period.
| Period | Main information sources | How to treat them |
|---|---|---|
| Near term (inside the freeze window) | Firm orders, order backlog | Treat as fixed quantities |
| 1 to 3 months ahead | Customer forecasts, scheduled quantities received via EDI | Use customer forecasts as the base and correct them based on past gaps between forecasts and actuals |
| 4 months ahead and beyond | Statistical forecast, sales judgment (new projects, lost business, impact of price increases) | Use the statistical forecast as the base, with Sales overriding it with stated reasons |
Managing firm orders and the order backlog is covered in Manufacturing Order Backlog Management in Thailand: Partial Shipments and Promise Dates, and receiving customer forecasts via EDI is covered in Manufacturing EDI in Thailand: 90-Day PoC, Cost & RFP. At plants where customer forecasts arrive as PDFs or emails that are keyed in by hand, starting with how forecasts are received makes a big difference to the time spent on demand planning.
Demand planning: statistical forecasts, sales overrides and measurement
Use the statistical forecast as a draft, and let Sales override it with reasons
The basic flow of demand planning is to build a draft with a statistical forecast, have Sales add its judgment on top, and finally reach agreement (consensus) among the people involved. For sales overrides, set a rule that each one comes with a one-line reason, such as “Customer A told us the launch of its new car model will be delayed by 2 months” or “Customer B is not accepting the price increase and is expected to move part of the volume to another supplier”. If the reason is recorded, you can look back later and see whether the override was right.
The forecasting model itself (which method to use, whether to use AI) is covered in detail in Demand Forecasting AI ROI for Thai Factories – MAPE and Payback. This article focuses on the procedure for turning a forecast into a number used in the meeting, and on how to measure it.
Measure forecast accuracy with at least 2 kinds of indicators
If the demand plan is run every month, its accuracy should be measured every month. Without measurement, the argument based on impressions continues: “Sales’ outlook is always high”, “No, production control is too cautious”. The main indicators are as follows.
| Indicator | What it shows | Points to note |
|---|---|---|
| MAPE (mean absolute percentage error) | The size of the error between forecast and actual, averaged as a percentage of actuals | Can be compared regardless of units. However, it cannot be calculated when actuals are 0 and gives extreme values when actuals are close to 0. The weighting is skewed depending on the direction of the error (asymmetry) |
| WMAPE (weighted mean absolute percentage error) | MAPE with errors weighted by sales volume | Errors on high-volume items count more heavily, so it suits checking accuracy across a whole product family |
| Bias (tracking signal) | The tendency of a forecast to be consistently too high or too low | 0 means no bias. A forecast is considered out of control when the tracking signal exceeds ±4.5 |
| FVA (Forecast Value Added) | How much each step or participant in the forecasting process changed accuracy | A naive forecast (for example, using last month’s actual as this month’s forecast) is used as the baseline for comparison |
The properties of MAPE are based on the textbook Forecasting: Principles and Practice (3rd edition) by Hyndman and Athanasopoulos. As an alternative for cases where actuals are 0 or close to 0, the book points to scaled errors normalized by a naive forecast (MASE). At plants with many items, where some items have zero shipments in a given month, WMAPE by product family is likely to be easier to work with than MAPE by item. The definition of WMAPE follows the glossary of the Institute of Business Forecasting & Planning (IBF).
On bias, an Arkieva article explains that a forecast is out of control when the tracking signal exceeds ±4.5. The same article says that with a 12-period normalized forecast metric (NFM), a value above +2 indicates an over-forecasting bias and a value below −2 indicates an under-forecasting bias. Accuracy (the size of the error) and bias (the direction of the error) are different things. Even if errors are small, if they lean in the same direction every month, inventory gradually builds up or stockouts gradually increase.
Do overrides by Sales or the meeting actually improve accuracy (FVA)
Michael Gilliland of SAS describes FVA as the change in a performance metric (such as MAPE) that can be attributed to a particular step or participant in the forecasting process. In practice, you keep the numbers from each stage (the naive forecast, the statistical forecast, the forecast after the sales override and the forecast after agreement in the meeting) and compare their errors. If the error is larger after the sales override, that override reduced accuracy.
An IBF blog post (2014) describes a study of 8 supply chain companies in which 52% of forecasts were worse than a simple random walk (naive forecast). However, this is a small sample of 8 companies, and the details of the original study could not be confirmed. The figure cannot be generalized, but the possibility that a forecast built with a lot of effort can lose to a forecast that does nothing is worth measuring in your own plant.
There is no need to measure everything from the start. For the first 3 months, produce just 2 indicators every month: WMAPE and bias by product family. That alone shifts the discussion in the meeting from impressions to numbers.
Supply planning: capacity, materials, inventory policy and BOI
Capacity: hold equipment, people and shifts at product family level
In supply planning, the plant checks, product family by product family, how much it can actually make against the demand plan (the unconstrained numbers). What is needed is monthly capacity per product family. The number of machines and operating hours, headcount and shifts (2 shifts or 3, and how much holiday work is allowed), and the number of molds and jigs are summarized at product family level.
When a month that exceeds capacity is found, the gap is turned into options such as building ahead in the previous month, increasing output with overtime and holiday work, outsourcing, or limiting supply and adjusting with the customer, and these options are raised to the Pre-S&OP. What matters is that the supply planner does not carry the problem alone but passes it to management as options.
Materials: lead times and MOQ
For materials, lead times and minimum order quantities (MOQ) are the constraints. Resin raw materials and electronic components procured from overseas can have lead times of several months. In that case, whether to order before customer forecasts become firm is itself a decision item for the Executive S&OP.
The product family quantities decided in S&OP are expanded to item and material level in the MPS (master production schedule) and MRP (material requirements planning). At this point, if the BOM (bill of materials) or lead time master data is out of date, wrong orders will be issued even when the monthly agreement is correct. How to keep master data fresh is covered in MRP System 2026: What Stops It Is Master Data Freshness, Not the Engine.
Inventory policy: decide how much to hold for each product family
Inventory is the buffer between demand swings and supply constraints. For each product family, decide as an inventory policy how many days of finished goods to hold and which items to shift toward make-to-order. The calculation of safety stock and reorder points is covered in AI Inventory Optimization | Safety Stock and Reorder Points, and the mechanisms for preventing stockouts in Stockout Prevention System 2026: Five-Layer Factory Design. In S&OP, rather than the details of the calculation, focus on deciding policies such as “reduce finished goods inventory for this product family by a certain number of days from next month” and checking the impact in quantity and value.
BOI maximum stock and the 6-month export forecast
At plants that import raw materials for export production under incentives from Thailand’s BOI (Board of Investment), supply planning has one more constraint. According to BOI Announcement Por. 3/2556 (unofficial English translation), for the import duty exemption under Section 36, the maximum stock is the quantity of raw materials for which the duty exemption is granted. When applying for approval of the production formula and maximum stock, the plant is to submit a forecast of the quantity of finished products for export for 6 months, based on the total production capacity in the BOI certificate or on customer orders, together with a list of maximum stock quantities for each raw material.
In other words, the BOI maximum stock application is premised on a demand plan (the export outlook) in the first place. If the S&OP one number holds monthly export quantities for 6 months ahead, it also becomes easier to use as the basis for the application. In addition, BOI explanatory material recommends downloading the MML (Material Master List) every 6 months to reconcile BOI inventory records with the company’s actual inventory. Write-off in RMTS and the design of internal systems are covered in detail in BOI Raw Material Inventory in Thailand – RMTS Write-Off and Max Stock by Design.
Note that this article is not legal advice or advice on BOI procedures. Please check the latest requirements and the conditions of your own certificate with the BOI or with specialists.
Songkran reduces working days in April
Something that must not be forgotten in supply planning at Thai plants is the uneven distribution of working days caused by public holidays. In the 2026 Thai holidays (the financial institution holidays published by the BOT), Songkran falls on April 13 to 15 (Monday to Wednesday), which connects with the weekend to form 5 consecutive days off. April also has Chakri Memorial Day on the 6th, so holidays are concentrated and working days decrease. Other holidays include May 1 and 4, June 1 and 3, July 28 and 29, August 12, October 13 and 23, and December 7, 10 and 31.
If monthly capacity is held on the assumption that every month has the same number of working days, capacity will fall short in April alone. In supply planning, the number of working days in each month needs to be reflected in capacity, and whether to build ahead before April or shift April shipments earlier or later needs to be decided in an S&OP cycle before March. Holiday calendars differ from company to company, so check against your own company calendar.
Pre-S&OP and Executive S&OP: how to run the meetings
Pre-S&OP: pick up only the exceptions and build options
The Pre-S&OP is a preparatory meeting of section-manager-level practitioners. It does 3 things.
- Compare the demand plan with the supply plan and pick up only the product families that diverge (exceptions)
- For each exception, build 2 to 3 options and lay out the quantity and value of each option (revenue, inventory value, additional cost)
- Decide the agenda and recommendations for the Executive S&OP
Product families that do not diverge are not put on the agenda. Going through on-plan product families one by one turns the meeting back into a reporting session. This is exactly the idea behind Oliver Wight’s description of IBP as an exception-driven review that focuses on what has changed since the previous plan.
Executive S&OP: decide and record
The Executive S&OP is a 1 to 2 hour meeting attended by the president or plant manager, the department heads and the head of accounting. Here is an example of how it can run.
- First 5 minutes: check the status of last month’s decisions and action items
- Next 15 minutes: check the overall numbers (total revenue outlook across product families, inventory value, gap against budget)
- Main part: for each agenda item prepared by the Pre-S&OP, choose one of the options
- Last 10 minutes: read out and record the decisions, action items, owners and deadlines
For the record, a decision log is more useful than meeting minutes. If the date, agenda item, chosen option, reason, owner and deadline are kept on one line, they can be checked at the start of the following month, and 6 months later the team can look back and ask whether the decision to build inventory was right.
Connecting with finance
To keep S&OP from ending up as a quantity-only meeting, it is important for accounting to take part from the start. In a survey conducted by Oliver Wight Americas in 2015 at the IE Group S&OP Innovation Summit in Boston (the number of respondents was not disclosed), 45% of S&OP practitioners said that financial controls, including inventory valuation and disclosure, were not adequately considered in S&OP/IBP, and only 28% said their financial controls were fully aligned with financial targets. In addition, 51% said they had not built SOX requirements into S&OP/IBP. Because the survey is old and the sample size is unknown, these percentages cannot be applied as they are to companies today. What they do show is that the difficulty of connecting quantity plans with finance was pointed out some time ago.
At Japanese-affiliated plants in Thailand, accounting is often too busy with the monthly closing and reporting to the parent company in Japan to attend S&OP meetings. Even then, have accounting at least prepare a unit price table for converting product family quantities into values, so that the Pre-S&OP can produce inventory values and the revenue outlook.
Fitting the monthly calendar to a Japanese-affiliated plant in Thailand
Work backward from the month-start closing of actuals
The 5-step calendar is built by working backward from the closing of actuals at the start of the month. Step 1 cannot begin until last month’s shipment, production and inventory actuals are closed. First, check how many days it takes to adjust warehouse stocktaking differences and to record work in process. At a plant where closing actuals takes a week, shortening it becomes the first improvement theme for S&OP.
Misalignment with the Japanese parent company’s closing is an issue to check
Japanese-affiliated plants in Thailand have one more specific circumstance. The closing for the Japanese parent company’s monthly plan and budget may not line up with the closing of the local S&OP. The submission date for monthly reports to the parent, the schedule of the parent’s production and sales meetings, and the timing of budget revisions differ from company to company. No primary statistics or surveys on this point were found in the research for this article.
For that reason, they are listed here as issues each company should check.
- Is the monthly report to the parent company submitted before or after the Executive S&OP?
- At which step of the local demand plan are sales plans from the parent company (intra-group transactions) taken in?
- When the budget is revised, can the S&OP expected figures be used as they are?
- Taking the time difference with Japan into account, when can the parent company join online?
A situation in which what was decided in the Executive S&OP is overturned at the parent company’s meeting the following week is best avoided. The realistic approach is to lean one of 2 ways: hold the Executive S&OP just before the parent company’s meeting, or have the parent company’s person in charge attend the Executive S&OP.
Language and division of roles
At Thai plants, the language of the materials also needs to be decided. It is common for site planners to work in Thai, Japanese executives in Japanese, and communication with the parent company and group companies to be in English. The approach with the least rework is to label table items in Thai and English (and Japanese if needed), keep one table of numbers, and prepare only the explanatory text in each language.
The division of roles can be decided along these lines, for example.
| Department | Main role | Cut-off (example) |
|---|---|---|
| Sales and sales administration | Demand plan (expected figures) and reasons for overrides, taking in customer forecasts | Step 2 cut-off date |
| Production control | Supply plan, capacity checks, secretariat for the whole S&OP | Step 3 cut-off date |
| Purchasing | Material lead times, MOQ, whether advance procurement is needed | Step 3 cut-off date |
| Warehouse | Closing inventory actuals, stocktaking differences, storage space | Step 1 cut-off date |
| Accounting | Converting between quantity and value, gap against budget, inventory value | Day before step 4 |
| Management (president, plant manager) | Decisions in the Executive S&OP | Step 5 |
The secretariat is often run by production control or corporate planning. The secretariat’s job is not to create the numbers. It is to make people keep the cut-off dates, pick up the exceptions and manage the decision log.
Choosing tools: 3 stages
Stage 1: Excel, BI and PSI visualization tools
The first stage is building one number with Excel or BI (dashboards). The departments’ Excel files are consolidated into one shared workbook, or into a combination of a database and BI, so that everyone sees the same table of product family x month x quantity and value.
Among Japanese products, there are also tools whose main purpose is PSI visualization. According to an article in Impress’s IT Leaders, Hitachi Solutions East Japan announced a SaaS edition of SynCAS PSI Visualizer on February 5, 2026, with availability planned for March 2026. According to the company’s announcement, it offers multi-angle visualization of inventory status, prioritization of inventory risks through alerts and automatic calculation of inventory aging, and it has been adopted by more than 200 companies in manufacturing and distribution since its launch in 2010 (all vendor claims). Pricing is a monthly fee based on the volume of data used, with a minimum of 3 licenses, but the amount has not been disclosed.
According to an article in Cloud Watch, transcosmos announced trans-scManager on April 14, 2026, saying it forecasts demand from past shipment actuals, evaluates the supply and demand balance and derives inventory replenishment quantities. It is said to use SynCAS PSI Visualizer for PSI visualization (vendor claims; pricing not disclosed).
Stage 2: Demand planning and MPS built into ERP
The next stage is using the demand planning and MPS functions built into the ERP that is already in use or planned for implementation.
- Odoo 19 Master Production Schedule (MPS): According to the official documentation, it proposes replenishment quantities based on demand forecasts and inventory targets that can be adjusted manually (purchase orders and manufacturing orders are created by the user and are not issued automatically). Forecasted Demand is entered in a grid by period (day, week, month or year), and the projected inventory is calculated as opening inventory minus forecasted demand minus forecasted indirect demand plus replenishment. Edition requirements are not stated on the page.
- Oracle NetSuite Demand Planning: According to the Help Center, it provides demand planning that estimates future demand from sales history on a monthly, weekly or daily basis, and supply planning that takes lead times and safety stock into account (suggesting purchases and work orders). The forecasting methods are linear regression, moving average, seasonal average and sales forecast (from opportunities, quotes and sales orders). Advanced Inventory Management must be enabled, and up to 10,000 items can be processed at a time.
- Microsoft Dynamics 365 Supply Chain Management Demand planning: According to the official documentation on Microsoft Learn, it offers no-code demand modeling, on-the-spot editing of aggregation and disaggregation from the whole company or product groups down to regions or SKUs, AI-based automatic parameter tuning, consideration of external signals such as promotions and stockouts, version history, comments with Teams integration and native integration with SCM. A per-user license is required for production use. For 2026 release wave 1 (features delivered from April to September 2026), the listed items include a demand planning capability that identifies correlations between sales prices and demand patterns. Note that Microsoft has announced that from September 2026 it will stop publishing Dynamics 365 release plans and move to the AI at Work roadmap.
All of these are vendor claims, and no prices are listed on the pages.
Stage 3: Dedicated planning platforms
When the number of items, sites and scenarios grows and the monthly cycle can no longer be run in Excel, it is time to consider a dedicated planning platform.
- SAP IBP: According to SAPinsider, release 2605 (May 2026) allows statistical forecast simulation inside Planner Workspaces, removing the need to go back and forth with Excel, and uses AI to show the impact of safety stock decisions on working capital. According to McCoy & Partners, release 2608 added AI-assisted scenario planning with Joule (instructing the scenario you want to build through a prompt) and Lead Time Intelligence in the inventory module (detecting changes in lead times and drafting master data updates that the planner approves or rejects).
- Kinaxis Maestro (formerly RapidResponse): The company’s S&OP page claims concurrent planning across all functions, unlimited and instant what-if scenarios, cross-functional collaboration and a link between long-term strategy and short-term operations. As a smaller entry point, it describes Planning One as delivering value with low risk, low cost and in a short time.
There are also many other planning products with S&OP or IBP functions. As a Japanese example, a sponsored article in MONOist introduces a case in which TOA implemented SAP IBP as its PSI planning system. It started in March 2023 and went live in January 2024, about 10 months later, changing the PSI planning cycle from weekly to daily and enabling inventory and sales plans for 4,000 products to be run at the same time (a vendor-side case study).
Comparing the 3 stages
| Stage | Examples (all vendor claims) | Suited to | Points to note |
|---|---|---|---|
| 1 Excel / BI / PSI visualization | Excel, BI, SynCAS PSI Visualizer SaaS edition, trans-scManager | The first year, while product families and the process are being settled | File version control, manual transcription errors |
| 2 Demand planning and MPS built into ERP | Odoo 19 MPS, NetSuite Demand Planning, Dynamics 365 SCM Demand planning | Plants that want to use ERP master data and order data as they are | Check how far product family hierarchies and value conversion can be supported |
| 3 Dedicated planning platform | SAP IBP (based on the 2605 and 2608 commentaries), Kinaxis Maestro | Large inventory, many items and sites, where scenario comparison is essential | Cost, implementation period, internal operating structure |
Prices are almost entirely undisclosed for every product. When comparing, it is essential to obtain quotes on the same assumptions (number of users, items, sites and implementation scope).
Look at AI functions alongside the fact that autonomy is still rare
Every vendor is putting AI functions front and center, but for now expectations need to be calibrated. According to a Gartner forecast (announced on September 24, 2026) reported by Modern Materials Handling, by 2030 only 5% of organizations that have deployed some form of supply chain planning automation will make at least 10% of their planning decisions autonomously. The survey covered 243 senior leaders (global) at organizations with annual revenue of USD 500 million or more, from November 11 to December 18, 2025. In the same survey, 83% had spent at least USD 3 million on supply chain planning automation (including AI). Gartner says that routine operational decisions such as replenishment and order prioritization have significant room for automation, while strategic decisions such as network design and inventory policy will continue to require human judgment.
That is the situation even at large companies. Rather than focusing on whether a tool has AI functions, the realistic approach is to first build a mechanism in which people decide every month, and to position AI as a tool that delivers inputs for those decisions faster. On June 24, 2026, Board announced a Supply Chain Agent that detects early signs of demand changes and performs trade-off analysis, and other products advertising AI agents are appearing as well (vendor claims).
Model calculation of costs and benefits (hypothetical figures)
Assumed plant and assumptions
This section estimates the costs and benefits of S&OP implementation with hypothetical figures. All of the figures below are hypothetical figures created for this article. They are not the prices of any real company or product. Use them as the shape of the formula when running your own calculation.
The assumed plant is a Japanese-affiliated automotive parts and electronic components plant in Thailand with about 1,500 items and about 40 customers. Today, sales, production control, purchasing, the warehouse and accounting each build plans in separate Excel files.
| Assumption | Value (hypothetical) |
|---|---|
| Average inventory (raw materials + work in process + finished goods) | 60,000,000 THB |
| Inventory carrying cost rate | 20% per year (hypothetical total of capital, storage and obsolescence) |
| Cost of absorbing plan changes (express shipments, holiday work and so on) | 1,500,000 THB per year |
| Time spent reconciling plan numbers (total for 5 departments) | 80 hours per month |
| Hourly rate | 300 THB |
2 configurations are compared.
- Configuration A (process first + Excel / BI): set up the decision items, the monthly calendar, product families and master data, and view one number on a BI dashboard
- Configuration B (a dedicated planning tool added on top of A): after completing configuration A, add a dedicated tool. It is evaluated by the difference from A (the additional cost and the additional benefit)
Configuration A: process first + Excel / BI
For configuration A, the initial cost is set at 800,000 THB (process design, organizing product families and master data, BI dashboard, training) and the annual cost at 150,000 THB.
There are 3 benefits.
- Benefit 1, inventory: reduce average inventory by 5%, that is, 3,000,000 THB. The carrying cost saving is 3,000,000 x 20% = 600,000 THB per year
- Benefit 2, cost of absorbing plan changes: reduce it by 30%. 1,500,000 x 30% = 450,000 THB per year
- Benefit 3, reconciliation time: go from 80 hours a month to 40 hours. The 40 hours saved x 12 months x 300 THB = 144,000 THB per year
The total benefit is 600,000 + 450,000 + 144,000 = 1,194,000 THB per year. Subtracting the annual cost of 150,000 THB gives a net benefit of 1,194,000 − 150,000 = 1,044,000 THB per year, and the payback period for the initial cost is 800,000 ÷ 1,044,000 ≈ about 0.8 years (about 9 months).
There is one caution here. Reducing inventory by 3,000,000 THB brings that amount of cash back once. However, this 3,000,000 THB is not included in the annual benefit. Including it would double-count it with benefit 1, the carrying cost saving (the capital and storage costs that no longer arise every year because inventory is lower). The annual benefit counts only the costs saved every year as long as inventory stays at the reduced level.
Configuration B: adding a dedicated planning tool (incremental)
For configuration B, the additional initial cost is set at 3,500,000 THB and the additional annual cost at 1,200,000 THB.
The additional benefits are as follows.
- Inventory: reduce it by a further 5% of the baseline 60,000,000 THB (3,000,000 THB). 3,000,000 x 20% = 600,000 THB per year
- Cost of absorbing plan changes: reduce it by a further 10% of the baseline amount (1,500,000 THB). 1,500,000 x 10% = 150,000 THB per year
- Reconciliation time: go from 40 hours a month to 30 hours. The 10 hours saved x 12 months x 300 THB = 36,000 THB per year
The total additional benefit is 600,000 + 150,000 + 36,000 = 786,000 THB per year. Subtracting the additional annual cost of 1,200,000 THB gives a net benefit for the addition of 786,000 − 1,200,000 = −414,000 THB per year. In other words, at a plant of this size, the dedicated tool addition loses money every year and does not recover its initial cost.
Sensitivity: a company with 3 times the inventory
What about a company whose average inventory is 3 times larger, at 180,000,000 THB? The additional inventory benefit of configuration B becomes 180,000,000 x 5% x 20% = 1,800,000 THB per year. The total additional benefit is 1,800,000 + 150,000 + 36,000 = 1,986,000 THB per year. After subtracting the additional annual cost, the net benefit is 1,986,000 − 1,200,000 = 786,000 THB per year, and the payback period for the additional initial cost is 3,500,000 ÷ 786,000 ≈ about 4.5 years.
For simplicity, this sensitivity calculation keeps the plan change cost benefit (150,000 THB) and the reconciliation benefit (36,000 THB) unchanged instead of scaling them with inventory size. In reality, companies with larger inventories also tend to have more items and sites, so these benefits may also be larger.
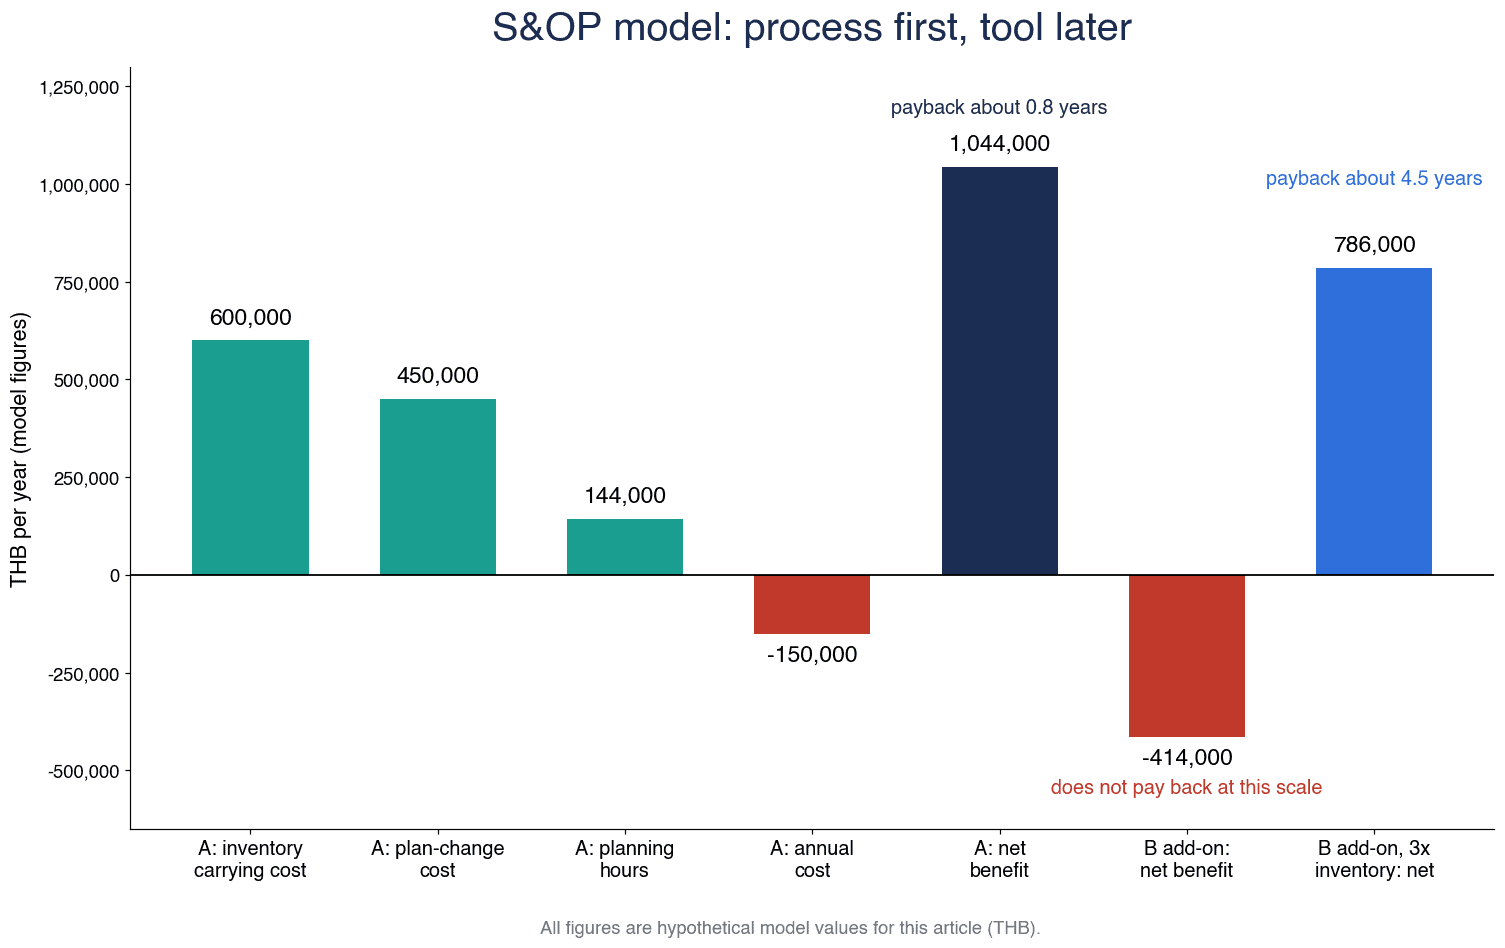
Summary of the calculation
| Item | Configuration A | Configuration B (incremental) | Configuration B (incremental, 3x inventory) |
|---|---|---|---|
| Initial cost | 800,000 | 3,500,000 | 3,500,000 |
| Annual cost | 150,000 | 1,200,000 | 1,200,000 |
| Inventory carrying cost saving | 600,000 | 600,000 | 1,800,000 |
| Saving in cost of absorbing plan changes | 450,000 | 150,000 | 150,000 |
| Reconciliation time saving | 144,000 | 36,000 | 36,000 |
| Total benefit | 1,194,000 | 786,000 | 1,986,000 |
| Net benefit (total benefit − annual cost) | 1,044,000 | −414,000 | 786,000 |
| Payback period | About 0.8 years (about 9 months) | Does not pay back | About 4.5 years |
(Unit: THB. Annual figures are per year. All figures are hypothetical.)
Figure 3 shows how configuration A’s benefit 1 of 600,000, benefit 2 of 450,000 and benefit 3 of 144,000, minus the annual cost of 150,000, add up to a net benefit of 1,044,000 (payback about 0.8 years). Alongside it are the net benefit of configuration B’s addition, −414,000, and the net benefit of configuration B’s addition with 3 times the inventory, 786,000 (payback about 4.5 years).
There is one conclusion to draw from this calculation. Most of the benefit of S&OP comes from the process (how decisions are made and one number). A dedicated tool is something to consider once inventory size, the number of items and the number of sites are large and the monthly cycle can no longer be run in Excel.
Note that some benefits are not included in this calculation: lost sales opportunities and customer evaluations due to stockouts, the accuracy of BOI maximum stock applications, budget accuracy and the speed of management decisions. These are hard to express in money, but in practice they affect the implementation decision. When running your own calculation, it is a good idea to write them down qualitatively in a separate column.
Items to check in the RFP and demo
When you reach the stage of comparing dedicated tools or ERP planning functions, put the following items into the RFP (request for proposal) and the demo checklist. Ideally, the demo should use your own product families and monthly numbers (a few months’ worth) rather than data prepared by the vendor.
| Item | What to check | Example of what to see in the demo |
|---|---|---|
| Product family hierarchy and disaggregation | Whether hierarchies such as product family to item and customer group to customer can be held, and whether numbers entered at an upper level can be disaggregated to the lower level | Increase a product family total by 10% and see how the item-level numbers are disaggregated |
| Quantity and value conversion | Whether quantity and value can be switched on the same screen using a unit price table, and whether price revision dates can be held | See whether the revenue outlook changes automatically with the unit price after a price increase |
| Version control | Whether each month’s plan can be kept as a version and compared with the previous month’s version | Display the difference between last month’s version and this month’s version |
| Scenario comparison | Whether multiple options, such as building inventory or absorbing with overtime, can be laid side by side and compared | Show the inventory value and additional cost of 2 options side by side |
| Automatic calculation of forecast accuracy and bias | Whether MAPE, WMAPE, bias and FVA can be produced automatically by product family | Calculate the indicators from forecasts and actuals for the past few months |
| ERP / MRP integration | Whether the agreed numbers can be passed to MPS / MRP, and whether actuals can be taken in automatically from ERP | Have the vendor explain the integration method (API, file) and frequency |
| Thai / English UI | Whether screens, field names and reports support Thai and English | A planner operates the system on Thai-language screens |
| Permissions | Whether the scope each department can enter and view can be separated | See a setting in which Sales can edit only the demand plan and Purchasing only materials |
| Audit log | Whether who changed which number, when and why is recorded | Display the history of sales overrides and their reasons |
| Data import | Whether customer forecasts (EDI, Excel, CSV) and inventory actuals can be imported | Have the vendor import your own customer forecast file |
| License model | Whether licensing is per user or by number of items or data volume, and how view-only users are treated | Have the vendor quote 3 years of cost on the same assumptions |
IT Trend’s explanation also says that when choosing a PSI management system, you should check whether you need only inventory visualization or planning across the whole flow from demand to supply, whether you need monthly or daily planning, and whether it can integrate with your existing ERP and production management. These 3 questions are useful for deciding what you are choosing in the first place, before using the table above.
How to proceed: the first 90 days
S&OP implementation does not need to start with a tool. One way to proceed in the first 90 days is as follows.
Days 0 to 30: decide the decision items, calendar and product families
- Create the list of items the Executive S&OP decides every month (decision items)
- Decide the 5-step monthly calendar (cut-off dates, meeting dates, participants)
- Decide how to define product families (by units that share supply-side constraints)
- Decide to hold the budget (target) and the demand plan (expected figures) on separate rows
- Decide the secretariat (production control or corporate planning)
There is no need to buy software in these 30 days. What is needed is for the president or plant manager to declare that this meeting decides these things.
Days 31 to 60: run one number manually for 2 cycles
- Create one table of product family x month x quantity and value, and have all departments use the same table
- Actually run the 5 steps for 2 months on the calendar you decided
- Practice picking up exceptions in the Pre-S&OP and building 2 to 3 options
- Record the Executive S&OP decisions in the decision log
The first cycle will almost certainly not run smoothly. Problems will come up, such as actuals closing late, the sales outlook not arriving or the unit price table not existing. Finding them is the purpose of this period. In the second cycle, many of the problems decrease.
Days 61 to 90: measure accuracy and bias, and define tool requirements
- Start producing WMAPE and bias by product family every month
- Compare errors before and after sales overrides, and try out the FVA approach
- List the tasks that took time and the places where transcription errors occurred when running the cycle manually
- Based on that, decide the requirements for a tool (which of the RFP items in the previous chapter are essential)
At the end of the 90 days, use the decision log and the time records to decide which way to go: keep running in Excel for another 6 months, add BI, use the ERP’s planning functions or consider a dedicated tool.
Frequently asked questions
What is S&OP?
S&OP (Sales and Operations Planning) is a monthly decision-making process that aligns the demand plan and the supply plan into one plan, with management deciding the gaps that cannot be closed. It runs 5 steps (data gathering, demand planning, supply planning, Pre-S&OP and Executive S&OP) on a fixed calendar every month.
What is the difference between S&OP and PSI planning?
PSI planning is short-term, shop-floor-level planning that balances quantities of Production, Sales and Inventory. S&OP adds value (revenue, inventory value, costs) to quantities and is the forum where management makes decisions about the mid-term period (3 to 18 months as a rough guide in this article). The realistic order is to put PSI quantities onto the monthly S&OP cycle and then add value.
What is the difference between S&OP and IBP?
In Oliver Wight’s definition, IBP is a decision-making process that aligns strategy, portfolio, demand, supply and finance through monthly re-planning, planning on a rolling basis 24 months ahead and focusing on changes since the previous plan. S&OP is often a component of IBP, and IBP can be seen as S&OP extended to strategy and finance.
How long does S&OP implementation take?
For launching the process, as shown in this article, the first 90 days are enough to decide the decision items, calendar and product families, run 2 cycles manually and start measuring accuracy. The implementation period for a dedicated tool varies greatly with scope and the number of items. A vendor-side case study describes a PSI planning system on SAP IBP that went live in about 10 months.
Can we start with Excel?
Yes. In fact, Excel or BI is often enough at the first stage. In this article’s model calculation (hypothetical figures), most of the benefit also came from the process and one number. When Excel can no longer keep up, what exactly it cannot handle at that point becomes the tool requirements themselves.
Who attends demand and supply balancing meetings?
The Pre-S&OP is attended by section-manager-level practitioners from sales administration, production control, purchasing, the warehouse and accounting. The Executive S&OP is attended by the president or plant manager, the heads of sales, production and purchasing, and the head of accounting. If the people with decision authority are not at the Executive S&OP, decisions end up being carried over.
How should we choose a PSI planning system?
First, check whether you need only inventory visualization or planning across the whole flow from demand to supply, whether you need monthly or daily planning, and whether it can integrate with your existing ERP and production management. Then confirm items such as product family hierarchy and disaggregation, quantity and value conversion, version control, scenario comparison, automatic calculation of forecast accuracy and bias, and Thai and English UI in a demo that uses your own data.
Summary
- The core of S&OP implementation is not software. It is an agreement on who decides what, every month, based on which numbers.
- In Thai manufacturing, the direction of demand differs by industry and swings from month to month. There is good reason to review demand and supply on the same table every month.
- S&OP is a process that runs 5 steps (data gathering, demand planning, supply planning, Pre-S&OP and Executive S&OP) on a fixed monthly calendar.
- The 3 can be organized as stages: PSI planning balances quantities, S&OP makes management decisions on quantity and value, and IBP is planning that also covers strategy and finance.
- The typical failures are 3: no decision items, targets mixed with expected figures, and supply constraints not organized before the meeting.
- One number is built as product family x month x quantity and value. The budget (target) and the demand plan (expected figures) are held on separate rows.
- Start measuring forecasts with WMAPE and bias by product family, and check the effect of overrides with FVA.
- Supply planning reflects capacity, material lead times and MOQ, inventory policy, BOI maximum stock (the 6-month export forecast) and the fewer working days in April due to Songkran.
- In the hypothetical calculation, process-first configuration A paid back in about 0.8 years (about 9 months), while the dedicated tool addition did not pay back at an inventory size of 60,000,000 THB and paid back in about 4.5 years with 3 times the inventory.
- The sequence is: decision items and calendar, one number, measurement of accuracy and bias, and then tools.
We can help even at the stage before choosing a tool, such as organizing the decision items for your monthly meeting, designing product families and one number, or drafting RFP requirements for tools. If you are considering launching S&OP in a way that fits the realities of your plant in Thailand, please feel free to contact us through our contact form.
References
- Thai August factory output rises 4.44% y/y, beats forecast (The Star / Reuters)
- Thailand Industrial Output Growth Beats Forecasts (Trading Economics)
- Thailand Manufacturing Sector Hits 9-Month High (Trading Economics)
- Thailand Business Confidence Remains Subdued (Trading Economics)
- Thailand Export Growth Hits 7-Month High (Trading Economics)
- Thailand’s August car production rises 10.9% on year (Capital.com / Reuters)
- Thailand car production rises 6.1pct on year in July (New Straits Times)
- Thai auto sector facing crisis unless EV policy is overhauled, industry groups warn (MarketScreener / Reuters)
- Thailand-US trade surges as both sides move closer to tariff deal (The Nation)
- Thailand placed in Tier 2 of US transshipment report (The Nation)
- What is sales and operations planning (S&OP)? (TechTarget)
- Five Essential Steps of Sales and Operations Planning to Achieve an Integrated Business Plan (SAPinsider)
- Integrated Business Planning eBrochure (Oliver Wight Americas)
- Climbing the Sales & Operations Maturity Ladder (Consumer Goods Technology)
- Connecting management and the shop floor with S&OP to build a profit-generating mechanism (KPMG Japan, in Japanese)
- An explanation of PSI management systems (IT Trend, in Japanese)
- AI-based supply chain automation growing slowly (Modern Materials Handling)
- Why do many integrated business planning initiatives fail to live up to expectations? (Oliver Wight Americas)
- Demand planning home page (Microsoft Learn)
- Overview of Dynamics 365 Supply Chain Management 2026 release wave 1 (Microsoft Learn)
- SAP IBP 2605 release: Planner Workspaces (SAPinsider)
- SAP IBP 2608: what’s new in AI, Joule and supply planning (McCoy & Partners)
- Sales and operations planning (Kinaxis)
- Master production schedule (Odoo 19.0 Documentation)
- Demand Planning (Oracle NetSuite Help Center)
- Article on the SaaS edition of SynCAS PSI Visualizer (IT Leaders, in Japanese)
- Article on transcosmos trans-scManager (Cloud Watch, in Japanese)
- SAP IBP case study: PSI planning cycle from weekly to daily (MONOist, in Japanese)
- Forecasting: Principles and Practice (3rd ed) 5.8 Evaluating point forecast accuracy (OTexts)
- WMAPE: Weighted Mean Absolute Percentage Error (IBF)
- How To Measure BIAS In Forecast (Arkieva)
- Forecast Value Added: The Key to Managing the Business Forecasting Process (KMWorld)
- New IBF Blog Series: Forecast Value Added (FVA) (Institute of Business Forecasting)
- Announcement of the Office of the Board of Investment No. Por. 3/2556 (BOI, unofficial English translation)
- Well Management of BOI Incentives on Importing Machinery and Raw Materials (BOI)
- Full list of Thailand’s 2026 public holidays (HRO)
- Board introduces Supply Chain Agent and Merchandiser Agent (AAP / Cision)


