


In peak season, the shipping area runs out of returnable containers (totes). Staff have no choice but to repack products into cardboard boxes, and the customer says, “Next time, please use the returnable containers.” At the once-a-year stocktake, the count does not match the books, and the shortfall is covered by buying more containers. This is a familiar scene at factories in Thailand that start looking at a returnable container management system. It is not unusual at Japanese-affiliated automotive parts, electronic components, plastic molding and metal processing plants around Ayutthaya, Chonburi, Rayong and the Bangkok area.
The biggest problem is that nobody can say right away, “How many containers of which type are we holding at which customer or supplier right now?” The containers are not inside the factory. They are in the receiving area of the customer’s plant, in a supplier’s warehouse, or on a carrier’s truck. No matter how hard you search inside your own factory, you will not find them.
This article is a practical guide for logistics managers, warehouse, purchasing, production control, sales administration and IT staff at such factories. It sets out, for building a system to manage returnable containers, “what to record, how to reconcile, what to read containers with, which system to use, how to compare options and how to proceed.”
First, here is the main argument of this article.
The purpose of a returnable container management system is not “finding containers.” It is to hold, as numbers, the container balance held at each business partner and the cycle time in days it takes for a container to go around once and come back.
There are three typical reasons why containers run short.
- (1) Nobody holds the container balance per business partner (cumulative shipped minus cumulative returned, plus or minus adjustments)
- (2) Return deadlines, the number of days a container may be kept free of charge, and the rules for charging lost containers have not been agreed with customers and suppliers
- (3) The number of containers owned is set from the “average cycle time,” and the slow-returning containers (the upper side of the distribution) are not looked at
That is why you decide how to reconcile and what the rules are before discussing the identification method, such as whether to use QR codes or RFID. The illustrative calculation later in this article also shows that what decides the payback is not the identification method but two things: your own measured loss, and whether you can avoid buying more containers by shortening the cycle time.
Note that this article does not recommend or rank any specific product. It is also not legal, customs or radio-regulation advice. The topics of Thai customs duties and radio rules are presented as “points to check,” and you should confirm the latest requirements with your customs broker and the competent authorities (Thai Customs, NBTC). All quantities, amounts, hours and costs in the calculation are hypothetical figures made up for this article.
Why review returnable container management now
When production is growing, shortages and containers stuck at customers tend to surface
Recent figures for Thai manufacturing show that output and orders are growing. According to a Reuters report, the Manufacturing Production Index (MPI) of Thailand’s Ministry of Industry rose +4.44% year on year in August 2026, above the +1.0% market forecast in a Reuters poll. However, the Ministry revised the MPI calculation method at that time, for example by adding new electronic products and changing the weights. Figures from August 2026 onward cannot be compared simply with the old series.
The S&P Global Thailand Manufacturing PMI was 54.3 in September 2026 (53.8 in August), the highest level since December 2025. According to Trading Economics, output expanded at the fastest pace in 9 months, and new orders were the strongest in 6 months.
We cannot say that these figures are causing the container shortage. However, when shipments increase, the number of containers used per day increases. If the cycle time stays the same, the number of containers needed rises in proportion to shipment volume. “Containers that pile up at the customer’s plant and never come back,” which were invisible in quieter periods, tend to surface as shortages when production is growing.
The EU packaging regulation may reach you first through European customers
The other development is the EU Packaging and Packaging Waste Regulation (Regulation (EU) 2025/40, PPWR). According to the EU Official Journal, this regulation has applied since August 12, 2026. For transport packaging, it is scheduled to require, from January 1, 2030, that economic operators using transport packaging such as pallets, plastic boxes, trays and crates within the EU ensure that at least 40% of that packaging in total is “reusable packaging within a re-use system.” From January 1, 2040, they are to endeavour to reach at least 70%. For transport between sites of the same operator and similar cases, it is scheduled to require reusable packaging from January 1, 2030. Of this, pallet wrappings and straps used by certain operators were exempted from the 100% re-use requirement for transport between sites and similar cases by a Commission Delegated Decision (Delegated Decision (EU) 2026/429) published in the Official Journal in May 2026. They were not exempted from the 40% target. Cardboard boxes and similar items are stated to be outside the scope of these requirements.
In addition, an annex to the regulation requires a re-use system to have reporting rules that give access to data such as the number of rotations, rejects, the collection rate (return rate), the number of reusable packaging units added to the system, and the number discarded.
The scope needs care. The PPWR is a rule for transport packaging within the EU, and it does not apply directly to the returnable containers of a factory in Thailand. In this research, we also could not confirm from primary sources that Thailand has introduced a similar obligation. However, factories that export to the EU, or that trade with European customers that have sites in the EU, may receive it first as a customer procurement requirement in the form of “Can you aggregate rotations and return rates?” If you are building a system to record returnable containers, being able to hold those items from the start will save trouble later.
What returnable container management is: the loop a container goes around
The loop
Managing returnable containers starts with recording, stage by stage, the loop from when a container leaves the factory to when it comes back.
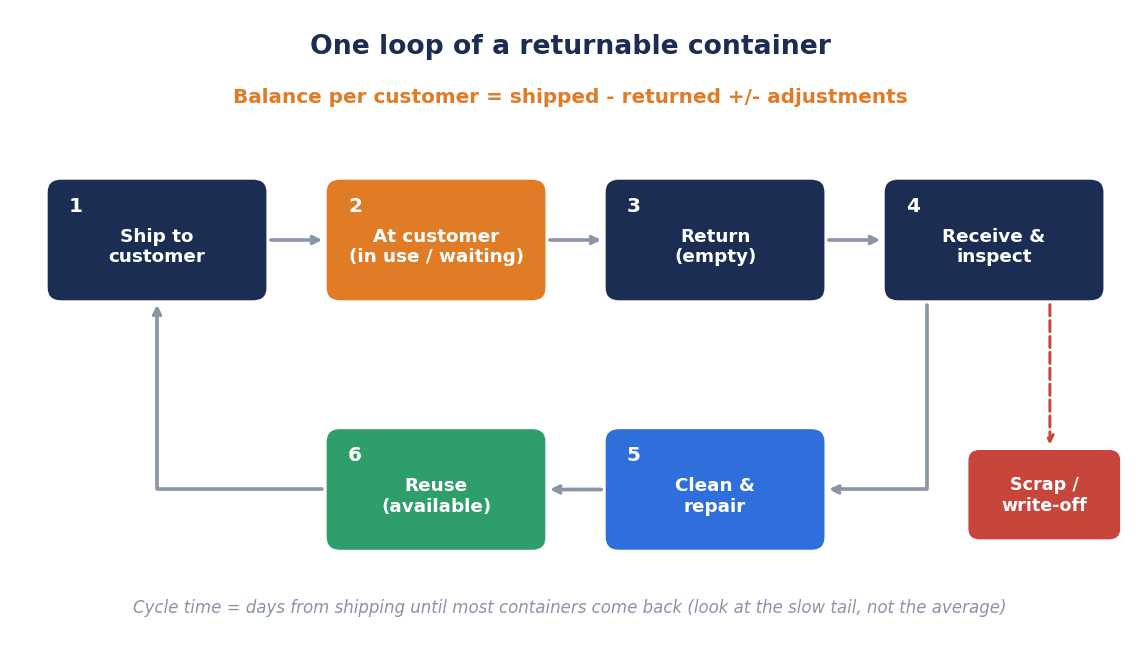
- Ship: send containers filled with products to the customer or to the business partner handling the next process
- Use and dwell at the customer: the contents are used at the customer’s plant and the empty containers wait to be returned
- Return: the empty containers come back, for example on a carrier’s truck
- Receive and inspect: check the number and type of returned containers and look for damage and dirt
- Clean and repair: wash them if needed and fix cracks and deformation
- Reuse: send them to the next shipment as usable containers
Containers judged unusable at inspection go to scrap. Within this flow, if you count “the number shipped” and “the number returned” for each customer or supplier, the difference is the number held at that business partner, in other words the container balance.
| Stage | Where the container is | What to record | What happens if the record is missing |
|---|---|---|---|
| Ship | From your shipping area to the business partner | Business partner, container type, quantity, date and time | The starting point of the container balance disappears |
| Use and dwell at the business partner | Customer’s plant, supplier’s warehouse | (Cannot be recorded directly) | You do not know how many days containers have been sitting there |
| Return | Carrier’s truck | Returning business partner, type, quantity | The container balance does not go down, and the counts do not match the other party |
| Receive and inspect | Your receiving area | Number of good containers, number damaged, dirt | Unusable containers are counted as usable |
| Clean and repair | Washing area, repair area | Start and completion of cleaning and repair | “Containers that should be there but cannot be used” become invisible |
| Scrap | Scrap area | Number scrapped and reasons | The number owned on the books stays higher than the actual number |
Not the same as collecting empty containers inside the factory
When people hear “collecting empty containers,” some may think of the conveyance task of gathering empty containers that pile up beside the line inside the factory and sending them back. That is a matter of in-plant material handling design, covered in our article on empty-container return automation. This article deals with the part outside the factory, that is, the management of containers circulating between you and your customers and suppliers. The moment a container leaves your premises, you can no longer see it. That is exactly why you need a system of recording and reconciliation.
How GS1 classifies returnable containers
GS1, the supply chain standards body, calls transport materials that are used repeatedly, such as returnable containers and pallets, “RTI (Returnable Transport Items).” GS1’s logistics guideline (2013) divides RTIs into the following two groups.
- Returnable secondary packaging: totes, plastic crates and similar. The plastic returnable containers used at Japanese factories fall into this group
- Returnable handling equipment: pallets, roll containers, dollies, hanging racks and similar. Steel racks are close to this group
For both, the recommended identification key is the GRAI (Global Returnable Asset Identifier). Returnable primary packaging such as bottles and cans is not included in RTIs, and for trailers and ocean containers a different key (GIAI) is recommended rather than treating them as RTIs. The same guideline also says that RTIs are often managed by quantity as “fungible items” rather than as individual assets.
Three reasons containers run short
Reason (1): nobody holds the container balance per business partner
The first reason is that nobody holds the container balance for each customer or supplier. Shipment records are on shipping slips and return records are on notes at the receiving area, kept separately, and nobody calculates “cumulative shipped minus cumulative returned, plus or minus adjustments” for each business partner. In this state, even if thousands of containers are piling up at one customer’s plant, nobody notices. People notice only when the shipping area runs out of containers.
Reason (2): return deadlines and charging rules have not been agreed
The second is the lack of an agreement with business partners. Within how many days must containers be returned, until how many days may they be kept free of charge, and who bears the cost of containers that cannot be found? If this has not been decided, you have no basis for asking the other party to return containers, even if you know the container balance. The reluctance of “It is hard to ask a customer we depend on to give our containers back” is also the flip side of having no rules.
Reason (3): the number owned is set from the average cycle time
The third is deciding how many containers to own from the “average cycle time.” Even with the same average number of days, in reality some containers come back quickly and others do not come back for weeks. With a number owned that is based on the average, you will run short on some day by the amount of the slow-returning containers.
What research shows
These three points overlap with research outside Japan. A study by Johansson and Hellström of Lund University in Sweden (2007), based on a case of roll containers in the Swedish dairy industry and a discrete-event simulation, points out that RTIs are expensive, vulnerable to theft and essential to production and distribution, yet are often managed with low visibility, and as a result the number owned tends to be large and operating costs high. It then states that asset visibility can be expected to bring substantial cost savings, but that “visibility alone is not enough; appropriate management actions and continuous management attention are needed.” The authors themselves list the fact that the study is based on a single case and simulation as a limitation.
A 2010 study by the same authors, using a simulation based on a real case, states that the choice of control strategy has a large effect on investment and operating costs, and that RTI shrinkage can be controlled both by the choice of tracking system and by the choice of control strategy. It also presents a simulation method for estimating the number of RTIs needed under each strategy.
In other words, simply introducing reading technology does not bring containers back. The effect appears only once you decide who looks at the recorded data and how they act on it.
Split “loss” into three
There are three kinds of loss
“Containers have disappeared” can mean different things. In this article, we split it into the following three.
| Type | State | Main countermeasure | Example of how it is treated in the records |
|---|---|---|---|
| (1) Dwelling at a business partner | Held by a customer or supplier but not coming back | Container balance reconciliation and return deadline rules | Remains as container balance |
| (2) Location unknown | Nobody knows where it is (true loss) | Keep movement history and assign responsibility | Confirmed as a discrepancy in reconciliation and written off |
| (3) Damaged or scrapped | Unusable due to cracks or deformation | Records of inspection, repair and scrapping | Removed from the number owned by a scrap event |
If you lump these three together as “loss,” you will choose the wrong countermeasures. With (1), you can get containers back through reconciliation and rules with the business partner. With (2), the only option is to keep movement history and narrow down where they disappeared. (3) is a quality and repair issue, and what matters is keeping records and correctly removing them from the number owned.
No public cross-industry statistics on loss rates were found
So how many returnable containers typically go missing? Loss rates vary greatly by industry and operation, and in this research we could not find public cross-industry statistics with a clear survey body, country, industry and sample size. Various figures circulate online, but it is risky to use figures whose sources cannot be confirmed as a benchmark for your own decisions.
For this reason, this article recommends starting with your own measurements. Take stock once of the container balance at each customer and supplier and measure the gap against the books. That is the starting point for your own loss rate.
The “2%” in the Chalmers case is a scrap rate
One useful case is a master’s thesis (2019) from Chalmers University of Technology in Sweden. It studied the packaging flow of one Swedish automotive manufacturer (OEM, anonymous) and its suppliers. According to this thesis, the OEM’s annual scrap of packaging averaged 2% per year over the past 4 years.
The point to note here is that this 2% is a scrap rate, not a loss rate. In the table above, it corresponds to (3). The thesis says that the OEM does not charge for scrapped packaging, but does charge suppliers when they lose it. It also points out that there is great uncertainty about losses because the location of packaging is not known. This is the scope of one Swedish OEM and a 2019 master’s thesis, and the figure cannot be generalized to other industries or countries.
Minimum data model: what to record
Keep four tables
The minimum data a returnable container management system should hold consists of the following four.
| Data | Contents | Example | Points to note |
|---|---|---|---|
| Container master | Container types and, if needed, individual containers | Type = plastic container type A, individual = serial number | Decide first whether to count by type or track individually |
| Site and business partner master | The parties and places containers move between | Each plant of the 4 customers, your own warehouse, the washing area | Separate each plant, even for the same customer |
| Events | Shipping, receiving, returns, inspection, repair, cleaning, scrapping, stocktaking | On what date, how many type A containers were shipped to customer B’s plant | Also keep records of cancellations and corrections |
| Container balance | Cumulative shipped minus cumulative returned, plus or minus adjustments, per business partner and per type | Number of type A containers held at customer B’s plant | Keep the adjustments confirmed in reconciliation as history |
As a rule, the container balance should be calculated from events. If you run an operation where only the balance is overwritten by hand, you will later be unable to tell why it became that number.
Count by type or track individually
In GS1’s approach, containers can be identified on two levels: “type (class)” and “individual.” In GS1’s logistics guideline, the main purpose of the GRAI is to identify the type of asset, and assets of the same type get the same GRAI. If each one needs to be identified individually, an optional serial number must be added.
The GRAI format is defined as GS1 Application Identifier (8003) “N4+N14[+X..16].” A leading “0” (1 digit) is followed by 13 digits consisting of the GS1 company prefix, the asset type and a check digit, and then an optional serial number (up to 16 alphanumeric characters). For reference, the GIAI (8004), which identifies individual assets, has only a single element of up to 30 alphanumeric characters and no part that represents the type.
In practice, you do not need to track every container individually. One possible split is to manage large numbers of plastic containers by quantity per type and to track only expensive steel racks individually. Which to choose also relates to the choice of identification method later in this article.
The owner assigns the number
In the GS1 guideline, the GRAI is assigned by the owner of the asset. For returnable containers you designed yourself, you assign it; for containers circulated by a pool operator, the pool operator assigns it. If you use containers supplied by a customer, it is a good idea to confirm at the start whether you need to follow the customer’s numbering scheme.
Event design: what to record as “events”
Borrow the GS1 CBV vocabulary
You can name events freely, but if you share data between companies, it is convenient to align with GS1’s standard vocabulary, CBV (Core Business Vocabulary) 2.0 (ratified in June 2022). The CBV defines the names of business steps (bizStep) and dispositions used in EPCIS, the standard for sharing events. Event sharing between companies itself is covered in detail in our article on EPCIS 2.0 implementation. Here we focus on how to apply the CBV vocabulary to returnable container events.
| Your own event | Example CBV business step (bizStep) | Example disposition | Note |
|---|---|---|---|
| Shipping | shipping, loading | in_transit | Increases the container balance |
| Receiving returns | receiving, unloading | (Awaiting inspection) | Decreases the container balance |
| Inspection | inspecting | damaged or available | damaged if broken |
| Repair | repairing | available after repair | The CBV treats the state of being returned to use after repair as available |
| Cleaning | (Not in the standard vocabulary) | (Defined in-house) | Define as your own extension vocabulary |
| Storage | storing | available | Stored as usable stock |
| Stocktaking | cycle_counting | — | Serves as the basis for reconciliation |
| Scrapping | decommissioning, destroying | — | Removes from the number owned |
The CBV 2.0 document also contains examples related to returnable containers. For example, a scene in which a pallet pool operator finds a broken board and reads and records the pallet’s EPC is given as an example of damaged. It also states clearly that non_sellable_damaged in the old version was replaced by damaged in CBV 2.0, so that it can also be used for returnable assets that are not for sale.
Define cleaning in-house
We could not find a business step dedicated to cleaning (such as cleaning or washing) in CBV 2.0. If you need cleaning records, for example for containers carrying parts for food or pharmaceutical applications, you need to define it as your own extension vocabulary. Document the name and meaning so that you can explain it when sharing data with business partners.
Design cancellations and corrections up front
On the shop floor, input errors in shipped quantities and receiving another business partner’s containers by mistake will always happen. If, instead of overwriting events to fix them, you can record cancellation and correction events separately, you can later explain why the container balance became that number. This is one of the items you should always check in an RFP.
Reconciling container balances and agreements with business partners
Decide how often to reconcile
Calculating the container balance is not enough on its own. The balance on your books and the actual count held by the business partner will always drift apart. You need “reconciliation,” in which you regularly compare figures with the business partner and confirm the discrepancies.
In the Chalmers master’s thesis mentioned earlier (one Swedish OEM, 2019), one of the suppliers reconciled the number of containers in its own inventory with the number in the OEM’s IT system about 4 times a year. If the numbers did not match, they searched, and if the containers could not be found, they paid a fee. Compared with an operation in which discrepancies are first noticed at the once-a-year stocktake, discrepancies can be found while they are still small.
You may set the reconciliation frequency for each business partner. One possible split is monthly with customers holding large container balances and quarterly with small suppliers.
Free storage days and what happens when they are exceeded
The same thesis describes an agreement under which pallets and boxes could be kept for 21 days without a rental fee, special packaging such as racks for about 10 days less than that, and beyond that the number of extra days was paid for. The loss fee for racks was set higher than for pallets and boxes.
This is an example from one company in Sweden, and you do not need to copy it as is. However, a pattern of “free up to a certain number of days, then charges according to the number of days beyond that” gives business partners a reason to hurry returns. In Japanese business relationships, it may be difficult to bring up charges suddenly. Even then, simply agreeing first on a “target number of days for return” and sharing the number of containers that exceed it every month makes dwelling containers much more visible.
Use movement history to decide who is charged for losses
Who bears the cost of a lost container depends on where it disappeared. If there is a shipping record but no customer receiving record, it may have been lost in transit. If the customer received it but there is no return record, it is at the customer or somewhere beyond.
In a case in GS1’s logistics guideline, for pallets of a pool operator, the manufacturer can record the number of pallets the carrier picked up at loading, and the carrier can record the number delivered and the number of empty pallets collected. If you, the carrier and the business partner each record the count at each handover, you can narrow down where the gap arose.
The approach in Japan: specify in contracts who collects and who pays
A pallet standardization document from Japan’s Ministry of Land, Infrastructure, Transport and Tourism (MLIT) (November 2024) is also a useful reference. It promotes a rental model for operating standard-specification pallets and sets out the idea of specifying in sales contracts and rental contracts who handles sorting and collection and who bears the cost. Its roadmap also includes “appropriate implementation of measures to prevent pallet loss” and “appropriate return to the owner, etc. after use.”
This concerns pallets within Japan, and it is not a standard that applies directly to returnable containers in Thailand. However, when you draw up agreements with Japanese-affiliated business partners, the idea of “writing into the contract who collects and who pays” should be easy to use as a common language.
Put container quantities in shipping notices and EDI
The best way to make reconciliation easier is to include the container types and quantities in the data you share with business partners at every shipment. If you are connected with customers through advance shipping notices (ASN) or EDI, consider whether you can add fields for returnable container types and quantities there. How to proceed with EDI connections is covered in our manufacturing EDI implementation guide. If both sides have the same count at the time of shipment, reconciliation discrepancies are narrowed down to the return and receiving side.
Checking the count at the shipping area itself is probably done in the same place as outbound inspection of products in many cases. For how to decide reconciliation points, our article on shipping and receiving inspection systems is also a useful reference.
Cycle time and the number of containers you need
Look at the upper side of the distribution, not the average
To work out how many containers you should own, you need to know the number of days from when a container is shipped until it comes back, that is, the cycle time. What matters here is looking at the distribution, not the average.
A study by Cobb of Missouri State University in the United States (2016) presents a method for estimating, from RFID data, the probability distribution of the cycle time from when a returnable container is filled until it is filled next, and for estimating the period until most containers come back. It also reports that satisfactory results were obtained even without tagging every container. A study by Li and Cobb (2022) presents a method for forecasting, with seasonality taken into account, the distribution of the probability that containers filled in a given period come back within a given time, and for estimating the number of containers that will come back in the future.
The abstracts of these papers do not give specific numbers of days or return rates. What we want to borrow here is the idea of “looking at cycle time as a distribution” and “thinking in terms of the number of days until most containers come back.”
A rule of thumb for the number of containers needed
In this article, we organize a rule of thumb for the number of containers needed as follows. This is this article’s own framing, not a formula given in the papers above.
Containers needed ≈ containers used per day × cycle time in days (days until most containers come back) + safety allowance (for losses, containers under repair and dwelling containers)
If you plug the average into the cycle time, you are likely to run short by the amount of the slow-returning containers. Start by calculating from your own shipment and return records, for each business partner, for example, “how many days it takes for most of the shipped containers to come back.”
The number needed changes with how you manage
The study by Hellström and Johansson (2010) mentioned earlier presents a method for estimating by simulation how the number needed changes with the control strategy. Put another way, before buying more containers, there is room to consider whether you can shorten the cycle time.
Let us look at this with the hypothetical figures in this article. Suppose a Japanese-affiliated automotive parts plant in Chonburi province owns 10,000 plastic returnable containers and circulates them among 4 customers. The safety allowance is set at 10% (×1.1).
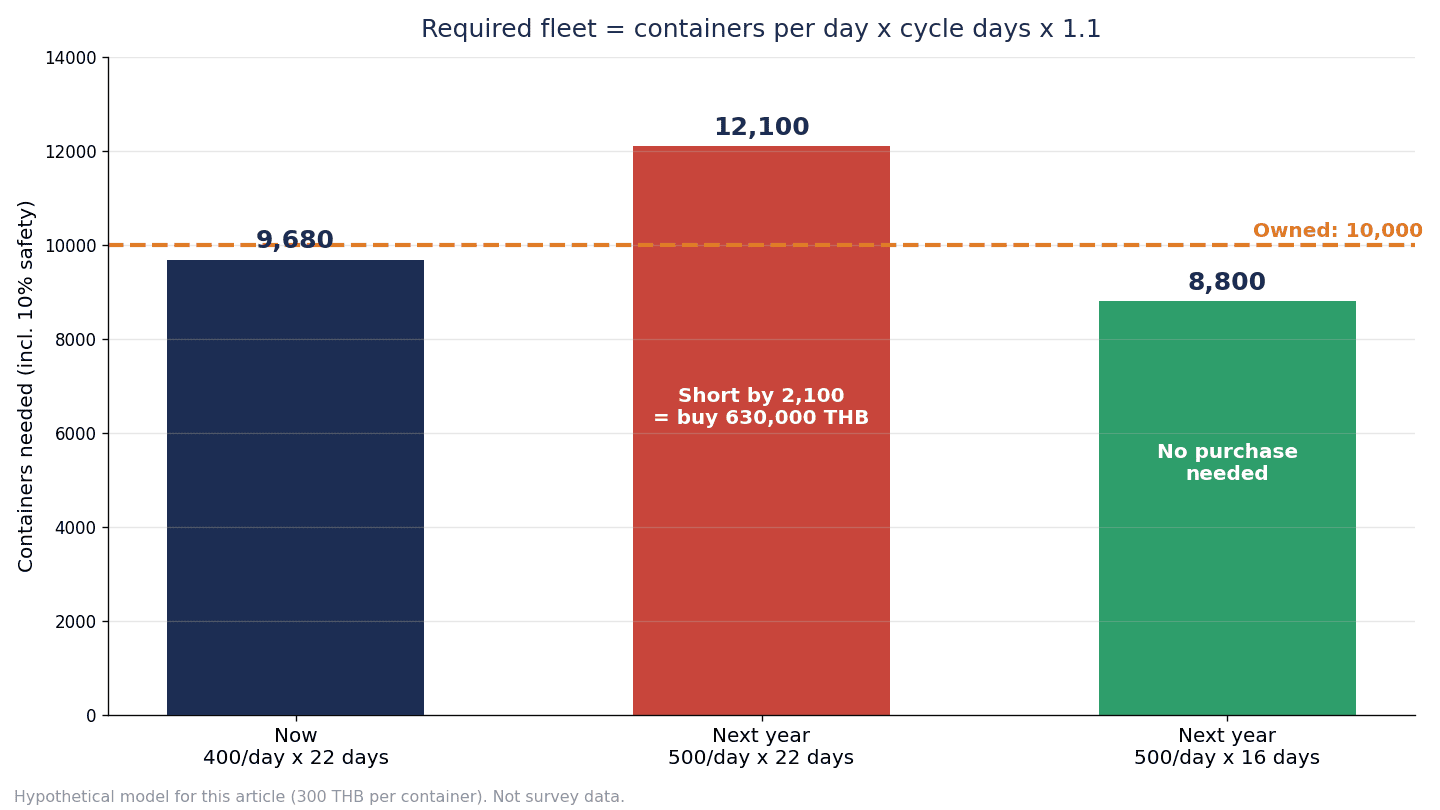
| Case | Containers used per day | Cycle time | Containers needed | Compared with the 10,000 owned |
|---|---|---|---|---|
| Current | 400 | 22 days | 400×22×1.1 = 9,680 | Enough |
| Next year (cycle time unchanged) | 500 | 22 days | 500×22×1.1 = 12,100 | 2,100 short |
| Next year (cycle time shortened to 16 days) | 500 | 16 days | 500×16×1.1 = 8,800 | Enough |
If shipments next year increase from 400 to 500 containers per day and the cycle time stays at 22 days, 12,100 containers will be needed, leaving a shortfall of 2,100. Assuming a replacement cost of 300 THB per container, the additional purchase is 2,100×300 = 630,000 THB. On the other hand, if the cycle time can be shortened to 16 days, the number needed is 8,800, and the current 10,000 containers are enough.
The figures are hypothetical, but the structure is common to many factories. When shipments are growing, it is worth thinking about “how many days it takes to get containers back” before “how many to buy.”
Choosing an identification method: QR, RFID or trackers
Three methods
Only now do we come to how to read the containers. There are broadly three identification methods for containers.
| Method | How it is read | Where it fits | Points to note |
|---|---|---|---|
| Container label + QR code (or barcode) | Read one at a time with a handheld terminal or smartphone | Managing every unit of a large number of plastic containers at low cost | Effort of reading one at a time. Dirty or peeling labels |
| UHF RFID tag | Read many at once with a gate or handheld | Many read points and a very large number of movements in and out | Reading can become unstable with metal, liquids and stacking. Testing in the real environment is a prerequisite |
| Trackers such as BLE and LPWA | A battery-powered device transmits its location | Expensive racks, or containers whose location outside the factory you want to know | Device unit cost and battery management |
According to GS1, the GRAI can be encoded both in barcodes and in EPC/RFID tags. Whichever you choose, you can manage containers with the same numbering scheme. How to choose codes to attach to products and parts is covered in detail in our article on traceability barcode selection. Here we focus on the viewpoint of “attaching codes to containers.”
Mixing methods is the reality
In practice, not every example standardizes on a single method. According to a case study published by Japan Pallet Rental (JPR) (Komatsu Logistics, information as of its publication in June 2020), Komatsu Logistics was described as having about 90,000 of its own metal returnable containers, in 200 types, used to supply construction machinery parts, in its responsible division alone. Its old system managed individual containers with RFID, but in order to manage all containers, it reportedly uses low-cost QR codes as the basis and RFID at overseas sites such as India. This is a case published by a vendor, and the information is as of 2020.
A blog post (October 2025) by Pozyx, a vendor of RTLS (real-time location systems), also says that tracking of returnable packaging is evolving toward methods that combine indoor and outdoor positioning with various wireless technologies, while passive RFID and barcodes continue to play a role at specific checkpoints. This, too, is the vendor’s own view.
The choice of method is determined by “at what unit you read every container” and “the environment at the read point (metal, stacking, outdoors).” For many factories, it is realistic to start from a mix in which every container is managed by quantity with QR codes, and RFID or trackers are used only for expensive racks or specific sites.
Cautions for RFID with metal, liquids and stacking
If you are considering UHF RFID, checking the reading environment is essential. According to a technical explainer (updated April 2024) by atlasRFIDstore, a seller of RFID equipment, liquids absorb the energy of radio waves so that tags respond less readily, and metal reflects radio waves, detuning the characteristics of the tag antenna or creating places where tags cannot be read. While listing countermeasures such as on-metal tags and leaving a gap between the tag and the liquid, it states that “a tag completely enclosed in metal cannot be read” and that “there is no guarantee it will work consistently; testing is key.”
For steel racks, metal returnable containers, and plastic containers packed with parts and stacked many levels high, catalog read ranges cannot be relied on. Testing whether your own containers can actually be read in your own stacking arrangement is a prerequisite. How to think about the cost of RFID equipment, tags and installation is covered as a 5-year total cost of ownership in our article on RFID implementation cost. In this article, the calculation later on shows only the break-even point for returnable containers.
Related standards
For applying RFID to returnable containers, ISO 17364 (2013 edition) defines the basic features of supply chain RFID used for RTIs and returnable packaging items. Its scope includes identification, recommendations for additional information on the tag, data syntax and minimum performance requirements. For communication between readers and tags (the air interface), ISO/IEC 18000-63:2021 (860 to 960 MHz band) is the reference standard.
Radio requirements for using RFID readers in Thailand
When using UHF RFID readers in Thailand, they must comply with the technical standard of the NBTC (National Broadcasting and Telecommunications Commission). The NBTC notification “Technical Standard for RFID” (กสทช. มท. 1010–2560) was published in the Royal Gazette on November 24, 2017 and has been in force since the following day, the 25th.
| Maximum transmit power stated in the notification (e.i.r.p.) | Licensing treatment (920–925 MHz, readers and active tags) |
|---|---|
| 50 mW | Exempt from licenses to manufacture, possess, use, import and export radio equipment and to establish a radio station |
| 0.5 W | Exempt from licenses to possess, use and take out radio equipment and to establish a radio station |
| 4 W | Relevant radiocommunication licenses are required |
For conformity assessment categories, equipment in the 920–925 MHz band with transmit power of 50 mW or less falls under SDoC (Supplier’s Declaration of Conformity), and readers and active tags above 50 mW up to 4 W fall under “ประเภท ก” (Category A). The table and categories above summarize the current standard as we could confirm it as of October 2026, and we have not been able to confirm whether it has been amended since. Especially when bringing in readers from overseas, check the frequency band and transmit power category in the equipment specifications and conformity documents, and confirm the latest requirements with the NBTC or the equipment vendor at the time of introduction.
When returnable containers cross borders
Sending empty containers back is a trade-off between cost and CO2
When returnable containers circulate from a factory in Thailand to overseas sites, or from overseas suppliers to Thailand, issues arise that differ from domestic circulation.
A master’s capstone from the Center for Transportation and Logistics (CTL) at MIT in the United States (poster from May 2022, sponsored by Nissan Motor) is a study on optimizing the repositioning of RTIs in a global supply network. It compares three models, aiming at minimum cost, minimum CO2 and both, and concludes that increasing RTI adoption contributes to cost reduction while transport-related CO2 increases, and that cost and CO2 cannot be minimized at the same time. Sending empty containers back across the sea carries not only a cost burden but also an environmental one.
Look ahead and have sites with surpluses send containers back
In the JPR-published Komatsu Logistics case mentioned earlier (information as of 2020), it is said that dealings with overseas sites require forecasts up to six months ahead, and that when a shortage is forecast, overseas sites with surpluses are asked to return empty containers. It is also said that container usage efficiency is used as a KPI to evaluate sites. Across borders, the number of days until containers come back is long, so acting only after you notice a shortage is too late.
Container names and declared values on invoices
In the same case, it is said that data from the container master is also used to prepare invoices (container name notation and declared value) when returning containers from overseas. For cross-border returnable containers, holding container names and the values used for declarations in the container master makes preparing documents easier and reduces errors.
The customs duty framework (not advice)
In Part IV (duty-exempt goods) of Thailand’s Customs Tariff Decree, within the scope we confirmed in the statutory text reflecting amendments up to 2014, there is a category (Category 19) that exempts from duty containers for packaging, and articles used for packing, fixing, binding and cushioning, that are imported and re-exported, under criteria and conditions set by the Director-General of Customs. This category was added by the 2014 amendment. There is also a category (Category 1) that exempts from duty goods exported and re-imported within 1 year without change in form, for which a re-import permit was obtained at the time of export.
However, this is an introduction to the legal framework and is not legal or customs advice. Which category applies to your returnable containers, and specific procedures such as filing forms, deadlines and whether a guarantee is required, must always be confirmed with your customs broker or Thai Customs.
Own your containers, or use a pool or rental service
What can be confirmed on official pages
Returnable containers and pallets can not only be owned by you but also borrowed from pooling (shared use) or rental operators. Here is what we could confirm on the official pages of operators that may be relevant in Thailand. All of these are the operators’ own descriptions and do not guarantee any effect or advantage. Prices are not covered here.
- JPR “Logiarx”: according to Japan Pallet Rental’s official page, it is a cloud-based service that manages returnable containers such as pallets, roll cages and plastic containers individually rather than by total quantity. Through RFID, 2D barcodes and data integration from various systems, it tracks which container is where and when and where it moved, and a dashboard shows surpluses and shortages, losses and dwelling at each site, it says. Readers and RF tags can also be provided, according to the page.
- JPR “APP (Asia Pallet Pool)”: according to the company’s official page, it is an international rental pallet service that lets you rent pallets in the exporting country and return empty pallets in the importing country. As of May 2026, the countries listed as available are Japan, Thailand, China, South Korea, Taiwan, Singapore, Vietnam, Malaysia and North America.
- CHEP: according to its official page for Thailand, it has supported supply chain optimization in Thailand since 2002, and its business operates in 60 countries. Its UK page introduces pooling of plastic crates and containers for the automotive and industrial sectors, but whether it provides the same service in Thailand could not be confirmed on the official Thailand page.
- Loscam Thailand: according to Loscam’s official page, Thailand is the company’s largest business in Southeast Asia, it pioneered the concept of pallet pooling in Thailand, and it describes itself as the market leader among manufacturers and retailers in the FMCG (consumer goods) industry. It also says that it opened Southeast Asia’s largest Super Depot in Wang Noi, Ayutthaya province, in May 2015. The company states that its main customers are in the consumer goods industry, and we have not been able to confirm whether it can be used as a pool for automotive parts returnable containers.
Even at major pool operators, individual tracking is still at the trial stage
The full-year results announcement (August 2026) of Brambles, the parent company of CHEP, for the fiscal year ended June 2026 (FY26) also shows the difficulties of the pooling business. According to the company’s announcement, constraints on repair capacity in the United States had a negative profit impact of about USD 90 million, and as of June 30, 2026, there were 3.4 million unrepaired surplus pallets in the United States.
In the same announcement, regarding its individual identification program “Serialisation+,” the company says that in Chile, the pilot market, it has obtained evidence that additional value can be gained from visibility of uncompensated pallet losses, cycle times and damage rates. In North America, reading capability has been installed at 80 service centers, and the decision on a North American rollout is scheduled to be announced in January to March 2027. This concerns Chile and North America, not Thailand. Still, it is worth noting that even at one of the world’s largest pool operators, tracking at the individual unit level is still at the trial stage in some markets.
Points of comparison
Whether to own your containers or use a pool or rental service can be compared from the following viewpoints.
| Viewpoint | Owning your containers | Using a pool or rental service |
|---|---|---|
| Container shape and dimensions | Can be designed to fit your parts | Chosen from the range of items the operator handles |
| Container balance management | You create reconciliation and rules yourself | Depending on the operator’s rules, movement reporting may be required |
| Burden of loss and damage | You bear it and split it through agreements with business partners | Depends on the operator’s contract terms |
| Cross-border returns | You arrange them yourself and also check customs issues yourself | If an international service exists, return destinations widen |
| Cleaning and repair | Done by you or a subcontractor | Depends on the operator’s contract terms and sites |
| How data is held | Held in your own system | Integration between the operator’s system and your own system is needed |
Whichever you choose, the need to grasp the container balance per business partner and the cycle time yourself does not change. Even when using a pool, as in the case in the GS1 guideline, you may need to report movements depending on the operator’s rules.
Model calculation of costs and benefits (hypothetical figures)
The assumed factory
From here, we run a calculation using hypothetical figures made up for this article. They are not figures from a real factory.
- A Japanese-affiliated automotive parts plant in Chonburi province
- It owns 10,000 plastic returnable containers (replacement cost 300 THB per container) and circulates them among 4 customers
- Containers used for shipping: currently 400 per day, expected to be 500 per day next year
- Cycle time (days until most containers come back): currently 22 days, target 16 days. Safety allowance 10% (×1.1)
- Current management uses Excel and a once-a-year stocktake
We compare two configurations.
- Configuration A: container labels + QR + handheld terminals + cloud. Initial cost 700,000 THB (10,000 container labels, 6 handheld terminals, cloud setup, preparing reconciliation rules with business partners, training), annual cost 168,000 THB (subscription, maintenance)
- Configuration B: UHF RFID tags + gates at 3 locations. Initial cost 2,200,000 THB, annual cost 300,000 THB
Benefit (1): reducing loss
Assume annual containers of unknown location and write-offs equal 6% of the number owned. 6% of 10,000 is 600 containers; at 300 THB per container, that is 180,000 THB per year. If reconciliation and rules can bring this down to 2% (200 containers, 60,000 THB), the benefit is 120,000 THB per year.
Note that both 6% and 2% are hypothetical figures for this calculation. As stated earlier, no public cross-industry statistics on loss rates were found, so the premise is that you replace them with your own measurements.
Benefit (2): reducing cardboard substitution
Assume that containers run short and products are repacked into cardboard boxes for shipment 5,000 times a year. At 30 THB per time for the cardboard and repacking work, that is 150,000 THB per year. If dwelling decreases and containers come back to the shipping area so that this drops to 1,000 times a year (30,000 THB), the benefit is 120,000 THB per year.
Benefit (3): reconciliation administration
Assume that reconciliation with business partners, matching shipment and return records, and handling inquiries take 40 hours a month. At 200 THB per hour, that is 40×200×12 = 96,000 THB per year. If the system calculates the container balance automatically and reconciliation reports can be sent to business partners so that this drops to 10 hours a month (24,000 THB per year), the benefit is 72,000 THB per year.
Configuration A: benefits and payback
| Item | Current | After introduction | Benefit (per year) |
|---|---|---|---|
| (1) Reducing loss | 600 containers×300 = 180,000 THB | 200 containers×300 = 60,000 THB | 120,000 THB |
| (2) Reducing cardboard substitution | 5,000 times×30 = 150,000 THB | 1,000 times×30 = 30,000 THB | 120,000 THB |
| (3) Reconciliation administration | 40 hours×200×12 = 96,000 THB | 10 hours×200×12 = 24,000 THB | 72,000 THB |
| Total benefit | — | — | 312,000 THB |
| Annual cost | — | — | 168,000 THB |
| Net benefit | — | — | 144,000 THB |
The net benefit of configuration A is 312,000 − 168,000 = 144,000 THB per year. Recovering the initial cost of 700,000 THB takes 700,000 ÷ 144,000, or about 4.9 years. The result is that with the benefits from loss, cardboard and administration alone, payback takes a fair number of years.
If the additional purchase can be avoided
This is where the earlier discussion of the number of containers needed comes into play. If introducing configuration A shortens the cycle time from 22 days to 16 days, next year’s number needed is 8,800, and the current 10,000 are enough. You avoid the additional purchase of 2,100 containers, or 630,000 THB, that would have been needed if the cycle time stayed at 22 days.
In this case, the effective initial burden is 700,000 − 630,000 = 70,000 THB, and the calculation gives payback in 70,000 ÷ 144,000, or about 0.5 years.
However, avoiding the additional purchase is a one-time effect. It is not included in the annual benefit (312,000 THB), nor in the net benefit of 144,000 THB. It is not double-counted, so that the same effect is not counted both in the annual benefit and in the initial burden. In addition, benefits (1) to (3) are calculated at the current shipment scale, and any increase or decrease in benefits from next year’s higher shipments is not added.

Configuration B (RFID)
For configuration B, benefit (1) is set at 120,000 THB, the same as configuration A. This is because the main cause of loss lies not in how containers are read but in return rules and reconciliation. Benefit (2) is also the same 120,000 THB. For benefit (3), reconciliation administration is assumed to fall from 40 hours to 4 hours a month thanks to bulk reading at the gates, giving 96,000 − 9,600 = 86,400 THB per year.
| Item | Configuration A (QR) | Configuration B (RFID) |
|---|---|---|
| Initial cost | 700,000 THB | 2,200,000 THB |
| Annual cost | 168,000 THB | 300,000 THB |
| (1) Reducing loss | 120,000 THB | 120,000 THB |
| (2) Reducing cardboard substitution | 120,000 THB | 120,000 THB |
| (3) Reconciliation administration | 72,000 THB (40 to 10 hours a month) | 86,400 THB (40 to 4 hours a month) |
| Total benefit | 312,000 THB | 326,400 THB |
| Net benefit | 144,000 THB | 26,400 THB |
| Payback period | About 4.9 years | About 83 years |
| If the 630,000 THB additional purchase is avoided | About 0.5 years | About 59 years |
The total benefit of configuration B is 326,400 THB, and the net benefit after subtracting the annual cost of 300,000 THB is 26,400 THB per year. Payback takes 2,200,000 ÷ 26,400, or about 83 years. Even after subtracting the 630,000 THB additional purchase, it is 1,570,000 ÷ 26,400, or about 59 years. For the factory in these hypothetical figures, the speed of RFID reading does not justify the additional cost.
Sensitivity: if loss is 3% instead of 6%
Let us look at the case where the premise of benefit (1), “6% loss,” turns out to be 3% when actually measured. 3% is 300 containers, or 90,000 THB, and even if this is brought down to 2% (60,000 THB), benefit (1) is only 30,000 THB. The total benefit of configuration A is 30,000 + 120,000 + 72,000 = 222,000 THB, the net benefit is 222,000 − 168,000 = 54,000 THB per year, and payback is 700,000 ÷ 54,000, or about 13.0 years.
Just changing the loss premise from 6% to 3% stretches the payback period from about 4.9 years to about 13.0 years. Comparing total benefits, the difference caused by the different loss premises is 90,000 THB per year (312,000 − 222,000), much larger than the additional benefit gained by switching the identification method from QR to RFID (14,400 THB per year, 326,400 − 312,000).
How to read the calculation
What this calculation tells us is that the identification method does not decide the payback. Two things do.
- (1) Measuring your own loss to learn whether it is at the 6% level or the 3% level
- (2) Whether you can shorten the cycle time and avoid additional purchases
It is reasonable to consider RFID only where there are many read points and very large reconciliation workloads, or for expensive racks and similar items.
What this calculation does not include
The risk of shortages that stop the customer’s line, handling EU-related reporting, the cost of cleaning and repairing containers, and CO2 are not included in this calculation. A stoppage of the customer’s line in particular would have a large impact if it occurred, so please evaluate it separately according to your own situation.
Items to check in the RFP and demos
Have vendors run one full loop with your containers
When comparing returnable container management systems, it is more reliable to have vendors run one full loop, from shipment to return and reconciliation, with your own containers and your own business partners than to have them fill in a feature checklist.
| Item to check | How to check | Basis and background |
|---|---|---|
| Can it hold both container types and individual containers? | Have them register plastic containers by type and racks individually | GS1’s GRAI concept of class and serial number |
| Can you decide the numbering scheme yourself? | Register both your own numbers and the numbers of customer-supplied containers | The GRAI is assigned by the owner |
| Can it produce container balances per business partner and per type? | Have it calculate balances from shipment and return events | Cumulative shipped minus cumulative returned, plus or minus adjustments |
| Can it produce reconciliation reports for business partners? | Have them output it in the format you would send to business partners | Operating examples such as reconciliation about 4 times a year |
| Can it show containers exceeding the free storage days? | Set the number of days per business partner and output the number exceeding it | Example agreements such as 21 days |
| Can movement history narrow down where losses occurred? | Record handovers including those with carriers | Records of handover, delivery and collection of empty containers |
| Cancelling and correcting events | Cancel an input error and keep the correction history | Being able to explain the basis of the balance |
| Mapping to and extending the CBV vocabulary | Mapping of shipping, receiving, inspection, repair and scrapping, plus an extension for cleaning | GS1 CBV 2.0 |
| Can it show the cycle time distribution? | Show, per business partner, the number of days until most containers come back | The idea of looking at the distribution, not the average |
| Output to cross-border documents | Output container names and declared values from the container master | The case of container names and declared values on invoices |
| EU-related aggregation (if applicable) | Aggregate rotations, rejects, return rates, numbers added and numbers scrapped | Annex to the EU PPWR (re-use systems within the EU) |
| Mixing identification methods | Handle QR and RFID in the same container master | Mixed example with QR as the basis and RFID in some places |
What to verify in PoC, FAT and SAT
In the trial (PoC), the factory acceptance test (FAT) before shipment and the site acceptance test (SAT), verify the following points.
- Read testing: if you use RFID, stack your own containers in your own way and measure whether they can actually be read with gates or handhelds. Also test with metal racks and with containers filled with parts
- Container balance calculation: whether the system’s container balance matches a manual count of shipments and returns during the trial period
- Reconciliation reports: whether, when actually sent to business partners, they are in a format that can be compared with the other party’s count
- Cancellation and correction: deliberately make input errors and check that the cancellation and correction history is kept and the balance returns to the correct figure
- EU-related aggregation: if you have shipments to the EU or European customers, whether rotations, return rates and similar can be aggregated
- Radio documents: for RFID readers, whether conformity documents showing the 920–925 MHz band and the transmit power category are in place
How to proceed: 90 days from taking stock of container balances to deciding how many containers to own
Before rolling the system out company-wide, a rough guide is to go through the following three stages in 90 days.
Days 1 to 30: take stock of container balances at all business partners and draft reconciliation rules
The first 30 days are preparation before introducing a system.
- Take stock of how many containers of each type are currently held at each business partner. Ask the business partners to count as well, and compare with your own books
- Record the gap against the books, split into three: (1) dwelling at a business partner, (2) location unknown and (3) damaged or scrapped. This becomes the first measured value of your own loss rate
- Prepare a draft for discussion with business partners covering reconciliation frequency, target number of days for return and how the burden of losses is shared
- Decide on the container types and the range of containers to track individually
As we wrote about product inventory in our article on stocktaking efficiency, making stocktaking faster does not reduce discrepancies, and the same is true for returnable containers. What matters is not counting speed but recording discrepancies split by cause.
Days 31 to 60: run a trial with 1 customer and 1 container type
For the next 30 days, run a trial limited to 1 customer with a large container balance and 1 container type used with that customer.
- Attach labels to the containers and start recording shipments and returns in the system
- Also record handovers with the carrier, as far as possible
- Every 2 weeks, compare the system’s container balance with the count at the customer
- Count how many cancellations and corrections occur
Days 61 to 90: measure reconciliation discrepancies and cycle time, then decide on the number owned and rollout
In the last 30 days, summarize the results of the trial in numbers.
- How large the remaining reconciliation discrepancies are and what causes them
- For the trial customer, how many days it takes for most of the shipped containers to come back (cycle time distribution)
- With that cycle time, how many containers are needed for next year’s shipment volume. Whether additional purchases are needed, or whether shortening the cycle time would be enough
- Whether to extend to other customers and containers, and whether there are sites or containers for which RFID should be considered
If at the end of the 90 days you have your own measured loss value and cycle time in hand, you can replace the premises of the calculation with your own figures. Making the investment decision from that point is early enough.
What to check especially at factories in Thailand
Language of documents
Reconciliation reports and return requests need to be issued in a language the business partner’s staff can read. Check whether you can switch language per counterpart, for example Thai for Thai customers and carriers, Japanese for Japanese-affiliated customers, and English for dealings with overseas sites.
Carrier handover records
In Thailand, returns of returnable containers are probably often left to carriers. Can the carrier’s driver keep records of how many empty containers were picked up and how many were delivered? Will this be kept on paper receipts or recorded with handhelds or smartphones? If this is missing, you cannot narrow down the stretch where containers were lost.
Where containers are kept inside the customer’s plant
Another point to check is where empty containers are placed inside the customer’s plant. If there is no designated place for empty containers awaiting return, they get mixed with other companies’ containers or used for other purposes within the customer’s company. It would be good to talk with the customer and have them designate a place for containers awaiting return.
Rules for cardboard substitution in peak season
Shipping in cardboard boxes when containers run short cannot be eliminated right away. Check who decides to switch to cardboard, whether the number of times is recorded, and whether the customer accepts deliveries in cardboard. The number of cardboard substitutions is an easy-to-understand indicator of container shortages.
Conformity documents for RFID equipment
If you use RFID, check before introduction that the readers support the 920–925 MHz band and that conformity documents matching the transmit power category are in place. Extra care is needed when bringing in equipment made overseas.
Frequently asked questions
What is returnable container management?
It means recording the loop from when a returnable container leaves the factory, is used at a business partner, is returned, and goes through inspection, cleaning and repair until it is used again, so that you can hold the container balance at each business partner and the cycle time as numbers. The purpose is not to find containers but to know how many containers are held at which business partner and in how many days they come back, and to prevent shortages and additional purchases.
How do you prevent loss of returnable containers?
First, split “loss” into three: (1) dwelling at a business partner, (2) location unknown and (3) damaged or scrapped. (1) can be reduced through regular reconciliation with business partners and rules on the target number of days for return. For (2), keep handover records between you, the carrier and the business partner, and narrow down the stretch where containers disappeared. For (3), correctly remove containers from the number owned using inspection and scrapping records. Because no public cross-industry statistics on loss rates were found, start with your own measurements.
Do returnable containers need RFID?
Not necessarily. In this article’s hypothetical calculation, payback for configuration A using QR was about 4.9 years, while configuration B using RFID took about 83 years. This is because, on the view that the main cause of loss is not how containers are read but return rules and reconciliation, the loss reduction benefit with RFID was set at the same level as configuration A, so the only additional benefit for the large cost was the reconciliation administration part. It is reasonable to consider RFID only where there are many read points and very large reconciliation workloads, or for expensive racks and similar items. If you use it, testing whether containers can actually be read with metal and stacking is a prerequisite.
How do you reconcile container balances?
For each business partner and each container type, calculate the container balance as cumulative shipped minus cumulative returned, plus or minus adjustments, and regularly compare it with the count held by the business partner. In the case of one Swedish OEM (a 2019 master’s thesis), a supplier reconciled about 4 times a year. If you include container quantities in shipping notices and EDI, you can narrow reconciliation discrepancies down to the return side.
How many returnable containers should you own?
This article organizes a rule of thumb as “containers used per day × cycle time in days (days until most containers come back) + safety allowance.” This is this article’s own framing, not a formula from the sources. In the hypothetical figures, 400 per day, 22 days and a 10% safety allowance give 9,680 containers, and if shipments rise to 500 per day, 12,100 are needed, but if the cycle time is shortened to 16 days, 8,800 are enough. Before buying more, it is worth considering whether you can shorten the cycle time.
Is Excel not good enough?
Excel is not ruled out. If you have few business partners and the same person records the numbers of shipments and returns, you can calculate container balances in Excel too. The problem arises when the number of business partners and container types grows, shipment and return records are split across separate departments, and reconciliation takes dozens of hours a month. When you can no longer answer right away what the container balance at each business partner is, that is a sign to consider a system.
How long does it take to introduce a returnable container management system?
It varies greatly with the product and scope, so no single period can be given. This article showed a rough guide of 90 days before company-wide rollout to take stock of container balances at all business partners and draft reconciliation rules, run a trial with 1 customer and 1 container type, and measure reconciliation discrepancies and cycle time. What matters more than the length of the period is whether you have your own measured loss value and cycle time in hand at the end of the 90 days.
Summary
- The purpose of a returnable container management system is not to find containers but to hold, as numbers, the container balance at each business partner (cumulative shipped minus cumulative returned, plus or minus adjustments) and the cycle time
- The three typical reasons containers run short are: (1) nobody holds the container balance per business partner, (2) rules on return deadlines, free storage days and charging for losses have not been agreed, and (3) the number owned is set from the average cycle time. Research (a Swedish dairy industry case, 2007) also says that visibility alone is not enough and management action is needed
- Split “loss” into three: dwelling at a business partner, location unknown, and damaged or scrapped. No public cross-industry statistics on loss rates were found, and the 2% in the Chalmers case is a scrap rate, not a loss rate. Start with your own measurements
- The data consists of four parts: the container master (types and individual containers), the site and business partner master, events and container balances. Refer to GS1 CBV 2.0 for event names, and define cleaning as your own extension
- Use “containers used per day × cycle time (days until most come back) + safety allowance” as a rule of thumb for the number needed. In the hypothetical figures, where 12,100 containers would be needed next year, shortening the cycle time from 22 to 16 days means 8,800 are enough, avoiding an additional purchase of 630,000 THB
- For identification, a mix of QR for every container and RFID or trackers for some is realistic. RFID requires on-site testing with metal and stacking, and in Thailand you should check the NBTC standard (published in the Royal Gazette on November 24, 2017 and in force from the following day, the 25th)
- In the hypothetical calculation, configuration A (QR) has a net benefit of 144,000 THB per year and a payback of about 4.9 years, or about 0.5 years if the additional purchase is avoided (avoiding the additional purchase is a one-time effect and is not included in the annual benefit). Configuration B (RFID) has a net benefit of 26,400 THB per year and takes about 83 years. If loss is 3%, even configuration A takes about 13.0 years. What decides the payback is not the identification method but the measured loss and the shortening of the cycle time
- The EU packaging regulation (PPWR) has applied since August 12, 2026, and the re-use targets for transport packaging are scheduled from 2030. This concerns the EU and does not apply directly to factories in Thailand, but European customers may ask you to aggregate rotations and return rates
At TOMAS TECH, we help factories in Thailand design recording systems for returnable containers and logistics, select handheld terminals, labels and RFID equipment and run read tests, and integrate with existing systems. You can also consult us before choosing a product, for example at the stage of taking stock of container balances at each business partner, designing reconciliation rules and events, or drafting RFP requirements. Please contact us via this form.
References
- The Star (Reuters), Thai August factory output rises 4.44% y/y, beats forecast (September 30, 2026)
- Trading Economics, Thailand Manufacturing PMI (October 1, 2026)
- EUR-Lex, Regulation (EU) 2025/40 on packaging and packaging waste (Official Journal, January 22, 2025)
- EUR-Lex, Commission Delegated Decision (EU) 2026/429 (Official Journal, May 6, 2026)
- GS1, Global Returnable Asset Identifier (GRAI)
- GS1, GRAI Executive Summary (2015 edition)
- GS1, GS1 Identification Keys in Transport & Logistics, Issue 1 (June 2013)
- GS1, Core Business Vocabulary (CBV) Standard, Release 2.0 (June 2022)
- BSI Knowledge, BS ISO 17364:2013 Supply chain applications of RFID — Returnable transport items (RTIs) and returnable packaging items (RPIs)
- IEC Webstore, ISO/IEC 18000-63:2021
- Ministry of Land, Infrastructure, Transport and Tourism (Japan), Status of pallet standardization efforts (November 5, 2024, in Japanese)
- Lund University, Johansson & Hellström, The effect of asset visibility on managing returnable transport items (2007)
- Lund University, Hellström & Johansson, The Impact of Control Strategies on the Management of Returnable Transport Items (2010)
- BearWorks (Missouri State University), Cobb, Estimating cycle time and return rate distributions for returnable transport items (2016)
- BearWorks (Missouri State University), Li & Cobb, Forward cycle time distributions for returnable transport items (2022)
- Chalmers University of Technology, Albertsdóttir & Starman, RFID tags, GPS trackers, and how they can benefit Original Equipment Manufacturer’s packaging flow (2019, master’s thesis)
- Japan Pallet Rental, Logiarx cloud-based individual asset management system (in Japanese)
- Japan Pallet Rental, APP international rental pallet service (in Japanese)
- Japan Pallet Rental, Komatsu Logistics Corp. case study (published June 2020, in Japanese)
- Loscam, Pallet Pooling Thailand
- CHEP Thailand, Why partner with CHEP
- Brambles, 2026 Full-Year ASX & Media Release (August 20, 2026)
- atlasRFIDstore, RFID System Performance Problems – Liquids, Metals, and More Environmental Issues (updated April 24, 2024)
- NBTC, ประกาศ กสทช. เรื่อง มาตรฐานทางเทคนิคของเครื่องโทรคมนาคมและอุปกรณ์ สำหรับเครื่องวิทยุคมนาคม ประเภท RFID (published in the Royal Gazette on November 24, 2017, in Thai)


