


The push to install a cleanroom environmental monitoring system usually starts with a single question from a customer auditor. “Do you have continuous data for this period?” “Can you show me the alarm history?” A plant that takes weekly or daily readings by hand with a portable particle counter, reads differential pressure off a gauge, and logs temperature and humidity on standalone loggers cannot answer that question quickly. Worse is the case where a deviation is discovered after the fact. Nobody knows what happened between one reading and the next, the scope of impact cannot be narrowed, and the only option left is to put a whole batch of lots on hold.
This is a practical guide for quality assurance, facilities and utilities, and production engineering staff, as well as plant managers, at Japanese-affiliated plants in Thailand, in areas such as Ayutthaya, Chonburi, Rayong, Samut Prakan and Prachinburi, that make electronic components, PCBs, HDDs, semiconductor back-end products and medical devices, or that run pharmaceutical and food packaging. It sets out what to order, how many measurement points, to what specification, and what to verify at FAT (factory acceptance test) and SAT (site acceptance test).
The article makes one argument. If you think of cleanroom environmental monitoring as “attach sensors and watch the graphs,” the investment will not pay back. Reducing manual measurement hours alone may not even cover the cost of calibration and maintenance. What decides payback is a design that detects deviations while the process is running, then identifies and contains the affected lots by timestamp. Concretely, that means four things.
- (1) Measurement points and frequencies based on risk assessment (ISO 14644-2)
- (2) A documented rationale for alert levels, action levels and delay times
- (3) Data integrity (audit trail, time synchronization, handling of missing data)
- (4) Time-based linkage to lots and production records
Whether you can write these four points into the RFP (request for proposal) and into the FAT/SAT acceptance criteria is what makes the difference.
Note that this article explains the general content of standards and guidelines and the related system design. It is not regulatory or pharmaceutical compliance advice. Which standards your own cleanroom must comply with should be confirmed with your quality assurance department, your customers and, where necessary, the regulatory authorities. All amounts, counts and hours in the cost estimate later in the article are placeholder figures set up for this article only.
Why Revisit Cleanroom Environmental Monitoring Now
Growing Demand for Cleanrooms in Thailand
On 1 October 2026, Infineon opened Module A of its semiconductor back-end plant in Samut Prakan Province. According to press reports, the plant handles assembly, test and wafer test, with roughly 30,000 m² of cleanroom space designed to be expandable to a maximum of 150,000 m². Headcount is planned to grow from about 350 to about 1,000, and reports put the total project size at USD 1.4 billion, with an initial investment of more than EUR 100 million.
Just before that, on 24 September 2026, Thailand’s National Semiconductor and Advanced Electronics Industry Policy Committee approved the country’s first national semiconductor strategy. According to a TechNode Global report on 25 September 2026, the strategy aims for cumulative investment of about USD 80 billion and more than 230,000 new jobs by 2050, in three phases. Up to 2030, the focus is on expanding advanced packaging, preparing for front-end manufacturing and developing 86,600 people. Up to 2040, the aim is to attract design and wafer fabrication, and by 2050 to complete a domestic supply chain. The priority fields are photonics, power semiconductors and sensors. The same report states that from 2023 through the first half of 2026, the BOI received 879 investment applications in semiconductors and advanced electronics, worth THB 909 billion (about USD 27.2 billion).
PCBs are following the same trend. According to a report in The Nation on 23 February 2026, there were more than 180 PCB-related investment promotion applications worth more than THB 200 billion from 2022 to June 2025, and Thailand aims to enter the global top five as “ASEAN’s number one PCB production base.” Investment from Japan also continues. A report in The Nation on 2 February 2026 said that BOI investment applications from Japan in 2025 numbered 311, worth more than THB 119 billion (up 146% year on year), of which electrical and electronics accounted for THB 24.318 billion (up 121%).
As cleanrooms are newly built or expanded, the level of environmental data that customers expect also rises. The planning stage of a new building is a realistic moment to switch from manual measurement to continuous monitoring.
PIC/S Qualification Guidance Took Effect on 1 October 2026
For plants involved in pharmaceuticals or medical devices, there is another development. PIC/S (the Pharmaceutical Inspection Convention and Pharmaceutical Inspection Co-operation Scheme) published its recommendation document on qualification and validation, PI 006-4, on 30 July 2026 and brought it into force on 1 October 2026. It replaces the previous PI 006-3. Thai FDA has been a PIC/S member since August 2016.
PI 006-4 is a document in the context of pharmaceutical GMP and does not apply directly to electronic component plants. Still, its approach of not treating a monitoring system as “install and done,” and of demonstrating its suitability through planning, testing and records, also carries weight in customer audits in the electronics sector. Pharmaceutical plants should confirm how it applies to them with their quality assurance department and the regulatory authorities.
What to Measure – Particles, Differential Pressure, Temperature/Humidity and Airflow
A cleanroom environmental monitoring system continuously measures four main things.
- Airborne particles: number concentration by particle size, such as 0.5 µm and larger, and 5 µm and larger
- Differential pressure: the pressure difference between adjacent rooms, or between an anteroom and a corridor
- Temperature and humidity: managed according to product and process requirements, operator comfort, and their relationship with static control
- Air velocity and airflow volume: air velocity at working positions under unidirectional flow (downflow), and supply air volume
ISO 14644-2:2015 states that “supporting tests” such as differential pressure, air velocity/volume and temperature/humidity should be considered in the monitoring plan. In other words, measuring particles alone is not enough.
Electronics and Pharmaceuticals Draw on Different Sources of Criteria
The first thing to understand is that “what the criteria are based on” differs by industry.
| Item | Electronic components, PCB, HDD, semiconductor back-end | Sterile pharmaceutical manufacturing (reference) |
|---|---|---|
| Cleanliness criteria | ISO 14644-1 classes (e.g. ISO 5 to 8) and customer requirements | EU GMP Annex 1 Grade A to D |
| Monitoring framework | ISO 14644-2 monitoring plan | Annex 1 and the contamination control strategy (CCS) |
| Differential pressure | Set by customer requirements or internal standards | A minimum of 10 Pa between adjacent rooms of different grades (guidance value) |
| Humidity | Set by product and process requirements. There is a view that ESD control does not depend on humidity | Set by product and process requirements |
| Legal status | Often treated as a contractual requirement | Subject to regulatory inspection as pharmaceutical GMP |
EU GMP Annex 1 is guidance for sterile pharmaceutical manufacturing, and its values apply to Grade A to D areas. It is not a legal obligation for electronic component, HDD or semiconductor plants. However, it is a public document that describes continuous monitoring, alarms and data management in detail, so this article uses it as “a reference for the most demanding practice.” Which criteria to apply to your own plant depends on your agreements with customers and on the judgment of your quality assurance department.
ISO 14644-1 vs 14644-2 – “Classification” and “Monitoring”
The roles of ISO 14644-1 and ISO 14644-2 are often confused.
- ISO 14644-1:2015 is the “classification” standard. It determines which ISO class a room corresponds to at a given point in time.
- ISO 14644-2:2015 is the “monitoring” standard. It covers the plan used to show that the classified class is being maintained day to day.
Both were revised in 2015. According to PharmOut’s explanation, 14644-1 underwent its first major revision since 1999, approved in October 2015 and published in December.
ISO 14644-1:2015 Table 1 – Maximum Concentration by Class
The following is an excerpt from Table 1 of ISO 14644-1:2015 covering the classes commonly used in electronics plants. Values are particles per m³, cumulative for particles at or above each size.
| ISO class | ≥0.1 µm | ≥0.3 µm | ≥0.5 µm | ≥1 µm | ≥5 µm |
|---|---|---|---|---|---|
| 4 | 10,000 | 1,020 | 352 | 83 | — |
| 5 | 100,000 | 10,200 | 3,520 | 832 | — (no value in table) |
| 6 | 1,000,000 | 102,000 | 35,200 | 8,320 | 293 |
| 7 | — | — | 352,000 | 83,200 | 2,930 |
| 8 | — | — | 3,520,000 | 832,000 | 29,300 |
In the 2015 edition, the ≥5 µm value for ISO Class 5 was removed from the table. PharmOut’s explanation attributes this to a review of counter sensitivity at low concentrations, and when ≥5 µm particles are to be addressed, they are expressed using the “M descriptor” (the notation for macroparticles). A reinraum.de article dated 13 October 2016 states that ≥5 µm particles should continue to be recorded for GMP applications.
Table A.1 – The Number of Points Is Set by Area
The minimum number of sampling locations for classification is determined from the area using Table A.1 of ISO 14644-1:2015. An excerpt follows.
| Area (m², up to) | Minimum number of points |
|---|---|
| 10 | 5 |
| 24 | 6 |
| 52 | 10 |
| 104 | 16 |
| 232 | 22 |
| 436 | 25 |
| 1,000 | 27 |
If the area falls between values in the table, choose the larger row. For example, a 100 m² room falls in the “up to 104 m²” row, so 16 points are required. For unidirectional-flow rooms, the cross-sectional area perpendicular to the airflow may be used; for other rooms, the horizontal floor area. Areas above 1,000 m² are calculated with a separate formula (Formula A.1), but this article does not cover the content of that formula. Please check the standard itself.
According to PharmOut’s explanation, this number of points is based on the idea of ensuring, “with at least 95% confidence, that at least 90% of the cleanroom does not exceed the class limit.” The 95% upper confidence limit calculation for 2 to 9 points in the previous edition has been abolished, and each point is evaluated individually, with all points required to pass. Measurement points are distributed evenly, avoiding positions directly beneath non-diffusing HEPA outlets. A reinraum.de article states that the revision increased the number of points by up to about 1.7 times.
Sample Volume per Point
The minimum sample volume per point is calculated with the following formula (according to a Beckman Coulter application note).
- Vs = (20 ÷ Cn,m) × 1,000 [L]
- Cn,m is the class limit concentration at the particle size of interest
- Subject to a minimum of 2 L per point and a minimum of 1 minute
Let us work it through. For ISO Class 5 at ≥0.5 µm, Cn,m is 3,520, so 20 ÷ 3,520 × 1,000 ≈ 5.68 L. For ISO Class 7 at ≥0.5 µm, 20 ÷ 352,000 × 1,000 ≈ 0.057 L, which is below the 2 L minimum, so 2 L is used. In both cases, the 1-minute minimum must be satisfied separately.
ISO 14644-2 – A Monitoring Plan Based on Risk Assessment
The core of ISO 14644-2:2015 is the requirement that a monitoring plan shall be created, implemented and maintained, based on a risk assessment grounded in the intended use. According to the explanations by PharmOut and reinraum.de, the main changes are as follows.
- Periodic reclassification is, as a rule, “once a year.” The interval can be extended based on risk assessment
- The fixed test-interval table of the previous edition has been replaced by a risk-based approach
- There is an informative annex on setting alert levels and action levels
- Supporting tests such as differential pressure, air velocity/volume and temperature/humidity are considered in the monitoring plan
- It was clarified that where the process itself generates particles, one may rely on periodic classification in the at-rest state or classification under simulated operation, instead of continuous particle monitoring
In other words, “where, how often and with what to measure” is not fixed uniformly by the standard. It is something each company decides through its own risk assessment and documents. The number of continuous monitoring points does not have to equal the number of classification points. Prioritize high-risk locations, such as where product is exposed, where people come and go frequently, and where deviations have occurred in the past, and write the reasons into the plan.
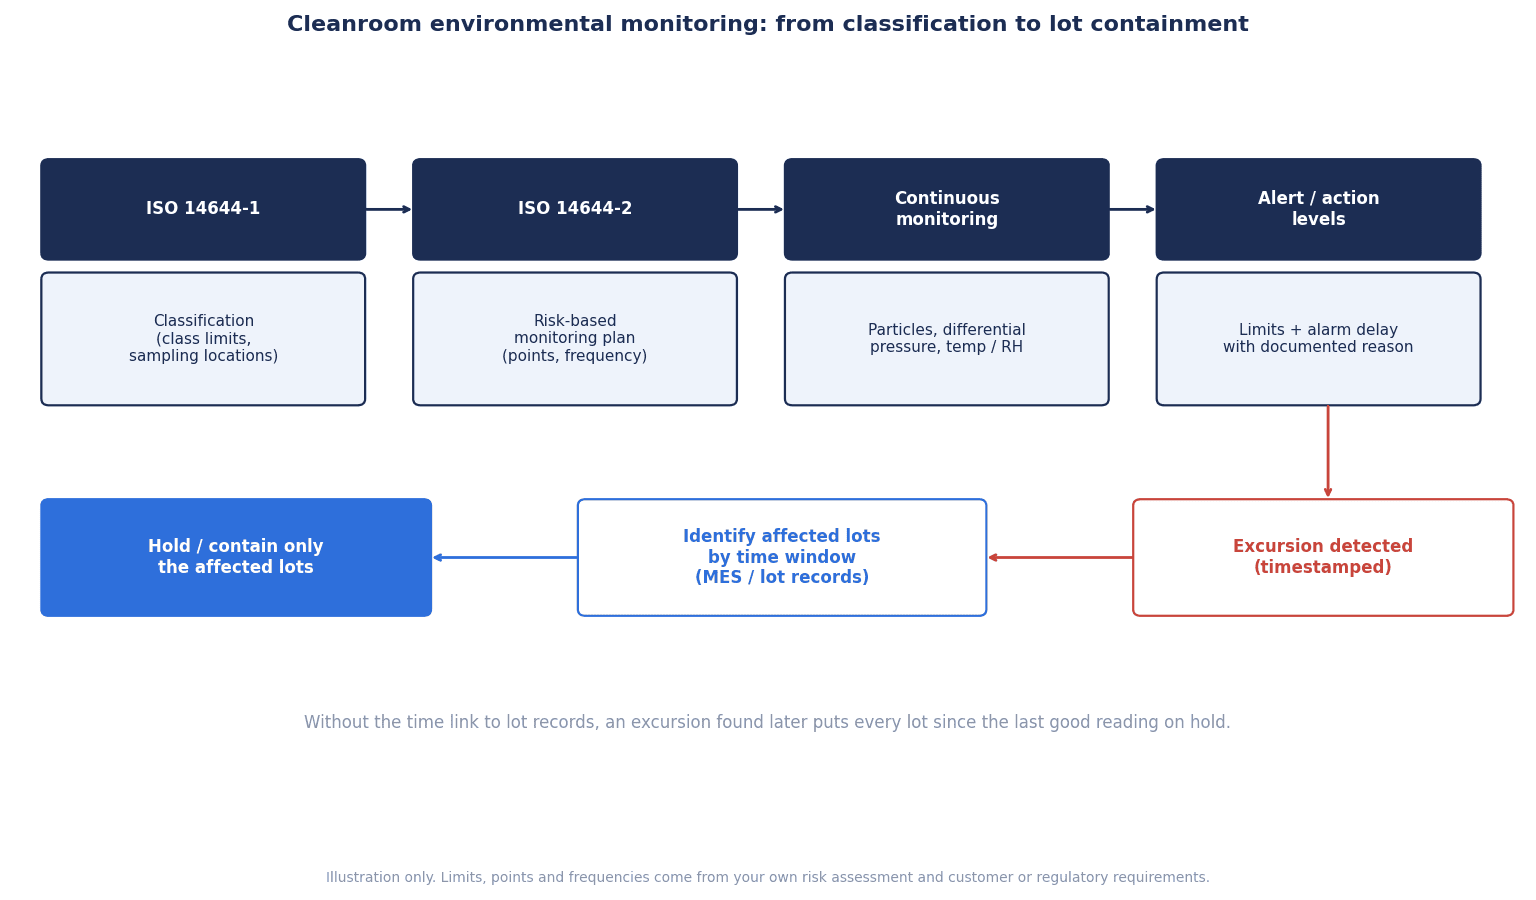
Creating the monitoring plan from classification, collecting data through continuous monitoring, alerting through alarms and linking to lots form a single continuous flow. If any one link is missing, you may have data but you cannot contain deviations.
EU GMP Annex 1 and “the Most Demanding Practice”
All values in this section are based on EU GMP Annex 1 “Manufacture of Sterile Medicinal Products,” and apply to Grade A to D areas in sterile pharmaceutical manufacturing. They are not mandatory values for electronic component or semiconductor plants. Read them as a reference when deciding how far to build out continuous monitoring.
Publication and Application Dates
The revised Annex 1 was issued as European Commission document C(2022) 5938 final, dated 22 August 2022, and was posted in EudraLex Vol.4 on 25 August 2022. It has applied since 25 August 2023, except for Section 8.123 on freeze-drying, which has applied since 25 August 2024. PIC/S adopted the same content as PIC/S GMP Guide PE 009-17, which entered into force on 25 August 2023 (Section 8.123 only from 25 August 2024).
Particle Limits by Grade (for Monitoring, Table 5)
Table 5 of Annex 1 (Section 9.15) gives the total particle limits used for monitoring. Values are particles per m³.
| Grade | ≥0.5 µm at rest | ≥0.5 µm in operation | ≥5 µm at rest | ≥5 µm in operation |
|---|---|---|---|---|
| A | 3,520 | 3,520 | 29 | 29 |
| B | 3,520 | 352,000 | 29 | 2,930 |
| C | 352,000 | 3,520,000 | 2,930 | 29,300 |
| D | 3,520,000 | Not predetermined | 29,300 | Not predetermined |
The in-operation limit for Grade D is not predetermined. It is set by the manufacturer from risk assessment and routine data. Annex 1 also states that sporadic counts of ≥5 µm particles in Grade A may be regarded as false counts caused by electronic noise, stray light and the like, whereas consecutive or regular counts, even at low levels, are a possible indication of a contamination event and should be investigated.
The classification table, Table 1 (Section 4.27), differs from Table 5 in some respects, such as the treatment of ≥5 µm particles. Classification is to follow the minimum number and location of points in ISO 14644-1 (Section 4.28).
Differential Pressure – “A Minimum of 10 Pa” and Continuous Recording
On differential pressure, Annex 1 states the following.
- The pressure differential between adjacent rooms of different grades is a minimum of 10 Pa (guidance value) (Section 4.14)
- Pressure differential indicators are installed between rooms. Pressure differentials determined to be critical are continuously monitored and recorded (Section 4.16)
- A system is in place to give an immediate warning of a supply air failure or of a pressure differential falling below its set value
- Warnings are not overridden without assessment
- If a delay time is applied to alarms, it is assessed and justified within the contamination control strategy (CCS)
- Pressure differentials not determined to be critical are monitored and recorded periodically
Section 4.16 is a set of requirements that can be used almost as-is in an RFP for a monitoring system. Three of them, “continuous recording,” “immediate warning” and “justified delay times,” are worth writing into specifications even at electronics plants.
Continuous Monitoring in Grade A and 28 L/min
In Grade A, particles are monitored for the full duration of critical processing (including equipment assembly). Particles of ≥0.5 µm and ≥5 µm are monitored continuously, with a sample flow rate of at least 28 L (1 ft³) per minute. Each sample result is frequently compared with the alert and action levels, and an alarm is raised when the alert level is exceeded (Sections 9.16 to 9.17). A similar system is recommended for Grade B, where the frequency may be lower (Section 9.18). The sample volume of an automated system does not have to be the same as for classification, but the reason must be justified (Section 9.21).
Counters, Tubing and Requalification
- Counters are qualified including their sampling tubing. Unless justified, tubing length is normally 1 m or less, with bends kept to a minimum (Section 5.9)
- Portable counters with short tubing are used for classification, and isokinetic sampling heads are used in unidirectional flow
- The maximum requalification interval is 6 months for Grades A and B and 12 months for Grades C and D (Section 4.32). The minimum items are classification by total particles, integrity testing of final filters, airflow volume measurement, verification of pressure differentials between rooms, and air velocity testing
- Air velocity at working positions under unidirectional flow is 0.36 to 0.54 m/s (guidance value) (Section 4.30)
These 6-month and 12-month intervals are the values for requalification of Grades A to D in Annex 1. They are separate from the reclassification frequency in ISO 14644-2 (once a year as a rule, extendable through risk assessment), so take care not to confuse them.
Selecting and Calibrating Particle Counters
Permanent Remote Counters vs Manifold Systems
There are two broad configurations of particle counters used for continuous monitoring.
| Configuration | How it works | Where it fits | Points to watch |
|---|---|---|---|
| Remote (one counter per point) | A compact counter is permanently installed at each measurement point and data is collected over the network | Critical measurement points, locations where tubing should be kept short | Calibration and maintenance costs grow as the number of units grows |
| Manifold (multi-point switching) | Several tubes are connected to one counter, which switches between them in sequence | Locations where many less critical points are to be covered in rotation | Each point is measured intermittently rather than continuously. Tubing tends to become long |
One example specification for a typical permanent remote counter is a sample flow rate of 1 CFM (28.3 L/min), up to 4 size channels including 0.5 µm and 5 µm, Ethernet (TCP/IP) or serial Modbus RTU output, 4 analog inputs of 4 to 20 mA for connecting environmental sensors, and calibration compliant with ISO 21501-4. Since 1 CFM is 28.3 L/min, this is consistent with Annex 1’s “at least 28 L/min.”
Tubing Lowers the Transport Efficiency of 5 µm Particles
When tubing is used, the biggest concern is large particles of 5 µm and above. A Beckman Coulter application note tested how many ≥5 µm particles reach the counter (transport efficiency, or recovery) with 1/4-inch tubing at 1 CFM.
| Tubing condition (1/4 inch, 1 CFM) | Transport efficiency for ≥5 µm |
|---|---|
| 2 m, straight | 76% ± 20% |
| 3 m, straight | 37% ± 12% |
| 3 m, 2 bends | 21% ± 13% |
| 3 m, 4 bends | 16% ± 7% |
These figures are “the proportion that reached the counter.” For example, with 3 m and 4 bends, only about 16% arrive, which means most of the large particles are lost along the way. By contrast, transport efficiency for ≥0.5 µm particles was 92% ± 10% to 98% ± 8%, so the effect is described as small. With 3/8-inch tubing (28.3 to 100 L/min), the average loss was negligible. The same note recommends keeping tubing short and wide, securing a bend radius (minimum 4 inches), and evaluating any run longer than 1 m.
If long tubing is routed around with a manifold system, ≥5 µm particles may be undercounted, which can lead to a state where “the data looks fine but the room is actually dirty.” At measurement points where you want to control ≥5 µm particles, either use remote counters or specify tubing length and bends on the drawings and confirm them at SAT.
On this point, ISO/TC 209 published the technical report ISO/TR 14644-21:2023 (airborne particle sampling techniques) in August 2023. According to an explanation by Particle Measuring Systems, it was created to support users following the 2022 revision of Annex 1. It distinguishes between classification (accuracy of the sample) and monitoring (quality of the data used for trend management), and states that tubing should be “as short as possible.”
Calibration to ISO 21501-4
Calibration of light-scattering airborne particle counters is covered by ISO 21501-4. According to an explanation by Particle Measuring Systems, the main requirements are as follows.
| Item | Requirement |
|---|---|
| Counting efficiency (near the minimum detectable size) | 50% ± 20% |
| Counting efficiency (1.5 to 2 times the minimum detectable size) | 100% ± 10% |
| Size resolution | 15% or less |
| Standard uncertainty of volumetric flow rate | 5% or less |
| Size setting error | 10% or less |
| False counts | Evaluated in the smallest reported size range while sampling clean air |
In the RFP, write “Submit calibration certificates compliant with ISO 21501-4,” and set the calibration interval in line with customer requirements and your internal measurement management rules. As the number of units grows, how to cover the period when a counter is removed for calibration (spare units) also becomes an issue. For how to manage due dates, see also how a calibration management system prevents expired measuring instruments.
Selecting and Installing Differential Pressure and Temperature/Humidity Sensors
Cleanroom Differential Pressure Monitoring – Range and Accuracy
If a differential pressure transmitter’s range is too wide relative to the pressure you want to measure, accuracy becomes insufficient. One product specification example shows the following values.
| Item | Example specification |
|---|---|
| Range | Bidirectional ±60 Pa / ±125 Pa, unidirectional 0 to 500 Pa |
| Accuracy | Bidirectional 0.4% of span, unidirectional 1% of span |
| Long-term stability | ±0.25% span/year or less |
| Response time | 250 ms (10 to 90%) |
| Output | 4 to 20 mA (2-wire), 0 to 5 V / 0 to 10 V (3-wire) |
With a ±60 Pa range, the span is 120 Pa, so 0.4% of span is 120 × 0.004 = 0.48 Pa. That is a sufficiently small error for monitoring a differential pressure of a minimum of 10 Pa. On the other hand, 1% of span on a 0 to 500 Pa range is 500 × 0.01 = 5 Pa, which is too coarse for monitoring differential pressures around 10 Pa. Specify “range” and “accuracy” together in the specification.
For installation, it is important to place the pressure taps (ports) where the draft from doors opening and closing does not hit them directly, to make clear on drawings and in tag names which room is the reference, and to set alarm delay times on the assumption that door operation will temporarily disrupt the differential pressure.
Cleanroom Temperature and Humidity Control
The control range for temperature and humidity is set according to product and process requirements. Sensor selection, installation positions and how to run a PoC are covered in detail in our article on selecting a temperature and humidity monitoring system and running a PoC. Here we highlight one point that is often misunderstood at electronics plants.
An explanation published by the ESD Association on 1 August 2024 states that an electrostatic discharge (ESD) control program under ANSI/ESD S20.20 does not depend on humidity. The reason given is that while humidity helps reduce charging, it does not control charging well enough to lower the risk to sensitive components. Product qualification testing of ESD control items is normally carried out after conditioning at 12% ± 3% RH and 23 °C ± 3 °C, and S20.20-2021 also allows product qualification to be confirmed at the facility’s lowest annual humidity. The same article states that if materials compliant with S20.20 are used, humidity control is not required.
In other words, the humidity control range should not be set uniformly “for ESD.” It should be decided from product moisture sensitivity, process requirements and customer specifications. Setting a tight range without a clear basis only increases alarms and does not translate into quality.
Designing Alert/Action Levels and Delay Times
Why Two Levels
Alarms for environmental monitoring are usually designed in two tiers.
- Action level: the value at which investigation and action are required when exceeded. The upper limit is the ISO class limit or the customer requirement, or, in pharmaceuticals, Table 5 of Annex 1
- Alert level: a value below the action level that gives early notice of a change from normal conditions
ISO 14644-2:2015 has an informative annex on setting these two levels. Annex 1 (Sections 9.9 to 9.13) sets the upper limit of the action limits at Table 5, states that alert levels are set based on the results of qualification tests, and says they are reviewed periodically through trending. What trending should look for includes an increasing number of action or alert level excursions, consecutive alert level excursions, and single excursions with a common cause, such as ones that occur every time after preventive maintenance (PM). When an action limit is exceeded, root cause investigation, assessment of product impact (including batches between monitoring and reporting) and corrective and preventive action (CAPA) are required.
Balancing False Alarms and Missed Detections
If alarms are too strict, they go off every time a door opens or an operator moves, and nobody looks at them anymore. If they are too loose, real deviations are missed. Delay times are how this balance is struck.
- Differential pressure dips temporarily when doors open and close, so raise an alarm only if the condition persists for a set time
- For particles, distinguish single spikes from sustained rises
- However, the longer the delay time, the later a deviation is detected and the more lots are affected
Annex 1 requires that “if a delay time is used, it is assessed and justified within the CCS” because this delay time influences the impact on quality. At electronics plants, too, recording “why that value was chosen” matters. For example, store a data-based reason together with the setting, such as “During commissioning, records showed that drops in differential pressure caused by door operation recovered within a certain time, so the delay time was set to that value.” The value itself is something you determine from your own data, and this article does not give recommended values.
How to build notification targets, escalation and acknowledgment records for alarms is covered in detail in our article on RFP and acceptance design for equipment alarm notification systems. Annex 1 (Section 5.2) also requires that equipment monitoring requirements be defined in the URS (user requirement specification) and confirmed through qualification, that alarms be acknowledged and their trends evaluated, and that critical alarms be reviewed immediately.
Data Integrity – Audit Trail, Time Synchronization and Missing Data
Continuous monitoring data is used as “evidence” in customer audits and deviation investigations. Whether it holds up as evidence depends on the data not having been tampered with, the timestamps being correct, and any gaps being identifiable as gaps.
Audit Trail – 21 CFR Part 11 and EU GMP Annex 11
US FDA’s 21 CFR 11.10(e) requires, for electronic records subject to FDA regulation, secure, computer-generated, time-stamped audit trails that independently record the date and time of operator entries and actions that create, modify or delete electronic records. It also requires that record changes not obscure previously recorded information, and that audit trails be retained for at least as long as the subject electronic records and be available for agency review and copying.
The current version of EU GMP Annex 11 (Computerised Systems) is the January 2011 version. From 7 July to 7 October 2025, the European Commission and PIC/S jointly held a stakeholder consultation on draft revisions of Chapter 4 (Documentation) and Annex 11, and on a draft of a new Annex 22 on AI. An analysis by ECA Academy dated 30 July 2025 states that the draft revision of Annex 11 adds items such as alarms and their verification (non-erasable logs), IT security (firewalls, disaster recovery RTO/RPO, patching, penetration testing), data archiving, periodic system review, external IT providers and the URS. However, within the scope of this research as of October 2026, the final version of the revision has not been published. Annex 22 is also still at the draft stage. It is reasonable to treat the 2011 version as the current requirement and to view the draft revision as “the direction of travel.”
PIC/S guidance on data management and data integrity, PI 041-1, was adopted on 1 June 2021 and entered into force on 1 July 2021.
These are pharmaceutical GMP and FDA regulatory documents, but writing into a monitoring system RFP that “changes to set values, alarm acknowledgments and data corrections must be recorded in a non-erasable form showing who changed what, when, and from what to what” is effective at electronics plants too. It lets you answer when a customer auditor asks, “When was this alarm setting changed?”
Time Synchronization – A Prerequisite for Matching to Lots
To match environmental data against lot records by time, the clocks of the sensors, PLCs, monitoring server and MES must be aligned. If the clocks drift, you cannot correctly identify which lots were running at the time of a deviation. How to choose between NTP and PTP, and how to verify synchronization during acceptance testing, are covered in our article on implementing factory time synchronization.
Missing Data – Do Not Let “No Data” Become “No Problem”
Data will inevitably go missing because of communication outages, counter failures or units removed for calibration. The problem is that a period of missing data can look on a graph as if “nothing happened.” In the RFP, require that missing data be detected and raised as an alarm, that data be buffered on the gateway side and resent after recovery, and that periods of missing data be kept as records. For details, see our article on acceptance criteria for preventing sensor data loss.
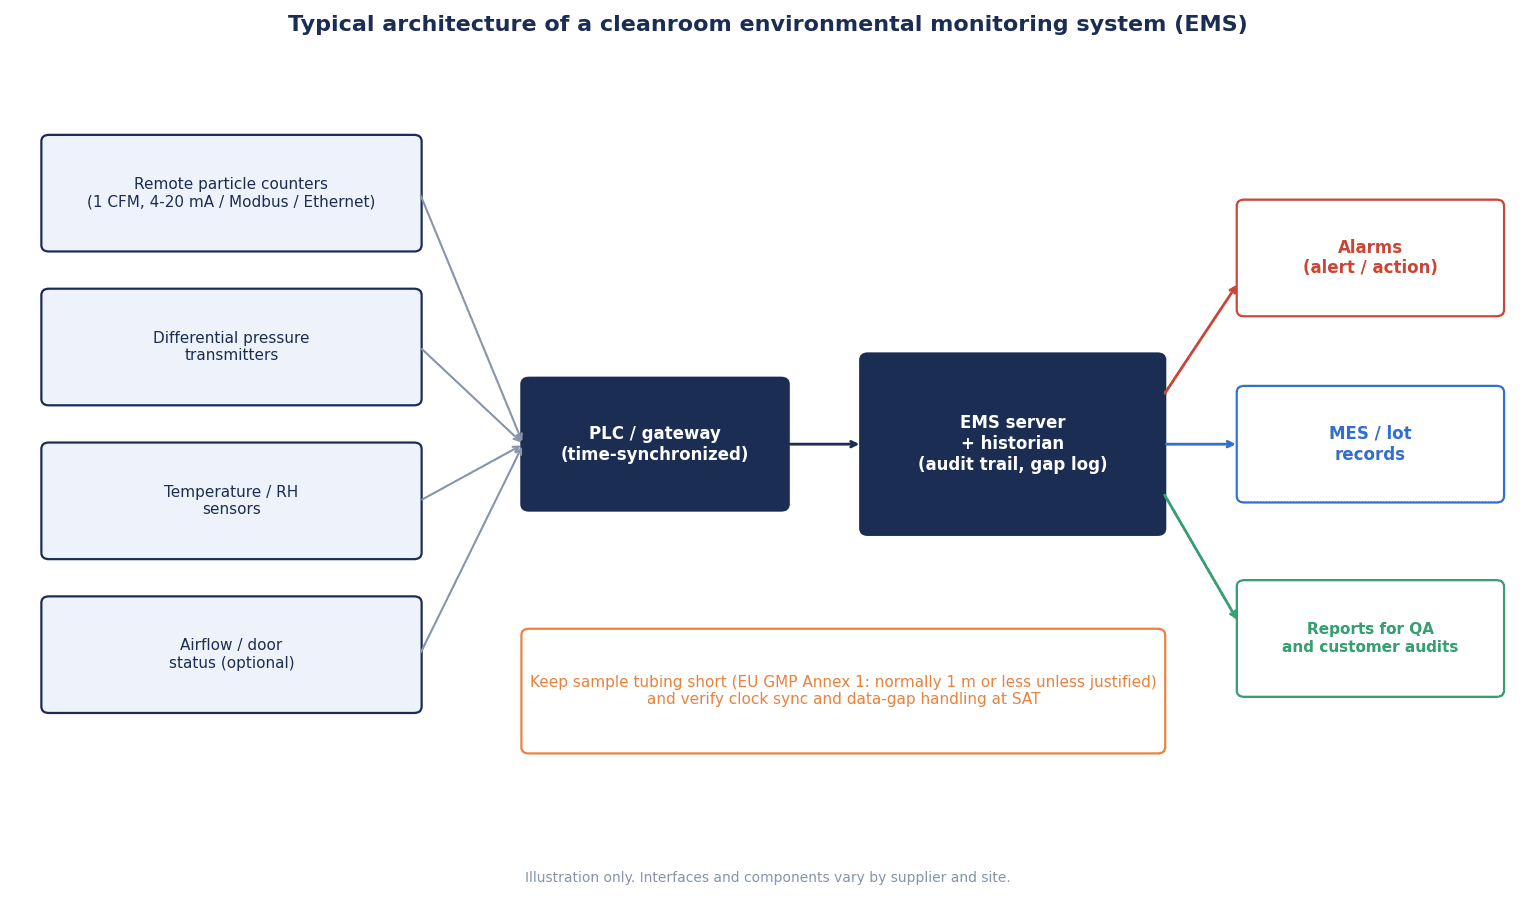
A typical architecture collects data from sensors and counters via PLCs or gateways into the environmental monitoring system (EMS) server and historian, sends alarm notifications, and links the data to lot records in the MES. For choosing a historian to handle long-term data storage and retrieval, see our article comparing industrial historians and preparing the RFP.
Linkage to Lots and Production Records Decides Payback
This is the core of the article’s argument. Even with continuous data, if it is not linked to lots, you cannot narrow down “which lots were affected” when a deviation occurs. If you cannot narrow it down, you end up putting a wide range on hold anyway, and the losses are no different from the days of manual measurement.
Steps to Identify Affected Lots from the Deviation Time
Here is the procedure, using a drop in differential pressure as an example. Times are shown as symbols.
- Detection: At time T1 the differential pressure falls below the alert level, and at time T2, after the delay time has passed, an alarm is raised. The system has recorded that “the deviation started at T1”
- Confirmation of recovery: At time T3 the differential pressure recovers. The deviation period can be identified as T1 to T3
- Lot extraction: From the MES production records, extract the lots in processes where product was exposed in that room between T1 and T3. Suppose lots A, B and C are applicable
- Impact assessment: Overlay the particle and temperature/humidity data for the same period. If the other parameters show no change, treat that as an indication that the impact is limited; if particles also rose, treat that as an indication of impact
- Containment: Put only lots A, B and C on hold and carry out any necessary re-inspection or re-cleaning. Lots before T1 and after T3 are released as normal, with the data as the basis
- Recording: Compile the deviation period, affected lots, basis for the decision and actions into a single record, and feed it into CAPA
With manual measurement, you cannot tell where between the previous reading and the current one the deviation started, so every lot in that interval comes under suspicion. With continuous monitoring and lot linkage, you can narrow the scope of suspicion to the deviation period alone. Annex 1’s inclusion of “batches between monitoring and reporting” in the impact assessment when an action limit is exceeded reflects the same idea.
Data Needed for Linkage
| Data | Where it comes from | Linkage key |
|---|---|---|
| Environmental data (particles, differential pressure, temperature/humidity) | EMS, historian | Timestamp, room (area) code |
| Alarm occurrence, acknowledgment, recovery | EMS | Timestamp, measurement point tag |
| Production records (start, end, equipment) | MES, equipment logs | Timestamp, lot number, room code |
| Product exposure status (opened, in transit, etc.) | Process definitions | Process code |
The key point is to share a common room (area) code between the EMS and the MES. If the EMS measurement point tag is “CR2-DP-03” while the MES process is managed under a different name such as “Cleanroom 2 Assembly Line,” matching has to be done by hand. How to build a setup that lets you produce records immediately in a customer audit is also covered in our article on traceability for customer audits.
Model Cost Estimate (Placeholder Figures)
Here we run a model estimate to see what actually drives payback on a continuous monitoring investment. All amounts, counts and hours below are placeholder figures set up for this article only. For a real decision, replace them with your own number of deviations, loss per deviation and measurement hours.
Model Assumptions
- One Japanese-affiliated electronic component plant in Thailand, with roughly 1,000 m² of ISO 7 to 8 cleanroom (the class and area are placeholders used to explain the assumptions and are not used to calculate the number of measurement points)
- Currency is Thai baht (THB). Labor cost is 350 THB/hour (placeholder)
- A “deviation event” is an event where an environmental deviation is found after the fact and lots have to be held, re-cleaned or re-inspected. Loss per event is 350,000 THB (placeholder)
Current State (Portable Measurement and Standalone Loggers)
| Cost item | Calculation | Annual amount (THB) |
|---|---|---|
| Manual measurement hours | 2 hours/day × 365 days = 730 hours, 730 × 350 | 255,500 |
| Organizing records for audits and reports | 20 hours/month × 12 = 240 hours, 240 × 350 | 84,000 |
| Deviation events | 6 per year × 350,000 | 2,100,000 |
| Total | 255,500 + 84,000 + 2,100,000 | 2,439,500 |
After Implementation (Continuous Monitoring System)
| Cost item | Calculation | Annual amount (THB) |
|---|---|---|
| Manual measurement hours (spot checks, periodic classification with portable counters) | 180 hours × 350 | 63,000 |
| Organizing records | 4 hours/month × 12 = 48 hours, 48 × 350 | 16,800 |
| Deviation events | 2 per year × 350,000 | 700,000 |
| Calibration, maintenance, software maintenance | Placeholder | 300,000 |
| Total | 63,000 + 16,800 + 700,000 + 300,000 | 1,079,800 |
Labor hours, record organization, deviation losses and maintenance are separate cost items, and no cost is counted twice.
Annual Net Effect and Payback Period
- Annual net effect: 2,439,500 − 1,079,800 = 1,359,700 THB/year
- Initial cost (placeholder): 3,200,000 THB
- Payback period: 3,200,000 ÷ 1,359,700 ≈ 2.4 years
Breaking down the net effect makes the structure clear.
| Component of the effect | Calculation | Annual amount (THB) |
|---|---|---|
| Reduction in manual measurement hours | 255,500 − 63,000 | 192,500 |
| Reduction in record organization | 84,000 − 16,800 | 67,200 |
| Reduction in deviation events (6 to 2) | 2,100,000 − 700,000 | 1,400,000 |
| Increase in calibration, maintenance, software maintenance | — | −300,000 |
| Net effect | 192,500 + 67,200 + 1,400,000 − 300,000 | 1,359,700 |
The reductions in labor hours and record organization together come to 192,500 + 67,200 = 259,700 THB, and most of the net effect comes from the reduction in deviation events.
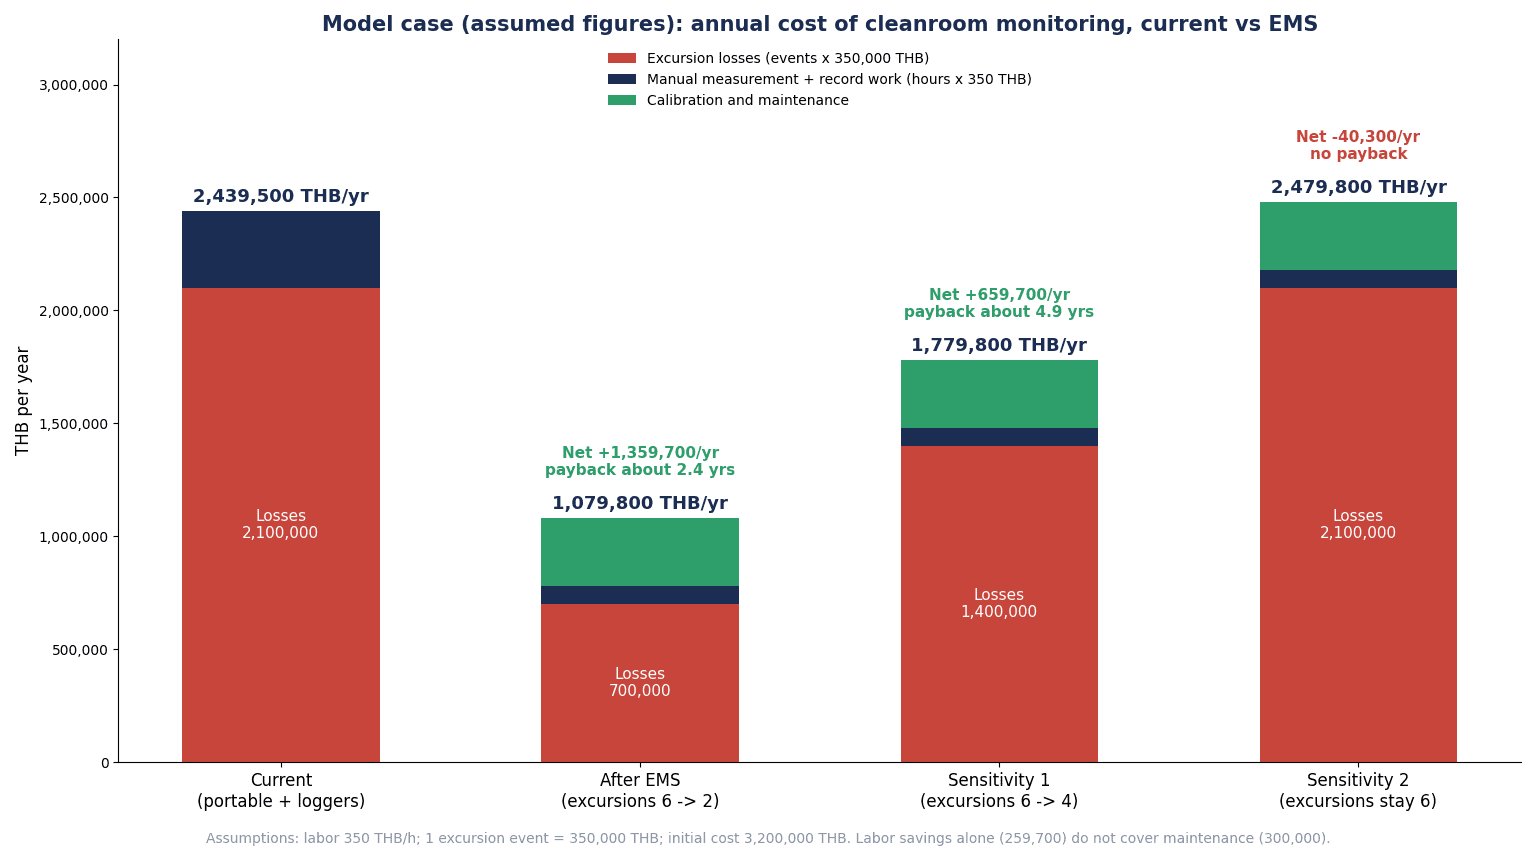
Sensitivity 1 – Deviation Events Fall Only from 6 to 4
- After implementation: 63,000 + 16,800 + 1,400,000 (4 × 350,000) + 300,000 = 1,779,800 THB/year
- Net effect: 2,439,500 − 1,779,800 = 659,700 THB/year
- Payback period: 3,200,000 ÷ 659,700 ≈ 4.9 years
Sensitivity 2 – Deviation Events Do Not Fall (Labor Savings Only)
- After implementation: 63,000 + 16,800 + 2,100,000 + 300,000 = 2,479,800 THB/year
- Net effect: 2,439,500 − 2,479,800 = −40,300 THB/year
- Because the 259,700 THB reduction in labor hours and record organization is less than the 300,000 THB for calibration, maintenance and software maintenance, the investment does not pay back in this case
| Case | Deviation events | Annual amount after implementation (THB) | Net effect (THB/year) | Payback period |
|---|---|---|---|---|
| Base | 6 to 2 | 1,079,800 | 1,359,700 | About 2.4 years |
| Sensitivity 1 | 6 to 4 | 1,779,800 | 659,700 | About 4.9 years |
| Sensitivity 2 | 6 to 6 | 2,479,800 | −40,300 | No payback |
How to Read the Estimate
What this estimate shows is that payback is decided not by labor savings, but by early detection of deviations and containment of lots. If you simply attach sensors and watch graphs, and neither the number of deviations nor the loss per deviation changes, calibration and maintenance costs can exceed the labor savings, and you can run at a loss every year. Conversely, if alarm design and lot linkage let you contain deviations early and keep them small, the payback period becomes shorter. Before making the investment decision, we recommend taking stock of how many environmental deviations in the past led to lot holds at your plant, and what they cost.
What This Estimate Does Not Include
- Customer audit findings and the impact on business relationships
- Costs and benefits related to regulatory compliance
- Benefits from optimizing energy (air conditioning, HVAC)
- Costs of reclassification needed when cleanrooms are expanded
Items to Confirm in the RFP
When asking vendors for proposals, write what must be achieved rather than equipment model numbers. Use the following 12 items as a guide.
| No. | Item | Example of what to write in the RFP |
|---|---|---|
| 1 | Measurement point list and rationale | Measurement points, parameters and frequencies for each room. Attach the risk assessment results and also require a procedure for adding or changing points |
| 2 | Particle specification | Size channels (0.5 µm, 5 µm, etc.), sample flow rate, remote or manifold |
| 3 | Tubing | Tubing length, inner diameter, number of bends and bend radius shown on drawings. An evaluation where runs exceed 1 m |
| 4 | Differential pressure sensors | Range and accuracy relative to the pressure to be monitored, reference room, port location |
| 5 | Temperature and humidity sensors | Accuracy relative to the control range, installation position, calibration method |
| 6 | Calibration | Calibration certificates compliant with ISO 21501-4 for particle counters. Handling of spare units during calibration |
| 7 | Alarms | Two tiers (alert and action), delay times, notification targets and escalation, acknowledgment records |
| 8 | Audit trail | Changes to set values, alarm acknowledgments and data corrections recorded in a non-erasable form showing who changed what and when |
| 9 | Time synchronization | Synchronization method for all devices and the allowable offset. Monitoring of drift |
| 10 | Missing data | Detection of and alarms for missing data, buffering and resending, records of missing periods |
| 11 | Lot linkage | Common room codes, integration method with the MES, a report that outputs affected lots from a deviation period |
| 12 | Testing and documentation | FAT/SAT procedures and acceptance criteria, and for pharmaceutical plants a full set of qualification documents |
Also confirm the relationship with existing equipment and systems. Making clear at the RFP stage whether existing differential pressure gauges and temperature/humidity loggers will be connected or replaced, and how the system will integrate with the MES and historian, makes proposals easier to compare.
How to Run FAT/SAT and Qualification
FAT – Verifying Functions at the Vendor’s Site
FAT (factory acceptance test) is testing that verifies software and system functions at the vendor’s factory or in a test environment.
| Check item | Example of what to verify |
|---|---|
| Data acquisition | With simulated signals injected, do displayed and recorded values match? |
| Alarms | Do the two levels and delay times work as specified? Are acknowledgment and recovery records kept? |
| Audit trail | Are setting changes and data corrections recorded with the person, date and time, and before and after values, and are they non-erasable? |
| Access rights | Are users without the right permissions prevented from changing settings? |
| Missing data | When communication is cut, is a missing-data alarm raised, and is data resent after recovery? |
| Reports | Can environmental data and alarm history be output for a specified period and room? |
SAT – Verifying Installation and Communication on Site
SAT (site acceptance test) is testing carried out with the system installed in the actual cleanroom.
| Check item | Example of what to verify |
|---|---|
| Measurement points | Do the positions and tag names of measurement points match the plan and drawings? |
| Tubing | Do tubing length and bends match the drawings? |
| Sensor values | Compared with calibrated reference instruments, are differential pressure and temperature/humidity values within tolerance? |
| Communication | Does data from all measurement points arrive without interruption? |
| Time | Are each device’s clocks aligned with the server and MES? |
| Missing data | Cut communication on the site network and reconfirm detection of missing data and resending |
| Lot linkage | When a simulated deviation period is specified, are the applicable lots correctly extracted? |
IQ/OQ/PQ for Pharmaceutical Plants
At plants involved in pharmaceuticals or medical devices, it is common to document, in addition to FAT/SAT, within the framework of IQ (installation qualification), OQ (operational qualification) and PQ (performance qualification). As mentioned above, PIC/S brought its recommendation document on qualification and validation, PI 006-4, into force on 1 October 2026, replacing the previous PI 006-3. How far FAT/SAT results can be used as qualification evidence, and which documents are needed, should be confirmed with your quality assurance department, the regulatory authorities and your customers.
Frequently Asked Questions
What is cleanroom environmental monitoring?
It is a system for continuously measuring and recording airborne particles, differential pressure, temperature/humidity, air velocity and so on, in order to show that a cleanroom’s cleanliness is being maintained day to day at the state it was classified in. ISO 14644-2:2015 requires that a monitoring plan be created, implemented and maintained based on a risk assessment grounded in the intended use.
How many particle counters are needed?
The standards do not set a uniform number of units. The number of points for classification is determined from the area using Table A.1 of ISO 14644-1:2015, but the number of points for continuous monitoring is decided through risk assessment. One possible combination is to install remote counters permanently at critical points, such as where product is exposed or where deviations have occurred in the past, and to cover many less critical points in rotation with a manifold system. At points handling ≥5 µm particles, pay attention to tubing length.
How much differential pressure does a cleanroom need?
For sterile pharmaceutical manufacturing, EU GMP Annex 1 (2022) sets a minimum of 10 Pa between adjacent rooms of different grades (guidance value). This value applies to Grade A to D areas in sterile pharmaceutical manufacturing and is not an obligation for electronic component plants. At electronics plants, the required differential pressure is decided by customer requirements or internal standards. In either case, confirm with your quality assurance department and your customers.
What is an ISO 14644-2 monitoring plan?
It is a document, based on risk assessment, that sets out the parameters, measurement points, frequencies, alert and action levels, and the response to deviations. Reclassification is once a year as a rule, and the interval can be extended based on risk assessment. Supporting tests such as differential pressure, air velocity/volume and temperature/humidity are also considered in the plan.
What does continuous monitoring cost?
It varies widely with the number of measurement points, the particle counter configuration and the scope of integration with existing systems. The placeholder estimate in this article used an initial cost of 3,200,000 THB and 300,000 THB/year for calibration, maintenance and software maintenance, but these are figures for illustration only. When looking at cost, consider not only labor savings but also how much the number of deviation events and the loss per event will fall. Labor savings alone may not pay back the investment.
Can existing differential pressure gauges and loggers be reused?
Differential pressure gauges and sensors with outputs such as 4 to 20 mA can in some cases be brought in via a gateway or PLC. However, you need to check whether the range and accuracy suit the differential pressure you want to monitor, whether calibration records exist, and whether their time can be synchronized. Visual-only gauges with no output, and loggers that only record on their own, are not suited to continuous monitoring and alarms.
What should be checked at FAT/SAT?
At FAT, check data acquisition, the two alarm levels and delay times, the audit trail, access rights, behavior when data is missing, and report output. At SAT, check that measurement points and tubing match the drawings, that sensor values agree with reference instruments, and that communication, time, resending of missing data and lot extraction work correctly on site. Set the acceptance criteria at the RFP stage.
Summary
- A cleanroom environmental monitoring system will not pay back if it is treated as a way to attach sensors and watch graphs. What decides payback is a design that detects deviations while the process is running, and identifies and contains affected lots by timestamp
- ISO 14644-1:2015 is the “classification” standard and ISO 14644-2:2015 is the “monitoring” standard. Each company decides its monitoring plan based on risk assessment, and reclassification is once a year as a rule, extendable through risk assessment
- The values in EU GMP Annex 1 (2022, applicable from 25 August 2023) apply to Grade A to D areas in sterile pharmaceutical manufacturing, and electronics plants use them as a reference for the most demanding practice. It sets out a minimum of 10 Pa differential pressure (guidance value), continuous recording of critical differential pressures, immediate warnings and justified delay times
- Particle counter tubing greatly lowers the transport efficiency of ≥5 µm particles. Write length, bends and inner diameter into the specification and confirm them at SAT
- The audit trail, time synchronization and the handling of missing data are prerequisites for using data as evidence. The 2011 version of EU GMP Annex 11 is current, and within the scope of this research as of October 2026, no final version of the draft revision consulted on in 2025 has been published
- In the placeholder estimate, the investment pays back in about 2.4 years if deviation events fall from 6 to 2, but it does not pay back if deviations do not fall and only labor is saved
- Writing the rationale for measurement points, the alarm design, data integrity and lot linkage into the RFP and the FAT/SAT acceptance criteria is the shortest route to turning the investment into payback
TOMAS TECH helps plants in Thailand design and implement systems that connect environmental monitoring sensors, PLCs, historians and MES for their cleanrooms. We are also happy to talk at the stage before choosing equipment, for example when reviewing existing measurement points or organizing RFP items and acceptance criteria. Please get in touch through our contact form.
References
- European Commission – EU GMP Annex 1 Manufacture of Sterile Medicinal Products (22 August 2022)
- European Commission – EudraLex Volume 4
- PIC/S – Entry into force of the revised Annex 1 (PE 009-17) (August 2023)
- PIC/S – List of member authorities
- PIC/S – Revision of Recommendations on Qualification and Validation PI 006-4 (published 30 July 2026, in force 1 October 2026)
- PIC/S – News
- PIC/S – Joint stakeholder consultation on Chapter 4, Annex 11 and Annex 22 (7 July 2025)
- PIC/S – Adoption and entry into force of PI 041-1 (2021)
- PIC/S – Publications
- ECA Academy – Annex 11 Draft First Analysis (30 July 2025)
- Cornell LII – 21 CFR 11.10 Controls for closed systems
- cleanroom.net – ISO 14644-1 maximum concentrations by class
- cleanroom.net – Area and minimum number of sampling locations
- PharmOut – Explanation of the ISO 14644-1:2015 revision
- PharmOut – Explanation of the ISO 14644-2:2015 revision
- reinraum.de – Changes in ISO 14644-1/2/3 (13 October 2016)
- Beckman Coulter – Application note on classifying a small cleanroom
- Beckman Coulter – The effects of tubing length on airborne particulate sampling
- Particle Measuring Systems – ISO 21501-4 calibration requirements
- Particle Measuring Systems – Explanation of ISO/TR 14644-21
- Bioprocess Online – Explanation of ISO 14644-21:2023 (11 September 2023)
- Pharmaceutical Online – Example specification of a permanent remote particle counter
- Example differential pressure transmitter datasheet (B211082EN-K)
- ESD Association – Does an ESD control program require humidity controls? (1 August 2024)
- TechNode Global – Thailand’s national semiconductor strategy (25 September 2026)
- The Nation – Thailand as a PCB production base (23 February 2026)
- The Nation – BOI investment applications from Japan in 2025 (2 February 2026)
- Automotive World – Infineon opens back-end plant in Thailand (October 2026)
- Global Banking and Finance Review – Scale of Infineon’s Thailand plant


