


Most factories can detect a defect within minutes. Working out what caused it is a completely different problem. This article walks through in-process defect tracing at the shot level, using a model injection-molding factory in Rayong, and shows why lot-level barcode management alone never pays back. Every figure below is a model estimate, not measured data.
What In-Process Defect Tracing Is and Why Finding a Defect Differs From Finding Its Cause
In-process defect tracing means linking each defective part back to the exact process conditions under which that specific part was made. In injection molding, the unit of production is the shot, meaning one single molding cycle. Shot-level tracing records the barrel temperature, injection pressure, holding pressure and holding time of that individual cycle, then binds those values to the part that came out of the mold. Lot-level tracing, by contrast, records only which lot a part belonged to, which machine ran that lot, and on what day.
The distinction sounds academic until a defect appears. Detection and root-cause identification are two separate capabilities, and most factories have invested heavily in the first while leaving the second on paper. An analysis published on August 13, 2026 by HumbleOps on defect investigation software makes the same point from the data side. Automated optical inspection and statistical process control can flag a defect within minutes, but tracing that defect back through process changes, material lots and parameter drift routinely takes days to weeks. The gap between minutes and weeks is not an inspection problem. It is a data-linkage problem.
Put plainly, a factory can be excellent at detection and still be helpless at causation. The inspection line stops the bad part from shipping, which is the visible win. What stays invisible is the interval between “we found it” and “we know why, and we know exactly which other parts are affected”. That interval is where the money goes.
There is a well-established general principle here. Guidance such as this manufacturing traceability guide from MP of Cincinnati describes traceability as the mechanism that connects a defect to its raw material batch, equipment, operator and shift, which is what turns root cause analysis from speculation into something demonstrable. The question this article asks is how fine that connection has to be before the speculation actually stops.
If your immediate concern is the downstream use of inspection results rather than the upstream link to process conditions, our article on AI analysis of visual inspection data covers what to do with detection data once you have it. This article deals with the step before that, which is making the detection data point at something.
Why Root Cause Identification Takes Days Even When Detection Takes Minutes
To make this concrete, we use a model factory throughout. These are assumptions built for the calculation, not measurements from a real site.
| Item | Setting |
|---|---|
| Location | Rayong Province, Thailand |
| Industry | Japanese-owned resin molding parts factory, injection molding for automotive interior parts |
| Machines | 20 |
| Lot definition | One lot equals one machine’s output for one day, averaging 2,000 pieces |
| Current state | Managed at lot level by barcode only, with no link to shot-level molding conditions |
The current state is worth reading twice. The factory knows which lot a defective part came from, which machine produced that lot, and which day. It does not know which of the roughly 2,000 shots in that lot were made under drifting conditions. That single missing link produces two consequences, and both cost money every year.
The first consequence is the isolation range. When a defect is confirmed and the cause is unknown, there is no defensible way to narrow the suspect population below the lot boundary. The entire lot of 2,000 pieces gets 100 percent sorted, because the alternative is shipping parts that might share the same defect mechanism. The second consequence is investigation time. Engineers reconstruct the timeline manually from paper production logs and inspection records, cross-checking shift handovers and material lot changes against a defect they can only place within a 24-hour window.
Here is the annual cost of that situation in the model factory, before any traceability investment at all.
| Item | Annual cost in THB | Basis |
|---|---|---|
| Full-lot sorting labor | 720,000 | 15 THB per piece, 2,000 pieces per lot, 24 occurrences per year |
| Engineer investigation time | 672,000 | 3.5 days, 8 hours, 2 engineers, 500 THB per hour, 24 occurrences |
| Customer claim escalation | 135,000 | 3 of the 24 occurrences escalate, 45,000 THB per case |
| Total | 1,527,000 |
The 24 occurrences per year come from 20 machines at 1.2 defect-lot events per machine per year, and the 3.5 days is the average time engineers need to work backwards through paper records to a defensible cause. Note the shape of this table. The sorting cost and the engineering cost are both direct consequences of not knowing which shots are implicated. Together they account for 1,392,000 THB of the 1,527,000 THB total, which is 91 percent of the annual loss. The customer claim line, the one that gets management attention, is the smallest of the three.
This is the point at which most improvement plans reach for barcodes. Our article on the cost of building a traceability system lays out that general build in a four-layer cost model with a 90-day roadmap, and it is the right starting point if you have no electronic traceability at all. This article goes one step further and tests whether that starting point, on its own, actually moves the two numbers above.
Why Lot-Level Management Alone Is Not Enough
Scenario A is the plan that gets proposed in almost every kickoff meeting. Add barcode or QR labeling and scanning at each machine, build a lot management system on top, and stop there. No connection is made to shot-level molding conditions.
| Item | Amount in THB | Basis |
|---|---|---|
| Labeling and scanning equipment | 300,000 | 20 machines at 15,000 THB |
| System setup | 250,000 | One-time lot management system build |
| Total investment | 550,000 | |
| Annual operating cost | 50,000 | Label consumables and system maintenance |
Now the uncomfortable part. What does this investment actually change? It improves the accuracy with which the factory can state which lot was produced when and on which machine. That is real, and it slightly accelerates the initial response when a customer calls. In the model, claim escalation cost falls from 135,000 THB to 100,000 THB per year, a saving of 35,000 THB.
What it does not change is anything driven by not knowing the shot. Since nobody can tell which shots inside the lot were made under abnormal conditions, the isolation range stays at the full 2,000 pieces and the sorting cost stays at 720,000 THB. Investigation time moves from 3.5 days to about 3.0 days, essentially flat, because the engineers are still reconstructing conditions rather than reading them. The 672,000 THB engineering line barely moves.
So the arithmetic is 35,000 THB of annual effect against 50,000 THB of annual operating cost. The net benefit is negative 15,000 THB per year. There is no payback period, because the plan never gets back to zero. A factory can execute Scenario A flawlessly, label every part, scan at every station, and end up marginally worse off than before, while the 1,392,000 THB that actually hurts sits completely untouched.
This is not an argument against lot traceability. Lot traceability is often mandatory for customer and regulatory reasons, and it is the substrate everything else sits on. It is an argument against expecting it to solve a problem it was never structured to solve.
Going Down to the Shot Level

Scenario B keeps the lot layer and adds the missing link. For each of the 20 machines, a shot counter and process data collection unit records the molding conditions of every individual cycle, and those records are bound to the parts through the MES and QMS. When a defect is confirmed, the question stops being “which lot was this in” and becomes “which shots were made under the condition that produced this defect”.
| Layer | Content | Amount in THB | Share | Basis |
|---|---|---|---|---|
| Layer 1 | Shot counters and process data collection units | 900,000 | 38.30% | 20 machines at 45,000 THB |
| Layer 2 | Installation, wiring and PLC connection | 240,000 | 10.21% | 20 machines at 12,000 THB |
| Layer 3 | MES and QMS data integration | 650,000 | 27.66% | One-time software build |
| Layer 4 | Marking system for machine and shot number | 380,000 | 16.17% | One-time labeling and marking equipment |
| Layer 5 | Training and operating documentation | 180,000 | 7.66% | One-time |
The total investment is 2,350,000 THB, and shares may not sum to exactly 100 percent because of rounding. Annual operating cost is 180,000 THB, made up of 60,000 THB in device maintenance at 3,000 THB per machine and 120,000 THB in system licensing and maintenance.
Two observations about this breakdown. First, hardware is only 38.30 percent of the spend. Layers 3 through 5 have no physical presence, and they are the first items cut when a quotation gets negotiated, but each one is load-bearing. Skip Layer 3 and you have shot data sitting in a machine-side buffer that nobody can join to a defect record. Skip Layer 4 and you can identify the suspect shots in the database but cannot physically pick those parts out of a tray. Skip Layer 5 and the shop floor keeps sorting whole lots out of habit because nobody trusts the narrowed range. Cutting a layer that carries effect leaves the investment intact and the benefit gone.
Second, the same architecture appears in other industries with different unit counts. Our article on electronics traceability systems covers the electronics version, where the in-process units being tracked are structured differently but the underlying logic is identical. Granularity of the traced unit, not the sophistication of the software, is what determines how far the isolation range can shrink.
Comparing Payback
Scenario A
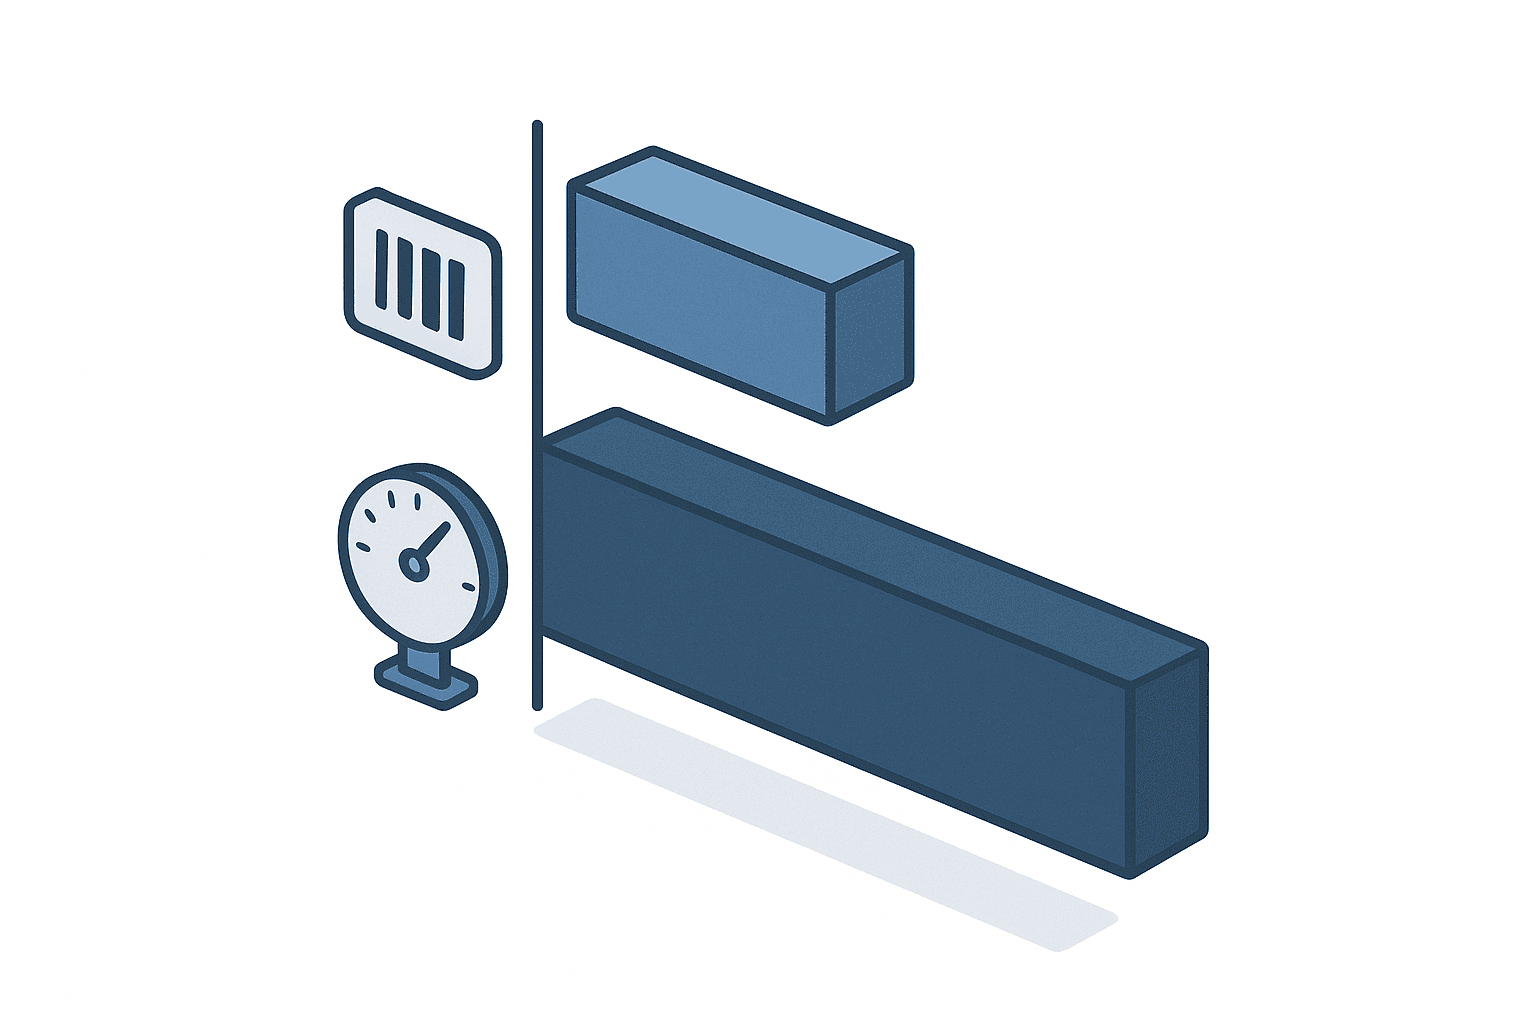
Investment of 550,000 THB, annual operating cost of 50,000 THB, annual effect of 35,000 THB. Net benefit is negative 15,000 THB per year. No payback.
Scenario B
Investment of 2,350,000 THB, annual operating cost of 180,000 THB. The annual effect has three components, each tied to a specific mechanism.
| Effect | Amount in THB | Mechanism |
|---|---|---|
| Sorting cost reduction | 666,000 | Isolation range falls from 2,000 pieces to an average of 150, leaving a residual sorting cost of 54,000 THB |
| Engineer time reduction | 576,000 | Root cause identification falls from 3.5 days, or 28 hours, to 4 hours, leaving a residual of 96,000 THB |
| Claim escalation reduction | 90,000 | Escalated cases fall from 3 to 1 per year, leaving a residual of 45,000 THB |
| Total | 1,332,000 |
Net benefit is 1,332,000 THB minus 180,000 THB, or 1,152,000 THB per year. Payback is 2,350,000 THB divided by 1,152,000 THB, which is 2.04 years, roughly 24.5 months.
The Core Contrast
| Item | Scenario A, lot only | Scenario B, shot level |
|---|---|---|
| Investment in THB | 550,000 | 2,350,000 |
| Annual operating cost in THB | 50,000 | 180,000 |
| Annual effect in THB | 35,000 | 1,332,000 |
| Net benefit in THB | -15,000 | 1,152,000 |
| Payback | None | 2.04 years |
Scenario B costs 4.27 times as much as Scenario A. And Scenario B is the one that pays back. The cheaper plan does not have a longer payback period, it has no payback period at all, because its net benefit never crosses zero.
The reason is visible in the effect column. Scenario A addresses only the smallest of the three loss items, the claim escalation line, and addresses it partially. Scenario B attacks the two items that make up 91 percent of the loss, and it can only attack them because the isolation range and the investigation time both depend on knowing which shots are implicated. No amount of discipline applied to lot-level records produces that knowledge. This is the counter-intuitive result worth carrying into your own budget meeting. Doing the cheap version of the right idea is not a smaller version of the benefit. It can be no benefit.
Sensitivity Analysis
The 2.04-year payback rests on three assumptions, and each could turn out optimistic. Rather than applying one blanket discount factor across all effects, which would distort the result, each case below breaks exactly one assumption and leaves the others intact.
| Case | Broken assumption | Annual effect in THB | Net benefit in THB | Payback |
|---|---|---|---|---|
| Base | As modeled | 1,332,000 | 1,152,000 | 2.04 years |
| Case 1 | Isolation narrows only to 400 pieces, not 150 | 1,242,000 | 1,062,000 | 2.21 years |
| Case 2 | Investigation falls only to 1.5 days, not 4 hours | 1,140,000 | 960,000 | 2.45 years |
| Case 3 | Escalated claims fall only from 3 to 2, not to 1 | 1,287,000 | 1,107,000 | 2.12 years |
In Case 1, the residual sorting cost becomes 144,000 THB instead of 54,000 THB, so the sorting reduction drops from 666,000 THB to 576,000 THB. Payback extends from 2.04 years to 2.21 years. In Case 2, the residual engineering cost becomes 288,000 THB, so that reduction drops from 576,000 THB to 384,000 THB and payback extends to 2.45 years. In Case 3, the residual claim cost becomes 90,000 THB and payback extends to 2.12 years.
Case 2 is the one to watch, since investigation time is the assumption with the most leverage on the result. It is also the assumption most dependent on execution quality rather than physics. Four hours to root cause is achievable when the shot record is queryable next to the defect record. It is not achievable if Layer 3 was descoped and someone has to export machine data to a spreadsheet before the analysis can start.
The broader observation is that all three cases still land between 2.04 and 2.45 years. The conclusion is robust to assumptions being wrong by a wide margin, which is not something that can be said of Scenario A under any assumption at all.
Statistical process control gives you a way to detect the drift before it becomes a defect lot. Practitioner guidance published on May 17, 2026 by a Japanese manufacturing media outlet, in an article on reducing in-process defects, describes a process capability index of Cpk 1.33 as a common working benchmark, with some industries prioritizing improvement on any process running below Cpk 1.67. The same article positions 5 Whys analysis as a tool for finding gaps in the system rather than assigning blame to individuals. Shot-level data is what lets SPC operate on the actual process variable instead of on the inspection result, which is a step earlier in the chain.
How This Relates to IATF 16949 and Customer Audits
Thailand is the densest automotive supply base in Southeast Asia. Distribution data from IATF Global Oversight as of January 2026 puts Thailand at 2,083 IATF 16949 certified sites, ahead of Vietnam with 970, Malaysia with 658 and Indonesia with 517. If you supply automotive parts from Thailand, you are operating inside an audit culture, not adjacent to one.
Shot-level tracing changes what you can put in front of an auditor or a customer quality engineer. Lot-level records answer the question of what you shipped. Shot-level records answer the question of what you did about it, with the process conditions of the specific parts attached. When a containment action is challenged, the difference between “we sorted the whole lot because we could not narrow it” and “we isolated 150 pieces produced under the condition we identified” is the difference between a controlled process and a process with a control gap that happened to be covered by brute force.
We should be careful about the standard itself. The IATF Rules 6th edition took effect on January 1, 2025, and a substantial revision to the IATF 16949 standard is reported as expected in late 2026 through 2027. As of August 2026 the formal effective date is not confirmed, so treat the revision as a planning input rather than a deadline, and check the IATF Global Oversight official site for the authoritative position.
For the audit-design side of traceability specifically, our article on automotive parts traceability under IATF 16949 goes into the requirement mapping in detail, and that is the better resource if audit readiness rather than investigation speed is your primary driver. The adjacent question of how fast you can physically produce records once they are requested is covered in our article on digitizing audit response records. Note that these are different objectives. Time-to-evidence is about satisfying an external party. Time-to-root-cause, the subject of this article, is about your own quality loop, and the two justify investment differently.
What to Watch For When Implementing This in a Thailand Factory

The calculation above assumes something specific about your equipment, and it is the first thing to verify. The model assumes injection molding machines whose PLC or controller can output shot-level data externally, which is typical of relatively recent machines. Older machines without external output capability will require retrofit work, and that cost is not in the 2,350,000 THB figure. Before you evaluate any of these numbers against your own site, walk the floor and establish, machine by machine, whether shot data can leave the controller at all. A plant with a mixed fleet may find that the practical scope is 12 machines rather than 20, which changes both the investment and the effect.
The second screening question is frequency. The model factory has 24 defect-lot events per year. A factory experiencing only a handful of such events annually has proportionally less to recover, and the payback stretches accordingly. In that situation, in-process tracing should not be at the top of the investment queue, and it is more honest to say so than to build a business case on an event rate that does not occur. Count your actual events for the past twelve months before anything else.
Third, plan the physical marking, not just the data. Layer 4 exists because a database that identifies 150 suspect shots is useless if the operator on the floor cannot tell those 150 parts from the other 1,850 in the tray. In a Thai factory with multilingual shift teams, the marking and the sorting instruction have to be unambiguous without a translation step. This is also where Layer 5 earns its budget, since the entire benefit of a narrowed isolation range disappears the moment a supervisor decides to sort the whole lot anyway because the narrowed range is not trusted.
Fourth, expect the organizational conversation about who owns the data. Shot-level records make individual machine performance visible in a way that lot-level records do not. That visibility is the point, but it needs to be introduced as a process improvement instrument rather than as a monitoring tool aimed at operators, which is the same reasoning behind using 5 Whys to find system gaps instead of individual fault.
Summary and the One Number to Measure First
The core finding from the model factory is that detection and causation are separately funded capabilities, and that a lot-level barcode system funds neither of them well. Scenario A, at 550,000 THB, produces a negative annual net benefit of 15,000 THB and never pays back. Scenario B, at 2,350,000 THB and 4.27 times the cost, produces 1,152,000 THB in annual net benefit and pays back in 2.04 years. Under all three sensitivity cases it still pays back between 2.21 and 2.45 years.
If you measure only one number before deciding anything, measure the average number of days between defect confirmation and a defensible root cause. In the model factory it is 3.5 days. That single figure, multiplied by your engineer hourly cost and your annual defect-lot event count, gives you the engineering half of the loss immediately. Then multiply your annual event count by your typical lot size and your per-piece sorting cost, and you have the sorting half. Those two numbers together are 91 percent of the model factory’s annual loss, and they are the only two that shot-level tracing is designed to attack.
Everything else in this article is arithmetic on top of those two measurements. Replace our assumptions with your figures and the tables recalculate themselves.
Talk to Us Before You Commit to a Scope
Whether shot-level tracing makes sense at your site depends on things that cannot be determined from a catalog, namely whether your machines can output shot data at all, how many defect-lot events you actually have, and how much of your current isolation range is genuinely irreducible. TOMAS TECH supports Japanese-owned factories in Thailand with production management and OT and IoT implementation, and we are happy to talk at the exploratory stage, before any decision has been made. If you only want a second opinion on your own numbers plugged into the tables above, that is a perfectly good reason to get in touch. Contact us whenever it is useful.
Frequently Asked Questions
What is the difference between in-process defect tracing and lot traceability?
Lot traceability records which lot a part belonged to, which machine produced it and on which day. In-process defect tracing goes one level finer and records the molding conditions of the individual shot, then binds those conditions to the part. The practical difference shows up in containment. With lot traceability the suspect population is the whole lot, 2,000 pieces in our model factory. With shot-level tracing it averages 150 pieces, because you know which cycles ran under the condition that produced the defect.
How much does in-process defect tracing cost to implement?
In the model factory of 20 injection molding machines, the total is 2,350,000 THB. That breaks down into 900,000 THB for shot counters and process data collection units, 240,000 THB for installation and wiring, 650,000 THB for MES and QMS integration, 380,000 THB for the marking system and 180,000 THB for training and documentation. Annual operating cost is 180,000 THB. Hardware is only 38.30 percent of the investment, which surprises most people planning this for the first time.
Is lot-level barcode management on its own insufficient?
For traceability compliance it may be sufficient. For root cause identification it is not. In the model factory, adding lot-level barcode management alone costs 550,000 THB with 50,000 THB in annual operating cost, and delivers 35,000 THB in annual benefit, giving a net benefit of negative 15,000 THB per year. The sorting cost of 720,000 THB and the engineering cost of 672,000 THB are essentially unchanged, because neither depends on knowing the lot. Both depend on knowing the shot.
Can data be collected from existing molding machines and PLCs?
Often yes, but this must be verified machine by machine before budgeting. The calculation in this article assumes relatively recent machines whose PLC or controller can output shot-level data externally. Older machines without that capability may need retrofit work, and that cost is not included in the 2,350,000 THB figure. Start by confirming, for each machine in scope, whether shot data can be read out at all, because that determines your real project scope more than any other factor.
Do auditors give credit for in-process tracing records under IATF 16949?
Shot-level records strengthen the containment and corrective action story rather than satisfying a specific clause by themselves. When you can show that a defect was traced to identified process conditions and that containment was scoped to the parts produced under those conditions, you are demonstrating process control rather than compensating for its absence with 100 percent sorting. Thailand had 2,083 IATF 16949 certified sites as of January 2026, so this is a well-populated audit environment, and a substantial revision to the standard is reported as expected in late 2026 through 2027 without a confirmed effective date as of August 2026.
References
- Defect investigation software and the detection-to-investigation gap, HumbleOps, published August 13, 2026
- Reducing in-process defects with SPC, Cpk benchmarks and 5 Whys analysis, manufacturing media operated by e-muni Inc., published May 17, 2026, Japanese-language source
- Traceability in manufacturing guide, MP of Cincinnati, accessed August 2026
- IATF 16949 quality standard supplier guide for Southeast Asia, Alibaba Seller, certified-site counts sourced from IATF Global Oversight distribution data as of January 2026
- IATF 16949 news on the 2025 Rules and expected 2026 changes, Smithers, published April 2026
- IATF Global Oversight official site, accessed August 2026


