



“Could you give us a list of the IoT sensor types we could install in the plant?” A good number of the enquiries we receive from Japanese-owned factories in Thailand begin exactly like this. Yet handing over a list of sensor categories rarely moves the selection forward. What actually determines the sensor is not the category but the time resolution of the decision you want to make, in other words the sampling cycle. If you start from a catalogue before you have fixed the cycle, you end up with visualization that measures everything and decides nothing. In this article we organize sensors into four time tiers and go as far as a five-year total cost estimate for a 30-point installation.
Why Factory IoT Sensor Selection Spins Its Wheels: “Type” Is Not a Selection Axis
Staring at a Catalogue List of Sensor Types Decides Nothing
If we line up the categories commonly cited as representative IoT sensors, we get temperature and humidity, pressure, open/close, illuminance, acceleration, human presence, position, CO2, water level, current, and odour (Sanshin Electronics). The selection criteria cited alongside them are measurement accuracy, measurement frequency (once a minute or once an hour), durability (waterproof and dustproof, shock resistant), and communication method (Wi-Fi, Bluetooth, LPWA).
That framing is accurate in itself. The problem is what happens when you put this list in front of a plant manager or a production engineering team. Almost without fail, it goes like this.
“We should probably capture temperature.”
“I’d like to see current too.”
“Vibration as well, that sounds like predictive maintenance.”
And so a 30-point sensor configuration piles up, a quotation is issued, the capital request is approved, the devices are installed, and a dashboard goes live. Six months later, nobody is looking at that dashboard.
This is not a question of competence. It is a question of sequence. When you start from sensor types, the project reaches installation without ever settling whose decision, at what moment, that sensor is supposed to change.
What Decides Selection Is Cycle, Not Accuracy
Among the selection criteria above, the one with overwhelmingly the greatest power to branch the configuration in practice is “measurement frequency.” It is not accuracy.
The reason is simple. Accuracy stays within the question of how precisely you measure a single point, whereas the cycle determines the entire system in one stroke: the sensor itself, the power supply, the communication method, the gateway, the storage destination, and even how the screen is built. Data you need once a minute and data you need ten thousand times a second are entirely different construction projects, even though both are described with the same phrase, “attaching a sensor.”
Go one step further and you find that what determines the cycle is not the sensor but the human work cycle of the people who act on the number.
- If the line leader walks the line once an hour, collecting data on a one-second cycle will not change what the line leader does.
- A number that is only used in the monthly cost meeting does not need to be captured every five minutes.
- Conversely, handing over hourly averages to chase the root cause of minor stoppages will not work, because minor stoppages are buried in the average and disappear.
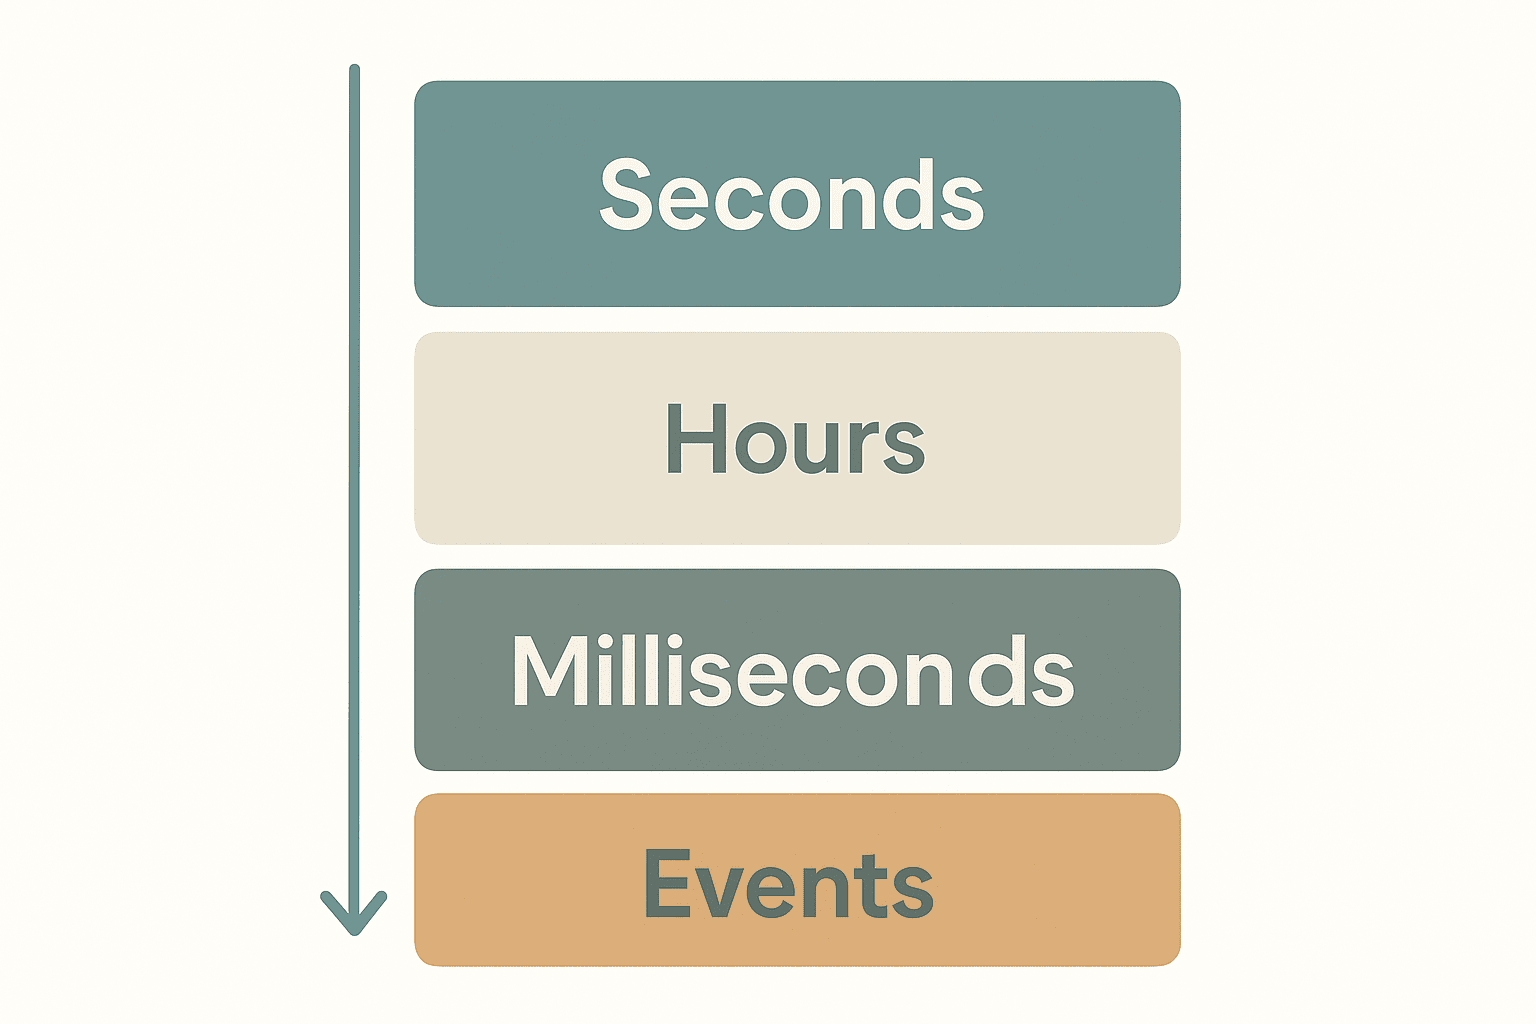
So the order of selection is “work cycle, then the time resolution of the decision, then the cycle, then the communication method, then the sensor type,” and not the reverse. The catalogue list of sensor types comes at the very end of that chain.
What “Measured but Nothing Gets Decided” Really Is
When we go on site and are shown an existing visualization system, we often encounter this state.
The graphs are there. The numbers are updating. But when you ask someone, “when this line goes up, who does what?”, no answer comes back.
That is visualization that measures everything and decides nothing. The cause comes down to one thing: no decision has been defined that corresponds to that sensor’s cycle. If one-minute data exists but the only occasion anyone looks at it is the weekly production meeting, then in substance only weekly data is being used. The remaining 10,079 data points are consuming nothing but storage fees.
Put the other way round, once you fix the cycle and the work cycle first, the sensor type narrows down considerably on its own. In the chapters that follow, we carry out that narrowing across four tiers.
Organizing Factory IoT Sensor Types into Four Time Tiers
Stop lining sensors up by category, rearrange them by the time resolution they demand, and you get the following four tiers. Because these four differ in the equipment they need, the communication method, and the storage strategy, it is more robust to treat them as separate systems at the design stage.
| Tier | Question to answer | Required cycle | Typical sensors | Communication and collection target |
|---|---|---|---|---|
| 1. Seconds to minutes | Is it running? How many units were made? | 1 second to 1 minute | Signal tower output, dry contact output, photoelectric sensors, ON/OFF judgement from current | Wireless (LPWA or Wi-Fi), lightweight small-volume data |
| 2. Minutes to hours | How much was consumed? | 1 minute to 15 minutes | Energy meters, flow meters, pressure, voltage trend monitoring | Wired Modbus or pulse, aggregated inside the panel |
| 3. Milliseconds | Is it about to break? | 0.1 ms or less (sampling 10 kHz or above) | Triaxial accelerometers, temperature, instantaneous voltage anomaly detection | Processed at a local edge, intermittent burst collection |
| 4. Event-based | Who made what, and when? | Only when the event occurs | Temperature and humidity records, measuring instrument data, open/close, position | Event driven, long-term retention assumed |
The crux of this table is the rightmost column. When the cycle differs, the communication target differs. The moment you try to consolidate that column into a single path, the project quietly begins to break.
Tier 1, Seconds to Minutes: Uptime, Stoppages and Unit Counts (Signal Tower IoT and Dry Contacts)
This is the tier where return on investment is easiest to read, and the one to tackle first. The questions to answer boil down to three: is that machine running right now, how many units were produced today, and how many stoppages were there and how long did they last?
The required cycle is 1 second to 1 minute. Why one second? Because minor stoppages are buried in a several-minute average. A machine that stops for 30 seconds four times an hour shows a visible outline on a one-minute cycle, but on a five-minute average it merely looks like a machine with slightly low utilization. If the goal is to eliminate minor stoppages, the cycle needs to be at least 1 to 10 seconds.
The sensors used in this tier are extremely plain.
- Signal tower (stack light) output. Read the red, amber and green lit states directly as the machine state.
- Dry contact output. Receive the run signal and fault signal already provided on the machine side as a voltage-free contact.
- Photoelectric or proximity sensors. Used to count production units. Simply counting how many times a workpiece has passed.
- ON/OFF judgement from a current sensor (clamp CT). Looking not at the current value itself but only at whether it exceeds a threshold.
Acquisition from signal towers in particular is worth considering first when adding IoT to existing equipment. Several manufacturers offer devices that mount over an existing signal tower to pick up the signal and transmit it wirelessly. For example, a configuration in which the signals of PATLITE Corporation signal towers are collected by that same company’s “AirGRID” to grasp the operating status of multiple machines in real time is offered as a commercial product. In many cases there is no need to touch the machine’s control panel, and the impact on the equipment maker’s warranty or on validation can be kept small.
To be clear, “PATLITE” and “AirGRID” mentioned here are the company name and the product name of PATLITE Corporation. They are not our products. Our position is to design configurations that include third-party devices such as these and to take responsibility for the upper-layer collection and visualization.
A pitfall of signal tower IoT is worth writing down as well. The colour of a signal tower is what the machine thinks of itself, not how many units were actually produced. A machine can be lit green while idling, and some machines show neither amber nor red during changeover. If you talk about utilization on the basis of signal towers alone, the shop floor will tell you the number does not match what they feel, and that will be the end of it. Only when it is combined with a production count (a photoelectric sensor or the machine’s completion signal) does utilization align with the shop floor’s own sense of reality.
There is also a route that takes data directly from the PLC in the control panel. The cost and the limits of that route compared with the over-mounted signal tower type, and the relationship between tag counts and cycle, are organized route by route in PLC Data Collection 2026: The Cause Is Not the Protocol but Tag Count and Cycle. Tier 1 in this article corresponds to what that article calls the lightest route.
Tier 2, Minutes to Hours: Energy and Utilities (Energy Meter Data Collection and Water Usage Monitoring)
The questions to answer are how much was consumed, where it is being consumed, and whether it is being wasted. The required cycle is 1 minute to 15 minutes. There is a reason behind that figure of 15 minutes: because the TOU (Time of Use) tariff contracted by large consumers in Thailand is a scheme that splits the unit price by time band, a cycle that averages across time bands makes it impossible to discuss the tariff at all. Think of 15-minute values as the coarsest granularity that still stands up to a discussion by time band.
The sensors in this tier are as follows.
- Multi-circuit energy meters. Values are read via Modbus RTU or TCP, or via pulse output. The basic form is to install them per feeder in the distribution board.
- Flow meters. Water and compressed air. There is the approach of retrofitting a pulse transmitter to an existing water meter, and the ultrasonic clamp-on type that measures from outside the pipe.
- Pressure sensors. Supply pressure and end-of-line pressure for compressed air.
- Voltage monitoring. As described below, the tier this belongs to changes with the purpose.
The first stumbling block in energy meter data collection is designing the number of points. Measuring only one point for the whole factory gives you no more information than the utility bill already does. It becomes meaningful when you split by feeder. Air conditioning, compressors, the production equipment group, and the office building. Splitting into just those four starts the discussion of where the room for reduction lies. Conversely, if you try to meter every single machine from the outset, the point count jumps while the resolution goes beyond what can be tied to a reduction action.
Water usage monitoring is an item that tends to rise in priority at factories in Thailand. The easiest place to start is monitoring the minimum night-time flow, ahead of any per-unit consumption management. Water that keeps flowing during hours when nothing is being produced is either a leak or a tap left open. This can be detected simply by looking at the minimum value during the small hours on an hourly cycle, so the demand on the cycle is extremely relaxed, while the financial impact when something is found is large. It is one of the few themes you can start with a single sensor point.
Compressed air has the same structure. Air leaks appear as flow during non-production hours. The amounts here tend to be larger than for water, and because they also show up a second time in Tier 2 as compressor power consumption, combining this with energy meter data collection speeds up identifying the cause.
Voltage monitoring systems are in fact two different things called by the same name. Since this is a place where selection accidents happen easily, we separate them here.
- Voltage monitoring as trend monitoring. Looking at phase imbalance, power factor and voltage drift. A cycle of 1 to 15 minutes is enough, and this belongs to Tier 2. The functions of a multi-circuit energy meter are often sufficient.
- Voltage monitoring as voltage sag detection. Capturing voltage dips of tens to hundreds of milliseconds accompanying lightning strikes or grid-side faults. Tier 2 can never capture this. It disappears not only in 15-minute values but even in one-second values. What is required is recording on the millisecond order, which in substance belongs to Tier 3.
Even in projects we have been involved in, following up an enquiry about “unexplained equipment stoppages happening a few times a month” sometimes leads to voltage sag. In that case, no amount of reviewing years of Tier 2 energy meter data will produce an answer. Confirm, before the quotation is prepared, which of the two meanings is intended when someone says “we are monitoring voltage.” The equipment required and the price bracket are entirely different things.
Tier 3, Milliseconds: Equipment Diagnosis and Predictive Maintenance (Requirements Here Are in a Different League)
The question to answer is a single one: is it about to break? And this tier alone differs from the other three by an order of magnitude in its required specification. Configurations that treat it on the same footing as the rest are the ones that break most often.
The framework for vibration evaluation is organized in the ISO 20816 series. ISO 20816-1:2016 replaced ISO 10816-1:1995 and became a framework integrating the 10816 series, which deals with vibration of non-rotating parts, and the 7919 series, which deals with vibration of rotating shafts. What is commonly used in practice is the approach of evaluating the overall vibration velocity (mm/s RMS) measured near the bearing housing across the four zones A to D. It is a structure that grades states in order from A, from a condition equivalent to newly commissioned installation through to a state with high risk of damage (for the specific judgement values of each zone, please refer to the standard text and the machine classification). The classification of target machines is also defined on the standard side, and ISO 20816-3:2022 covers industrial machines rated above 15 kW with rotational speeds of 120 to 30,000 r/min.
The point to grasp here is that the overall value used for zone evaluation and the waveform analysis used to catch the early seeds of a failure require different sampling rates.
What has become the industry standard for predictive maintenance use is the triaxial IEPE accelerometer, with a specification of 100 mV/g sensitivity and a frequency range of 10 Hz to 10 kHz taken as the benchmark for covering bearing defect frequencies. And to detect bearing failure at an early stage, a sampling rate of 10 kHz or above is required.
Consider what this requirement of “10 kHz or above, triaxial” means. Ten thousand points per second across three axes, that is 30,000 points per second, keep streaming out of a single sensor point. Watching a signal tower on a one-second cycle in Tier 1 is one point per second, so even for the same act of “adding one sensor point,” the volume of data points handled is 30,000 times greater.
There is one more fact that warrants caution on the price side. Among vibration, temperature and current sensors, products priced at under 50 US dollars per unit exist as of 2026. Converted at the rate used in the estimate below, that is under 1,650 baht. There is no doubt that the arrival of this price band lowered the barrier to adoption. However, a “vibration sensor under 50 US dollars” and “100 mV/g, 10 Hz to 10 kHz, sampling at 10 kHz or above” are sometimes only linked by the same words “vibration sensor” while pointing at different things. Many products in the low price band are designed to compute only an RMS value internally and transmit it once every few minutes, which is sufficient for threshold monitoring but cannot be used for defect frequency analysis. When taking a quotation, confirm at model-number level whether sensitivity, frequency range, sampling rate, and the ability to extract raw waveforms are all as required.
This is not a question of which one is correct. The design work is to separate in advance the equipment for which threshold monitoring is sufficient from the equipment that needs waveform analysis. What vibration sensors actually find, and what they do not find, is organized in Failures a Vibration Sensor Can Detect and Failures It Cannot. If you are considering a configuration that puts a vibration sensor on every machine, reading that article first should reduce the point count considerably.
Temperature is also placed in this tier, though its character is a little different. Bearing temperature and motor winding temperature change slowly, so the demand on the cycle is relaxed (minute-order is enough). The reason it is nonetheless placed in Tier 3 is that viewing vibration and temperature as a set raises diagnostic confidence, and as a collection framework it is easier to operate when carried on the same path as vibration.
Tier 4, Event-Based: Quality and Traceability
The question to answer is who made what, when, and under which conditions. This tier alone is one where the concept of a cycle does not apply. The structure is one record when an event occurs, rather than at a fixed interval.
- Temperature and humidity records. As a record of process conditions, or as a record of warehouse storage conditions.
- Measuring instrument data. Values from callipers, micrometers, torque wrenches and measuring machines.
- Open/close sensors and position data. Door opening and closing, jig attachment, the location of carts and pallets.
Bringing a cycle into this tier leads to failure. If you continuously record temperature and humidity on a five-minute cycle, for instance, an enormous number of records accumulates over the year, but what you need when a quality problem occurs is only the record for the time window in which that lot was being made. A temperature and humidity log that is not linked to lot information and timestamps cannot be used for tracing, however much of it there is.
The essence of Tier 4 design is not sensor selection but the design of the keys (lot number, manufacturing order number, operator ID). Which key is attached to the data determines its later value more than which sensor you choose. This is the decisive difference from Tiers 1 to 3.
Mixing Cycles Breaks the System: Do Not Put Everything on One Gateway
From here on is the pitfall that costs the most in practice.
As a sensor configuration is worked through, a request almost always comes up: “while we are at it, we would like to consolidate the collection mechanism into one.” One type of gateway, one communication method, one database. It looks as though it will be easier to manage, and the quotation looks cheaper too.
This breaks. We explain the reasons in three parts.
Reason 1: The Data Volume Differs by a Factor of 3,600
Let us look at concrete numbers. The following is a calculation example based on stated assumptions, not figures drawn from external sources.
Tier 3: suppose a triaxial IEPE accelerometer is sampled at 10 kHz and one sample is held in 2 bytes. 30,000 points per second times 2 bytes equals 60,000 bytes per second. That is 216 MB in an hour and roughly 5.18 GB in a day. And this is per sensor point. With 12 points it is about 62.2 GB a day, and about 22.7 TB a year.
Tier 1: suppose 10 signal tower points are watched on a one-second cycle at 20 bytes per record. That is 200 bytes per second, and 17.28 MB in a day.
The ratio is about 3,600 times (compared per point, still about 3,000 times). Both are wrapped up in the same phrase, “collecting data from sensors,” yet the network bandwidth required and the storage design sit in completely different worlds.
(In practice, Tier 3 is almost never collected continuously. The operating approach is to capture waveforms in bursts of a few seconds several times a day and to send only overall values for the rest of the time. The figures above are strictly theoretical values, shown to illustrate what happens when you choose a configuration that puts everything on a single general-purpose gateway. And when a design is made without looking at those theoretical values, that configuration does in fact get built.)
The lightness of Tier 2 is worth noting alongside. Taking 6 energy meter points on a 15-minute cycle gives 96 records a day times 6 points, which is 576 records, and 210,240 records a year. That is a volume a text file could handle, and it does not compare with Tier 3. There is no need whatsoever to buy a high-performance gateway for Tier 2.
Reason 2: LPWA Battery Life Is Set by the Transmission Interval, Not by the Sensor
When wireless is used, a discussion about battery life invariably comes up. Here too, what decides it is the cycle.
With LPWA such as LoRaWAN, transmission frequency has a large influence on battery life. A configuration that lasts 8 to 10 years at a 10-minute interval shortens to roughly 1 to 2 years at a 30-second interval.
Applying these figures to five years of operation gives the following.
- 10-minute interval: no battery replacement occurs within the five years.
- 30-second interval: with a two-year life, two full replacements across all points in five years; with a one-year life, four.
If 19 points had been made wireless, the latter case generates replacement work amounting to a cumulative 38 to 76 points over five years. This labour cost, the coordination of line stoppages, and the missing data caused by skipped replacements do not appear as a single line in the initial quotation.
What is interesting is that while the ratio of transmission intervals is 10 minutes to 30 seconds, that is 20 times, the ratio of battery life stays at roughly 4 to 10 times. This is because of fixed consumption independent of the number of transmissions, such as standby current during sleep, and it also means at the same time that stretching the interval slightly does not make the battery last dramatically longer. If you are choosing battery-powered wireless, the only workable approach is to fix the required cycle first and then choose the model. Do it in the reverse order and you end up compromising the cycle to fit the model’s constraints, and that sensor then fails to serve its original purpose.
There is also a practical difference in frequency bands. The 920 MHz band is less prone to radio congestion than the 2.4 GHz band (Wi-Fi) and has characteristics that make it more stable. Inside a factory the 2.4 GHz band is often crowded with existing Wi-Fi, wireless handhelds and various wireless devices, so when making many Tier 1 points wireless, choosing the 920 MHz band is a rational judgement.
Reason 3: Splitting Communication into Two or Three Paths Is Cheaper in the End
The design guideline that follows from all of the above is clear.
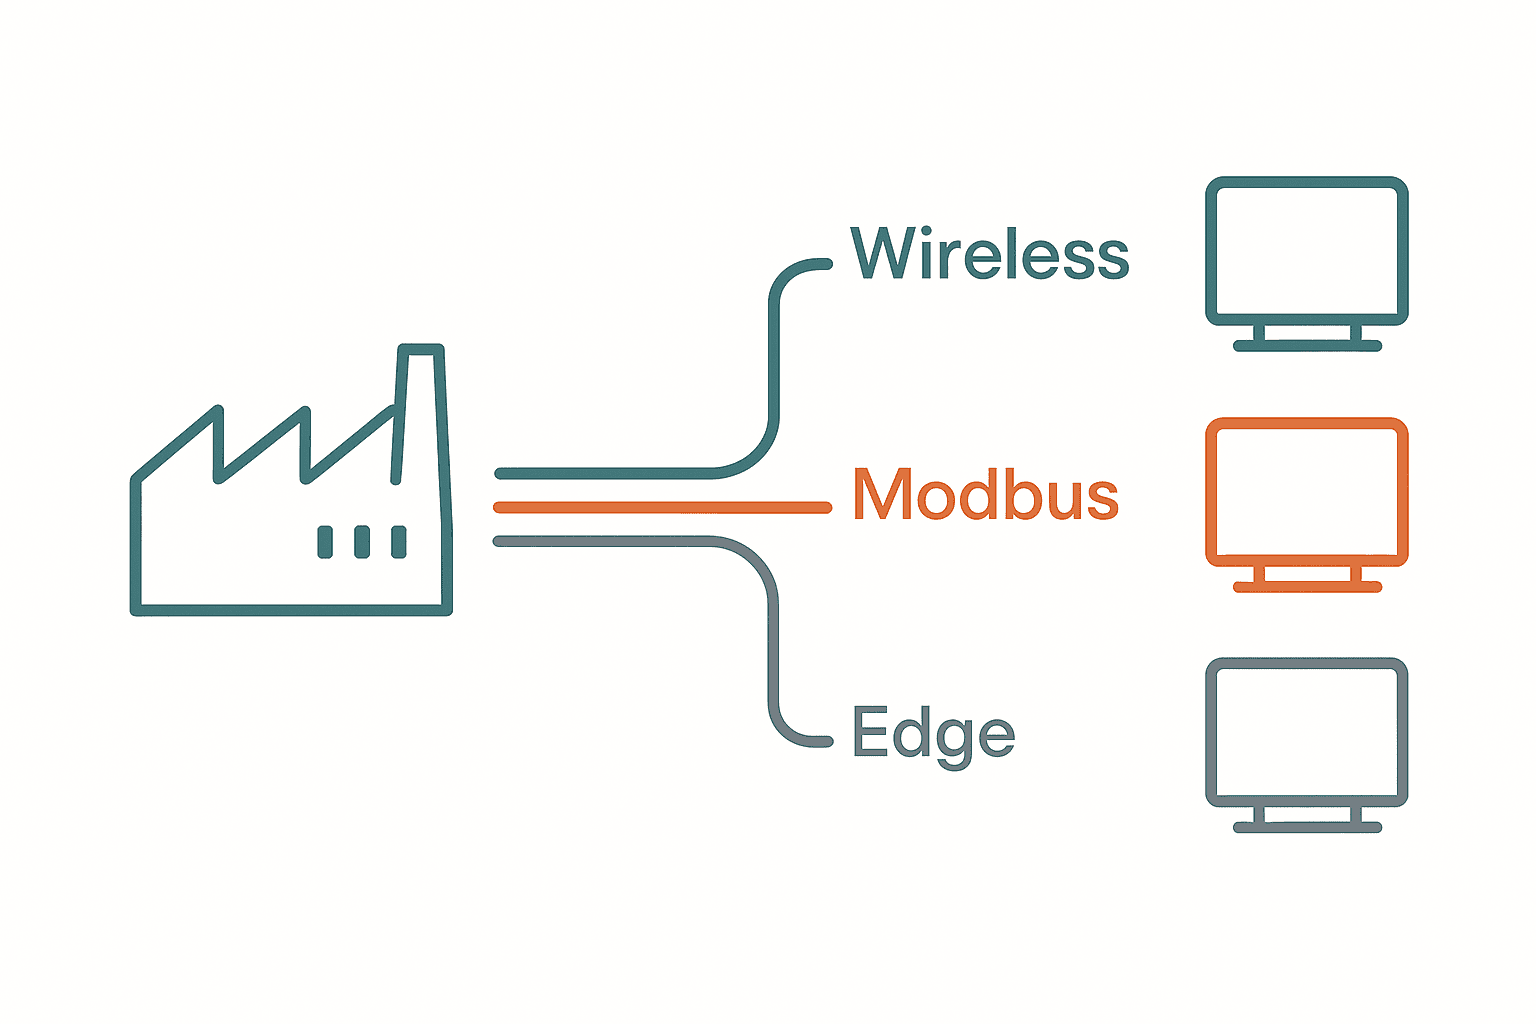
Tier 1 goes wireless (920 MHz band LPWA). Tier 2 goes wired Modbus. Tier 3 is processed at a local edge with only the results sent upward. Tier 4 is written event-driven from the application side.
Splitting the communication methods increases the variety of equipment, so at first glance costs look as though they would rise. In reality the opposite happens. The estimate in the next chapter puts numbers to this, but stated in words in advance, there are two reasons.
First, you no longer need to align every point with the specification of the most demanding tier. In a consolidated configuration, the high-speed collection edge and the wired cabling chosen for Tier 3 also get applied to Tier 1 points where a one-second cycle would suffice. Running wiring all the way to the control panel and machining the panel just to read the state of a signal tower. That cost lands on every point.
Second, the unit of future expansion becomes smaller. In a split configuration, adding 10 points to Tier 1 means touching only the LPWA gateway side. When everything is consolidated, each expansion means revisiting the load design of the whole system.
We also have an article that breaks down where factory IoT costs arise across five layers, covering not only sensors but the network, the application and operations. If you want to grasp the overall budget picture first, please refer to Breaking Down Factory IoT Costs into Five Layers.
Retrofitting Sensors to Existing Equipment: The Order of Easiest to Hardest
At factories in Thailand it is common to find equipment relocated from Japan, or bought second-hand locally, still in active service. No control panel drawings remain, the equipment maker’s support has ended, or there is no PLC on board in the first place. How to add IoT to such equipment is the point that comes up most frequently in practice.
Four Types That Are Relatively Easy to Retrofit
The sensors cited as relatively easy to retrofit are the following four (Yachiyo Solutions).
- Current sensors. Operating state can be detected simply by clamping onto the power cable.
- Vibration sensors.
- Temperature sensors.
- ON-OFF sensors.
Of these, the property of the current sensor that it only needs clamping onto the power cable is decisive for retrofitting. Without touching the inside of the machine, without touching the control circuit, and without touching the scope of the equipment maker’s warranty, you can capture whether it is running. It works even with no drawings, even when the maker’s support has ended, as long as there is a power cable.
Accordingly, the first move in adding IoT to existing equipment is almost always ON/OFF judgement using current sensors. That gets you Tier 1 data, and the outline of utilization and minor stoppages becomes visible. Whether to proceed to Tier 2 or Tier 3 can be decided after seeing those results.
The Method of Mounting over an Existing Signal Tower
The other easy entry point, alongside current sensors, is the signal tower. As noted above, several manufacturers offer devices that mount over an existing signal tower to pick up the signal and transmit it wirelessly (for example, PATLITE Corporation signal towers together with collection via that same company’s “AirGRID”).
The point where the signal tower method is superior to the current sensor method is that you receive the state the machine itself has judged (normal operation, warning, fault) as it is. ON/OFF judgement from current tells you only that electricity is flowing, and cannot distinguish whether the machine is stopped with an alarm raised or stopped for changeover. The colour of the signal tower is the result of the machine side having already made that distinction.
Conversely, the weakness of the signal tower method is, as noted above, that colour definitions vary from machine to machine. It happens quite readily that amber on one machine means “warning” while amber on another means “changeover in progress.” At the time of introduction, the work of listing what the colours mean for each machine always arises. If this stocktake is skipped, the aggregated results stop matching the shop floor’s sense of reality.
Things That Are Hard to Retrofit
On the other hand, it is worth stating explicitly which items are of high retrofit difficulty.
- In-line flow meters (insertion type). The pipe has to be cut, which requires coordinating a utility shutdown. The ultrasonic clamp-on type needs no shutdown, but the pipe material and straight-run length conditions have to be satisfied.
- Temperature and pressure inside the machine. This becomes a matter of drilling into the machine housing or piping, which affects the equipment maker’s warranty.
- PLC internal variables. This only works when three things line up: a communication port is free, the protocol is published, and the equipment maker permits the connection.
Where retrofit costs escalate, and the price ranges by the age and configuration of existing equipment, are summarized in Retrofit Costs for Existing Equipment. You can check there how the “easy versus difficult” division in this chapter comes out in monetary terms.
Five-Year Total Cost Estimate for a Thai Factory: How Tier Allocation Changes the Total
Let us confirm the discussion so far in monetary terms. This is an estimate of how the five-year total moves when, at the same scale of 30 sensor points, only the number of points placed in each tier is changed.
Assumptions (All in Baht)
- The currency is unified in Thai baht (THB). Where conversion is needed we use 1 US dollar = 33.0 baht, and this rate is fixed for all calculations in this article.
- The sensor count is 30 points in both scenarios. The period is five years.
- Equipment unit prices are per-point assumed values including the unit itself plus local installation labour. The following are assumed values based on our own procurement and installation track record, not figures drawn from external sources. In real projects they move with the model and site conditions.
- For reference, among vibration, temperature and current sensors there exist products under 50 US dollars each (= under 1,650 baht). The current CT figure of 3,000 baht in the table below is that price band of hardware with installation labour added on top. The vibration figure of 25,000 baht, on the other hand, assumes a triaxial IEPE of the 100 mV/g, 10 kHz class together with a collection channel, and is a different price band.
Unit price assumptions
| Category | Unit price per point (THB) | Basis of the breakdown |
|---|---|---|
| Signal tower over-mount signal acquisition unit | 3,500 | Unit plus installation (same level for wireless and wired I/O) |
| Current clamp CT plus wireless unit | 3,000 | Unit plus installation |
| Temperature and humidity recording unit | 2,500 | Unit plus installation |
| Multi-circuit energy meter (Modbus) | 12,000 | Unit plus CT plus installation |
| Flow meter (water, compressed air) | 18,000 | Unit plus pipework |
| Triaxial IEPE accelerometer plus high-speed collection channel | 25,000 | Sensor plus cable plus collection channel |
| Wired cabling and panel work (added for wired points only) | 8,000 | Panel machining, power, rack (excluding sensor cable) |
Unit price assumptions for shared equipment: high-speed collection edge 120,000 THB per unit, LPWA gateway 45,000 THB per unit, collection and visualization software initial setup 150,000 THB (fixed; prorated across points this is 5,000 THB per point).
The Two Scenarios Being Compared (Nothing Else Is Compared)
We allow only two counterfactuals. The difference between them is limited to two things: how the 30 points are allocated across tiers, and, as a result, whether communication is kept to one path or split into three.
Scenario A, “catalogue allocation”
An allocation chosen across the board from a list of sensor types, with predictive maintenance placed as the main objective. Vibration 12 points, temperature and humidity 6 points, energy meters 4 points, signal towers 4 points, flow meters 4 points. Because the thinking is to consolidate collection onto one high-speed platform, the signal towers too are taken via wired I/O from the panel rather than wirelessly, so all 30 points are wired. The signal tower over-mount type is assumed at the same unit price for the wired I/O version.
Scenario B, “cycle allocation”
An allocation worked backwards from the work cycle. Signal towers 10 points, current CTs 6 points, energy meters 6 points, flow meters 2 points, vibration 3 points, temperature and humidity 3 points. Communication is split into three paths: the 19 points of signal towers, current CTs and temperature/humidity on LPWA, the 8 points of energy meters and flow meters on wired Modbus, and the 3 vibration points connected directly to a dedicated high-speed edge. Only 11 points are wired. Note that the 8 Modbus points are assumed to be accommodated in spare channels of the high-speed collection edge introduced for vibration, so no separate dedicated collection device is budgeted.
Intermediate options other than these two are not handled in this estimate. In addition, the benefit figure described later is counted only for the energy tier of Scenario B, and the comparison between the scenarios is made on cost alone. Placing separate benefits in each scenario muddies the comparison and becomes a breeding ground for double counting.
Note also that the counterfactual for the payback period is “the status quo in which the energy tier is not measured,” not a comparison against Scenario A. Please read the cost comparison (A versus B) and the payback comparison (status quo versus investing in the energy tier) as two separate contrasts.
Initial Costs
| Item | Scenario A (THB) | Scenario B (THB) |
|---|---|---|
| Signal tower over-mount type | 4 points = 14,000 | 10 points = 35,000 |
| Current clamp CT | 0 points = 0 | 6 points = 18,000 |
| Temperature and humidity recording | 6 points = 15,000 | 3 points = 7,500 |
| Multi-circuit energy meter | 4 points = 48,000 | 6 points = 72,000 |
| Flow meter | 4 points = 72,000 | 2 points = 36,000 |
| Triaxial IEPE accelerometer | 12 points = 300,000 | 3 points = 75,000 |
| Equipment subtotal (30 points) | 449,000 | 243,500 |
| High-speed collection edge | 2 units = 240,000 | 1 unit = 120,000 |
| LPWA gateway | 0 units = 0 | 2 units = 90,000 |
| Wired cabling and panel work | 30 points = 240,000 | 11 points = 88,000 |
| Collection and visualization software initial setup | 150,000 | 150,000 |
| Infrastructure subtotal | 630,000 | 448,000 |
| Total initial cost | 1,079,000 | 691,500 |
Annual Costs and the Five-Year Total
| Item | Scenario A (THB/year) | Scenario B (THB/year) |
|---|---|---|
| Software fees and cloud | 96,000 | 72,000 |
| Maintenance and calibration | 60,000 | 30,000 |
| Communication lines | 12,000 | 12,000 |
| Batteries and spare parts | 0 | 6,000 |
| Total annual cost | 168,000 | 120,000 |
| Item | Scenario A (THB) | Scenario B (THB) |
|---|---|---|
| Initial cost | 1,079,000 | 691,500 |
| Annual cost x 5 years | 840,000 | 600,000 |
| Five-year total | 1,919,000 | 1,291,500 |
| Five-year total per point | approx. 63,967 | 43,050 |
The difference is 627,500 baht. Scenario A is about 1.49 times Scenario B, or put the other way round, Scenario B has a total about 32.7% lower than Scenario A. The same 30 points, the same factory, and the only difference is the allocation and the communication design.

Recalculation
We verify every figure presented in the tables with division and addition.
- Equipment subtotal A: 300,000 + 15,000 + 48,000 + 14,000 + 72,000 = 449,000 (points 12 + 6 + 4 + 4 + 4 = 30)
- Equipment subtotal B: 35,000 + 18,000 + 72,000 + 36,000 + 75,000 + 7,500 = 243,500 (points 10 + 6 + 6 + 2 + 3 + 3 = 30)
- Infrastructure subtotal A: 240,000 + 240,000 + 150,000 = 630,000
- Infrastructure subtotal B: 90,000 + 88,000 + 120,000 + 150,000 = 448,000
- Consistency of the wired add-on: A = 30 points x 8,000 = 240,000; B = 11 points x 8,000 = 88,000 (B’s wired points are energy meters 6 + flow meters 2 + vibration 3 = 11 points)
- Initial A: 449,000 + 630,000 = 1,079,000; Initial B: 243,500 + 448,000 = 691,500
- Annual A: 96,000 + 60,000 + 12,000 = 168,000; Annual B: 72,000 + 30,000 + 12,000 + 6,000 = 120,000
- Five-year total A: 1,079,000 + 168,000 x 5 = 1,079,000 + 840,000 = 1,919,000
- Five-year total B: 691,500 + 120,000 x 5 = 691,500 + 600,000 = 1,291,500
- Breakdown of the difference: initial difference 387,500 + annual difference 48,000 x 5 (= 240,000) = 627,500 (matching the five-year total difference 1,919,000 – 1,291,500 = 627,500)
- Per point: 1,919,000 / 30 = 63,966.67; 1,291,500 / 30 = 43,050
- Ratio: 1,919,000 / 1,291,500 = 1.4859 (about 1.49 times); reduction rate: 627,500 / 1,919,000 = 32.7%
Count Only One Benefit Line (Electricity Peak Shifting)
This is where accidents happen most often in estimates of this kind. Stack up multiple benefit lines and you almost always end up double counting. In this estimate we count only one benefit line. (One unit in the Thai electricity tariff is 1 kWh. Below, baht per unit and baht per kWh are used with the same meaning.)
Let us check Thai electricity tariffs. The average electricity tariff for the May to August 2026 period is 3.95 baht per unit (base 3.78 baht plus Ft of 16.23 satang = 0.1623 baht, excluding VAT). Adding those up for confirmation gives 3.78 + 0.1623 = 3.9423, which differs slightly from the published average of 3.95 baht, but this comes from the mix of tariff categories and rounding, and is not a matter of order of magnitude. The Ft is revised by the Energy Regulatory Commission (ERC) every four months.
At factories on large-scale TOU contracts, it is 3.80 baht per unit off-peak and 5.27 baht per unit on-peak. That difference is 1.47 baht per unit (5.27 – 3.80), and on-peak is about 1.39 times off-peak.
The benefit we count is this unit price difference alone.
Assumption (provisional, not a fact): suppose the 6 energy meter points and 2 flow meter points in Scenario B make it possible to identify which loads are pinned to the on-peak band, and that compressor charging runs, air conditioning pre-cooling, and some auxiliary equipment operation are shifted into the off-peak band to the extent of 8,000 kWh per month. For a factory consuming 200,000 kWh a month, that is a shifted volume equivalent to 4% of the whole.
Annual benefit = 8,000 kWh/month x 12 months x 1.47 baht/kWh = 96,000 kWh x 1.47 = 141,120 baht/year
The investment corresponding to this benefit is not all 30 points of Scenario B. It is only the 8 points of the energy tier. Carved out, it looks like this.
| Item | Amount (THB) |
|---|---|
| Multi-circuit energy meters 6 points x 12,000 | 72,000 |
| Flow meters 2 points x 18,000 | 36,000 |
| Wired cabling and panel work 8 points x 8,000 | 64,000 |
| Prorated software initial setup 8 points x 5,000 | 40,000 |
| Energy tier initial investment | 212,000 |
Payback period = 212,000 / 141,120 = approx. 1.50 years
Let us recalculate. 72,000 + 36,000 + 64,000 + 40,000 = 212,000. 141,120 x 1.5 = 211,680. Dividing the residual 320 baht by the annual figure gives 0.0023 years, so the total is 1.5023 years. The prorated unit price is 150,000 / 30 = 5,000 baht per point, and 8 points comes to 40,000 baht. Everything is consistent.
The Division You Must Not Do, and the Numbers That Cannot Be Placed
Dividing the full initial cost of Scenario B by the benefit above gives 691,500 / 141,120 = approx. 4.90 years. This figure of 4.90 years must not be used. The numerator (investment across 30 points) and the denominator (a benefit from only the 8 points of the energy tier) do not correspond.
When this error occurs in an internal capital request, it also works in the opposite direction. A judgement of “if it takes 4.9 years, let us shelve it” ends up rejecting an investment that pays back in 1.5 years when the energy tier is viewed on its own, purely because the costs of the other tiers have been loaded onto it. The payback period should always be calculated placing only the investment that generates that benefit in the numerator.
So how should the benefits of the remaining tiers be treated? They cannot be placed. We write this honestly below.
- The benefit of Tier 1 (10 signal tower points plus 6 current CT points, 16 points): recovery of production time through reducing minor stoppages. To monetize it you need two things, the current total duration of minor stoppages and the gross profit contribution per hour. The former cannot be known before you measure (naturally, since these 16 points are being installed in order to measure it), and the latter moves with the product mix and the order situation. Therefore a monetary figure cannot be placed before adoption. Any figure placed would be nothing more than a benefit amount multiplied by an unfounded assumption.
- The benefit of Tier 3 (3 vibration points): the value of unplanned stoppages avoided. It is calculated as annual probability of occurrence times loss per occurrence, but the probability of occurrence can only come from your own past failure history, and with a count of 3 points there is no statistical meaning as a population. So this cannot be placed either.
- The benefit of Tier 4 (3 temperature and humidity points): reduced labour in handling quality complaints, and meeting traceability requirements. The former depends on the frequency of occurrence, and the latter is often not a monetary benefit at all but a condition for continuing the business relationship. It does not lend itself to monetization.
Writing that the benefits of Tiers 1, 3 and 4 “cannot be placed” does not mean they are without value. Tier 1, within this estimate, is small in investment scale at 53,000 baht of equipment cost for 16 points, and it is the tier that changes shop floor behaviour fastest. It is simply that there is no method for placing a monetary figure on its benefit before adoption. In a capital request, positioning Tier 1 as “not a monetary benefit but the cost of obtaining the measured data needed for the Tier 2 and Tier 3 investment decisions” is the most honest way to write it, and the way most likely to be approved.
Three Designs That Put Shop Floor Visualization into a State Where Things Get Decided
Once the sensor tier design is done, the last step is to design the operational side. If this is missing, then even with the right cycles you fall back into the state described at the start of this article, measured but nothing gets decided.
Design 1: Write Down the Decision Maker and the Work Cycle on Paper Before the Sensors
For each sensor, check whether you can write the following three things in one line each.
- Who looks at this number (at the level of job title and name)
- When they look at it (the morning meeting, shift handover, the weekly meeting, when an anomaly occurs)
- What they do when it reaches a given state
A sensor for which all three are not in place is not installed at that point. This is not an excuse for cutting the point count; it is a procedure for determining the cycle. If the answer is “looked at during shift handover,” then an eight-hour cycle is enough, and it is settled at that moment that Tier 2 suffices. If the answer is “looked at when an anomaly occurs,” then the subject is not the cycle but the design of the alerts.
Design 2: Decide the Action First, Not the Threshold
The configuration work that consumes the most time in a visualization system is setting thresholds. And it is also the work most likely to be wasted.
The reason is that even if you set a threshold, if the action to take when it is exceeded has not been decided, the alert comes to be ignored. An alert that is ignored becomes “turn it off, it is noisy” within a few weeks.
Reverse the order. Decide the action first: “if this machine stops for 30 minutes, call the maintenance leader.” Then the threshold is automatically settled as “continuous stoppage of 30 minutes.” Because the action is decided, the alert is not ignored.
Design 3: Start with 30 Points and Expand After Seeing the Measurements
There is a reason we built this article’s estimate around 30 points. Thirty points is the practical minimum configuration at which Tier 1 reveals the outline of the line, Tier 2 shows the breakdown of utilities, Tier 3 covers only the most critical equipment, and Tier 4 secures an entry point for quality records.
And what matters is that the measured data obtained after installing these 30 points becomes the basis for the next investment decision. The total duration of minor stoppages, which we wrote in the previous chapter “cannot be placed,” will be in your hands as a measured value three months after installing the 16 Tier 1 points. Only then can you calculate the payback period for additional investment in Tier 2 or Tier 3 with a well-founded denominator.
If you try to design 100 points from the outset, you will be writing the benefit figures for all 100 points into the quotation without any measurements. That falls apart not in the capital request meeting but a year after go-live.
Points Specific to Factories in Thailand
How to Approach Electricity Tariffs and Ft Revisions
The unit price difference of 1.47 baht/kWh used in the previous chapter is not a fixed value. Because the base tariff and the Ft are reviewed by the ERC every four months, applying a single unit price to a five-year estimate is, strictly speaking, an approximation.
Does that make the estimate meaningless? No, because what determines the benefit of peak shifting is not the absolute unit price but the difference between on-peak and off-peak. Ft revisions often act on the base side, and the time-band structure of TOU itself does not frequently invert. Accordingly, an estimate anchored on a unit price difference of 1.47 baht has a range of accuracy in absolute terms, but the direction it points to as an investment decision is unlikely to change.
The practical recommendation is to display “on-peak consumption” and “off-peak consumption” separately on the Tier 2 visualization screen. Even when unit prices change, as long as those two quantities are captured, the benefit figure can be updated simply by multiplying by the unit price of the day. If you build a screen that shows only monetary amounts, comparison with the past breaks every time the tariff is revised.
The Investment Climate, and Why Start Now
Investment applications to Thailand’s BOI reached a record high of about 1.8 trillion baht in 2025, and exceeded 1 trillion baht in the January to March 2026 quarter alone. The government has announced a policy of shortening permitting periods through a “fast pass” scheme.
The effect this environment has on factory IoT appears not as direct subsidy but as pressure on start-up speed. The faster new lines and expansion lines come up, the greater the value of knowing the real performance of existing lines in numbers. If you build an expansion plan while unable to answer “this process is theoretically 200 units an hour, but what is the measured figure?”, you will end up with two copies of the same bottleneck after the expansion.
Investment in Tier 1 is, in this context, a preliminary step to capital investment in equipment. Take measurements of the existing lines before the capital request for the expansion. In terms of sequence, that is the right way round.
Local Maintenance and Parts Procurement
Finally, three practical constraints of operating in Thailand.
- Whether you can hold spare parts stock inside Thailand. If replacing a failed sensor takes two weeks of shipping from Japan, data is missing for that whole period. Decide the tolerable amount of missing data per year first, and then decide accordingly whether to stock spares domestically or to choose models with short procurement lead times.
- Where calibration will be done. For the accelerometers of Tier 3 and the energy meters of Tier 2, if there is any situation in which accuracy is asserted, evidence of calibration is required. Whether a model can be calibrated within Thailand is an item worth confirming at the selection stage.
- The language on the shop floor. Whether to provide the visualization screens in Thai has a decisive effect on Tier 1. The people who act on Tier 1 data are the operators and leaders on the floor, and screens available only in Japanese or English will not be used. Tiers 2, 3 and 4 are viewed by the management side, so Japanese and English are often sufficient. The language requirements for screens differ by tier.
Frequently Asked Questions (FAQ)
What Types of IoT Sensors Are Used in Factories?
The categories usually cited as representative are temperature and humidity, pressure, open/close, illuminance, acceleration, human presence, position, CO2, water level, current, and odour (Sanshin Electronics). The point of this article, however, is not to select from this list of categories. We suggest starting selection from the time resolution of the decision you want to make. Divide into the four tiers of seconds to minutes (uptime, stoppages, unit counts), minutes to hours (energy and utilities), milliseconds (equipment diagnosis) and event-based (quality and traceability), and the categories you need narrow down on their own.
Can Sensors Be Retrofitted? Do They Work on Existing Equipment?
Yes. The four types that are relatively easy to retrofit are current sensors, vibration sensors, temperature sensors and ON-OFF sensors (Yachiyo Solutions). Current sensors in particular detect operating state simply by clamping onto the power cable, and because they do not touch the machine’s control circuit at all, they work even on equipment with no remaining drawings or with maker support ended. Devices that mount over an existing signal tower and transmit the signal wirelessly (for example, PATLITE Corporation signal towers together with that same company’s “AirGRID”) are also a strong entry point. Conversely, insertion-type flow meters that require cutting the pipe, and retrofitting temperature or pressure sensors that require drilling into the machine, are of higher difficulty.
How Do You Collect Energy Meter Data?
The basic form is to read multi-circuit energy meters via Modbus RTU or TCP, or via pulse output, taking measurements per feeder in the distribution board. The cycle is 1 to 15 minutes. Because unit prices change by time band under Thai TOU contracts, a granularity that is not averaged across time bands is needed, and 15-minute values are the practical upper limit of coarseness. For point design, rather than metering every single machine from the outset, we suggest first dividing broadly into four, such as air conditioning, compressors, the production equipment group and the office building. That four-way split alone starts the discussion of where reduction is possible. If the screen displays not monetary amounts but on-peak and off-peak consumption (kWh) separately, historical comparison will not break when unit prices change with an Ft revision.
How Do You Add IoT to Signal Tower (PATLITE) Outputs?
Using a device that mounts over the existing signal tower is the option with the smallest impact on the equipment. With PATLITE Corporation signal towers, a configuration in which signals are collected by that same company’s “AirGRID” to grasp the operating status of multiple machines in real time is offered as a commercial product. There is one task that should always be carried out at the time of introduction: taking stock of what each colour means on each machine. It genuinely happens that amber on one machine means “warning” while amber on another means “changeover in progress.” If this listing is skipped, the aggregated utilization figures stop matching the shop floor’s sense of reality. Also, since signal towers alone cannot distinguish idling from genuine production, we recommend combining them with a production count (a photoelectric sensor or a completion signal).
How Should You Choose a Vibration Sensor?
First, separate the equipment for which threshold monitoring is sufficient from the equipment that needs waveform analysis. For the latter, the industry standard for predictive maintenance use is the triaxial IEPE accelerometer, with 100 mV/g sensitivity and a frequency range of 10 Hz to 10 kHz taken as the benchmark for covering bearing defect frequencies, and a sampling rate of 10 kHz or above is required to detect bearing failure at an early stage. The evaluation framework is the ISO 20816 series, in which ISO 20816-1:2016 replaced ISO 10816-1:1995, integrating the 10816 series (non-rotating parts) and the 7919 series (rotating shafts). The method evaluates overall vibration velocity (mm/s RMS) near the bearing housing across the four zones A to D, and ISO 20816-3:2022 covers industrial machines rated above 15 kW at 120 to 30,000 r/min. Note that among vibration, temperature and current sensors there are also products under 50 US dollars each, but many in this price band are designed to compute only an RMS value internally before transmitting, and cannot be used for waveform analysis. Confirm sensitivity, frequency range, sampling rate, and whether raw waveforms can be extracted, at model-number level.
Where Should You Start with Water Usage Monitoring?
We suggest starting with monitoring the minimum night-time flow, ahead of per-unit consumption management. Water that keeps flowing during hours when nothing is being produced is either a leak or a tap left open. The required cycle is relaxed at around one hour, and you can start with a single sensor point. If the existing water meter has a pulse output, retrofitting a pulse transmitter is enough; if not, consider the ultrasonic clamp-on type that measures from outside the pipe. The clamp-on type can be installed without cutting the pipe, but there are conditions on pipe material and on the straight-run length upstream and downstream, so checking the actual pipework on site comes first. The same thinking applies to compressed air, where flow during non-operating hours is the air leak volume. Because compressed air also appears as compressor power consumption, combining it with energy meter data collection speeds up identifying the cause.
LPWA or Wi-Fi, Which Should You Choose?
Decide by the transmission cycle. With LPWA such as LoRaWAN, transmission frequency has a large influence on battery life: a configuration that lasts 8 to 10 years at a 10-minute interval shortens to roughly 1 to 2 years at a 30-second interval. Considered over five years of operation, no battery replacement occurs at a 10-minute interval, but at a 30-second interval two to four full replacements across all points are needed. If 19 points have been made wireless, that is replacement work amounting to a cumulative 38 to 76 points. In addition, the 920 MHz band is less prone to radio congestion than the 2.4 GHz band (Wi-Fi) and is more stable, so the 920 MHz band is advantageous when making many points wireless inside a factory. On the other hand, Tier 3, which handles millisecond-order waveforms, is not a candidate for battery-powered wireless in the first place. Connect it by wire directly to a local edge.
Summary
Factory IoT sensors are not something you choose by type. They are determined by the time resolution of the decision you want to make and by the work cycle in which that decision turns.
We summarize the key points of this article in five items.
- The order of sensor selection is “work cycle, then the time resolution of the decision, then the cycle, then the communication method, then the sensor type.” The catalogue list of sensor types comes at the end of that chain. Enter in the reverse order and you get visualization that measures everything and decides nothing.
- Design the four time tiers as separate systems. Seconds to minutes (uptime, stoppages, unit counts), minutes to hours (energy and utilities), milliseconds (equipment diagnosis), event-based (quality and traceability). The equipment, communication methods and storage strategies they require all differ.
- Putting everything on one gateway and one communication method breaks the system. Between triaxial 10 kHz vibration and one-second-cycle signal towers, the data volume handled differs by about 3,000 times per point, and by about 3,600 times between the configurations described above. LPWA battery life moves by roughly 4 to 10 times with the transmission interval. Splitting communication into two or three paths turns out cheaper in the end, and makes expansion easier too.
- Even with the same 30 points, the five-year total moves by about 1.49 times depending on tier allocation and communication design. In this article’s estimate, against 1,919,000 baht for the catalogue allocation, the cycle allocation comes to 1,291,500 baht. The difference is 627,500 baht.
- Place only the investment that generates the benefit in the numerator. Electricity peak shifting yields 141,120 baht a year against 212,000 baht for the 8 points of the energy tier, a payback of about 1.50 years. The 4.90 years obtained by dividing the whole 691,500 baht of Scenario B by the same benefit has a numerator and denominator that do not correspond, and is a number that must not be used. And the benefits of the seconds-to-minutes tier and the equipment diagnosis tier cannot be placed before measurement. Writing that they cannot be placed is what gets a capital request approved.
Before deciding what the sensors will be, ask whether you can write in one line who looks at that number, when, and what they do when it reaches a given state. If there is an item where you get stuck here, that is not a place to cut the point count but a place to redo the discussion of the cycle.
We are based in Bangkok, Thailand, and provide system integration in factory IT/OT, production management, IoT and automation for Japanese-owned manufacturers. We receive a great many enquiries from sites with a lot of existing equipment and incomplete drawings, sites with mixed communication methods, and sites where visualization has already been installed but is not being used. You are welcome to consult us from the stage before sensor types are decided, starting with organizing the cycles and work cycles. If you share your current equipment register and the decisions you are currently struggling with, we will help you work out which tier to start from. Please get in touch here.


