



Search for how to deploy RTLS in a factory and the first thing you meet is a technology comparison. UWB is accurate but expensive, BLE is cheap but coarse. Yet when a plant that has already run a PoC stalls because the system does not deliver what was expected, the cause is almost never the wrong technology. Every use case needs its own combination of accuracy and update rate, and the model still ends up being chosen on the centimetre figure printed in the catalogue. That is a sequencing problem, not a technology problem. This article works through classifying use cases into four quadrants before you argue about accuracy, then the technology comparison, the four layers of cost, the deployment steps, and the issues specific to factories in Thailand.
What RTLS Is | The System That Turns Factory Location Management From Points Into Lines
RTLS stands for Real-Time Location System, and it is also described as an indoor positioning system. You attach a tag to whatever you want to follow, receivers installed around the building pick up the signal from that tag, and the position of the object is displayed continuously on a map of the plant. Vendor product pages describe it the same way, as a means of keeping a continuous view of where people, assets and vehicles currently are.
The market keeps expanding. Polaris Market Research estimates the global RTLS market at 149 hundred million US dollars in 2025, reaching roughly 177 hundred million in 2026 and around 240 hundred million by 2030, a CAGR of 18.6%. Narrowing to manufacturing, MarketsandMarkets reports adoption spreading into tool tracking, navigation for AGVs and robots, worker safety, and just-in-time material flow. There is no question that the field is growing, and that growth brings with it a rising number of installations that nobody actually uses.
How This Differs From Job Tickets and Barcodes
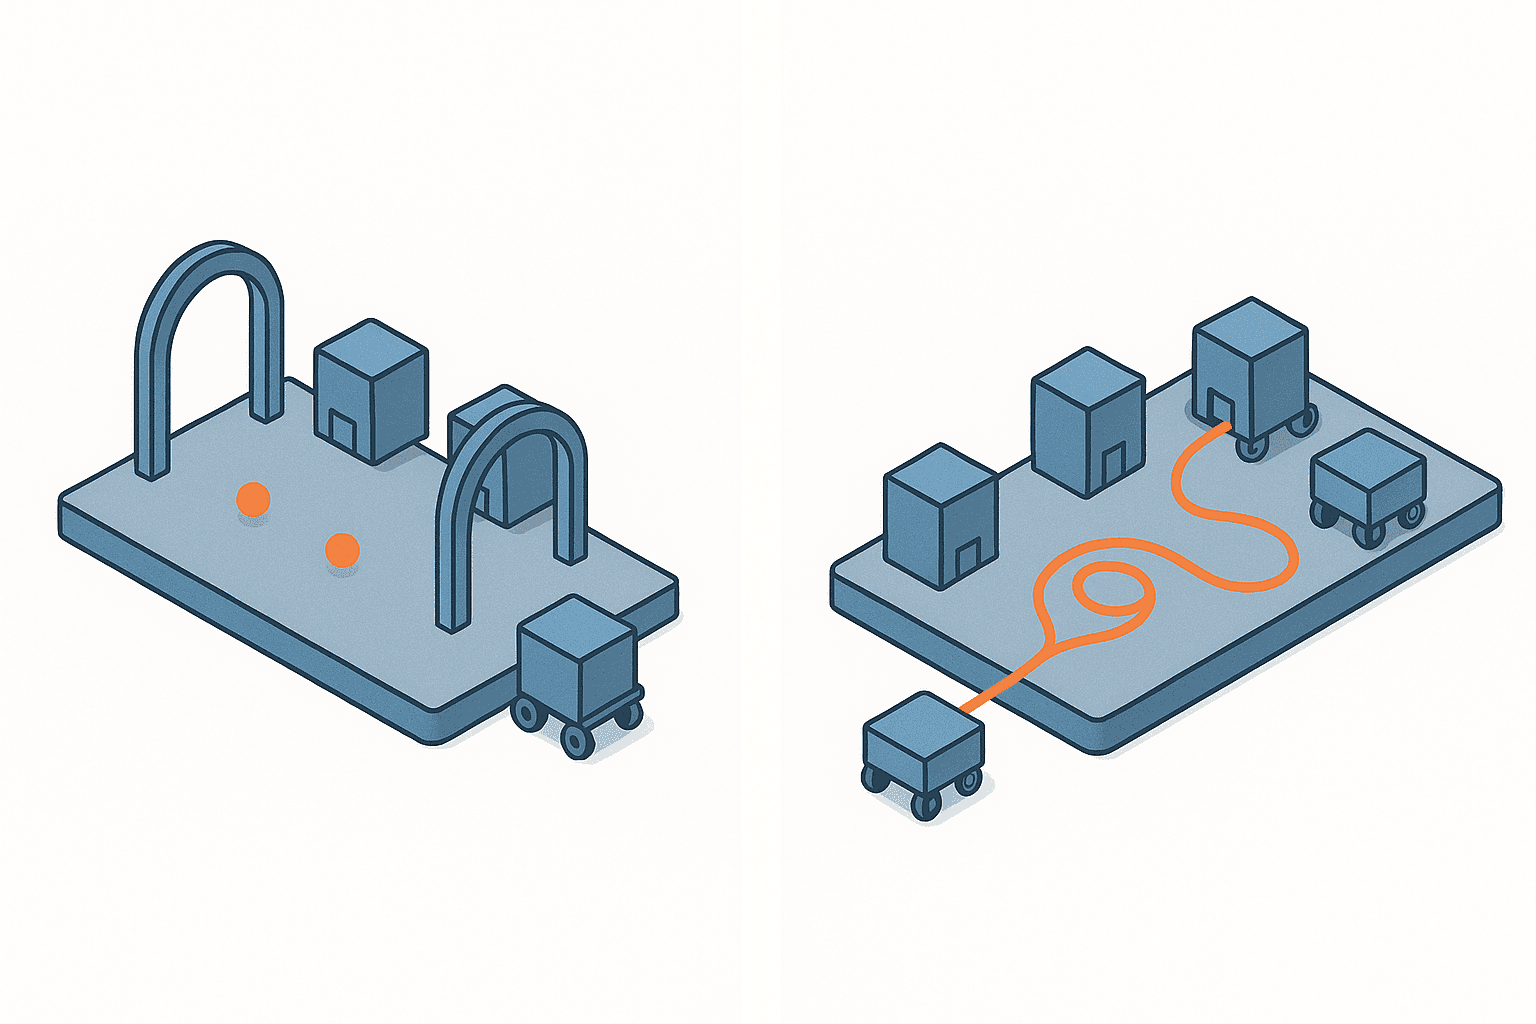
What separates RTLS from conventional shop-floor tracking is the shape of the record. Job tickets, barcodes and passive RFID gate reads all capture when a given item passed a given checkpoint. That is a record of points. What happened between one point and the next, and where the item sat for how long, leaves no trace at all.
RTLS records lines. It will show you that of the 90 minutes between leaving process A and entering process B, 75 minutes were actually spent on a temporary staging area beside the aisle. From a point record, the same interval only reads as “it took 90 minutes from A to B”, with no way to break those 90 minutes apart. When your objective is finding bottlenecks in material flow, that difference is decisive.
The reverse also holds. If a point record answers your question, RTLS is over-investment. This is the first fork in the road.
Do You Want to Count Stock, or Know Where It Is Right Now
Before going further, it is worth ruling out the possibility that RTLS is not what you need. Two questions separate the cases.
- If you want to count, to identify, or to run stocktakes faster, the answer is not RTLS but passive RFID and conventional shop-floor tracking. The practical side of capturing process transitions is covered in WIP management in practice 2026, which deals with point capture through job tickets and barcodes. The cost structure of RFID for stocktaking and identification is broken down in RFID deployment cost breakdown and market rates.
- If you want to know where something is right now, where it is sitting idle, or who is approaching what, you are in RTLS territory. The subject is position rather than identity, lines rather than points.
These two are not competitors. In fact the most realistic configuration on a cost-benefit basis is to capture process transitions with conventional tracking and use RTLS only to pin down where the dwell time goes. Trying to replace everything with RTLS from the start walks you straight into the traps described in the next section.
Choosing on Accuracy Alone Goes Wrong | Three Traps in RTLS Deployment
Technology selection usually opens with an accuracy comparison, along the lines of “UWB gives 10 to 30 cm, BLE gives 3 to 5 m”. The comparison itself is correct. The moment you put accuracy first, however, you fall into one of the following three traps.
Trap 1 | Confusing Accuracy With Update Rate
Accuracy is how precisely a position can be determined. Update rate is how frequently that position is refreshed. They are entirely separate properties, and catalogues print only the first one in large type.
Failing to separate them leads to fatal selection errors. Take collision avoidance between forklifts and workers. Accuracy of 10 cm is worthless if the position refreshes once every 5 seconds, because a vehicle travelling at 10 km/h covers about 14 m in that time, and knowing to within 10 cm where it was 5 seconds ago tells you nothing useful. In safety applications, only combinations that satisfy both requirements at once are worth anything.
The opposite case exists too. If your objective is measuring dwell time between processes, one update per minute is plenty. Dwell is a phenomenon discussed in minutes, so second-by-second refresh adds no information while draining batteries and inflating traffic and server load. Tag battery life is tied directly to update rate, so an unnecessarily fast refresh translates straight into running cost.
Trap 2 | Demanding Centimetre Accuracy Where Zone Level Is Enough
The second trap is setting accuracy too high while writing the requirements. “If we are doing this at all, more accuracy must be better” is a natural instinct, but if the position data is used to answer “which process area is it in”, what you need is area identification, not coordinates.
Tracking WIP between processes is the classic example. Knowing whether a load is in the press area, the welding area, or the staging area before painting is enough to make the dwell analysis work. Demand centimetre accuracy for that job and the required anchor density jumps, multiplying the cost several times over. What you get in return is “2.3 m from the north-west column of the welding area”, a level of precision nobody will ever use.
When you write an accuracy figure into a specification, write one sentence first explaining what decision that accuracy supports. An accuracy figure you cannot justify in one sentence is a wish, not a requirement.
Trap 3 | Taking Catalogue Figures at Face Value Despite Multipath
The third trap is the obvious but easily forgotten fact that catalogue accuracy is measured under ideal conditions. Radio waves reflect off metal, and a factory is a mass of metal. Machine enclosures, steel medium-duty racking, roof beams, metal parts stacked on pallets, all of it is a reflector.
When a reflected signal arrives later than the direct one, the positioning algorithm computes a distance greater than the real one. That is multipath error. UWB is regarded as resistant to multipath because its pulses are short, but resistant does not mean unaffected. In a warehouse area packed with metal racking, there is no guarantee that the catalogue figure of 10 to 30 cm will actually be delivered.
The practical conclusion is simple. Set the installation density and the model choice from measurements taken in your own building, not from the catalogue. The PoC that produces those measurements is covered later in this article.
The Four-Quadrant Use Case Matrix | Classify Factory Location Management Requirements First
There is exactly one way to avoid all three traps, and that is to classify the use case before choosing the technology. RTLS applications in a factory split into four groups according to the combination of accuracy and update rate they demand.
| Use case | Accuracy required | Update rate required | Technologies that fit |
|---|---|---|---|
| WIP tracking between processes | Zone level | Once every few tens of seconds to a few minutes | BLE / Wi-Fi |
| Finding jigs, tools and trolleys | Zone to room level | Once every few minutes | BLE with passive RFID alongside |
| Vehicle and worker collision safety | Centimetre class | Under 1 second | UWB |
| Linking to quality traceability | As for use case 1 | Fast enough not to miss a process transition | BLE / Wi-Fi plus API integration |
The way to use this table is to place what you want to do into one of the four rows and carry the accuracy and update rate written there into your requirements. Run it in the opposite order, choosing the technology first and fitting the use case around it, and something will break sooner or later.
Use Case 1 | WIP Tracking Between Processes Works at Zone Level
This is about knowing how much work in progress is sitting at each process. Tag the trolleys, pallets or lot-level containers and visualise the count and dwell time by process area.
Since what you need is area identification, zone-level accuracy is sufficient, and an update once every few tens of seconds to a few minutes is enough. BLE suits this best, and where an existing Wi-Fi infrastructure can be reused, a Wi-Fi based approach is also an option.
The design decision that matters most here is how you cut the zones. Divide by process and all you learn is that “18 trolleys have piled up at welding”. Split the same process into three zones for pre-input, in-process and finished-goods staging, and you find out whether the pile-up is waiting to be started or waiting to be collected. The first means the upstream process is overproducing, the second means the downstream process is late collecting, and the countermeasures are completely different. Create zones according to the number of decisions you want to separate, not the number of processes.
Use Case 2 | Finding Jigs, Tools and Trolleys Needs Zone to Room Level
This is about cutting time spent searching. The targets are assets that move but exist in limited numbers, such as dies, jigs, measuring instruments, dedicated tools and trolleys.
The loss from that search time is estimated to be larger than most people assume. In an analysis published by Nokia, Sandvik Coromant estimates that around 20% of working productivity is lost to missing tools and the searching that follows. The same article notes that even 10 minutes of searching per person per day amounts to the equivalent of 40 hours of stoppage per year. Anyone who has spent time on a shop floor will recognise 10 minutes a day as a conservative figure.
The accuracy required is enough to tell you which area an item is in, and once every few minutes is a sufficient update rate. BLE is the default, and where you want to detect movement into outdoor material yards or off the site altogether, adding passive RFID gates at the doors is an effective combination.
Use Case 3 | Vehicle and Worker Collision Safety Needs Centimetre Class and Low Latency Together
This is about preventing contact between forklifts or AGVs and people on foot. This use case alone sits at a completely different requirement level from the other three.
The scale of the hazard shows up in the statistics. US Bureau of Labor Statistics data for 2017 records 74 fatalities and 9,050 injuries in forklift-related incidents. Those are US figures rather than Thai ones, but the fact that forklifts are among the machines that injure the most people inside a factory holds in every country.
This use case needs centimetre-class accuracy and a sub-second update rate at the same time. As a worked example of what that looks like in practice, the collision prevention system offered by Browan uses UWB for centimetre-level proximity detection to keep forklifts and workers apart. With the 3 to 5 m accuracy of BLE RSSI, by the time an approach is detected contact may already have happened, which does not qualify as an alarm.
If safety is in scope, share one premise before the cost discussion begins, namely that the technologies meeting the requirement narrow down to UWB. Compromise here and you install an alarm that does not sound.
Use Case 4 | Quality Traceability Linkage Is Led by the Existing System
This use case ties the location history of work in progress to the manufacturing record. Being able to note in the quality record that “this lot sat for 4 hours before painting” gives you something to work with when investigating a defect.
The important point here is that RTLS does not stand alone. Value appears only once you integrate through APIs with the existing traceability or production management system and match location history against lot numbers. The accuracy requirement follows use case 1, but designing the integration between systems is harder than selecting the technology.
Decide during the evaluation stage which system receives the location data, at what granularity, and at what frequency. Leave this to later and you end up with an RTLS dashboard that runs perfectly while nobody in the quality department ever opens it.
UWB BLE Comparison Plus Passive RFID and Wi-Fi | The Characteristics Side by Side
Once the use cases are classified, you can move on to comparing technologies. Only now do the catalogue accuracy figures start to mean something.

| Technology | Positioning accuracy | Range | How position is expressed | Tag power | Relative cost |
|---|---|---|---|---|---|
| UWB | 10 to 30 cm | 1 to 50 m, up to 200 m in good conditions | Coordinates | Battery | High |
| BLE with RSSI | 3 to 5 m | Depends on receiver layout | Zone | Battery | Low |
| BLE 5.1 with AoA | 0.1 to 1 m | Depends on receiver layout | Close to coordinates | Battery | Medium |
| Passive RFID | Gate read only | Near the reader | Point | No battery | Cheapest tags |
| Wi-Fi | 5 to 15 m | Depends on existing AP layout | Zone | Battery | Medium, existing APs reusable |
UWB | Reserve It for Applications That Need Accuracy and Low Latency
UWB delivers 10 to 30 cm accuracy over a range of 1 to 50 m, reaching up to 200 m in favourable conditions. Its short pulses make it comparatively resistant to multipath, and it supports high update rates. It is the option for situations that need both precision and response speed, such as safety applications, AGV navigation, and tool position management in precision assembly.
Its weakness is cost. Both tags and infrastructure cost more than BLE or RFID, and the required anchor density is higher, so cost climbs sharply as the covered area grows. Blanketing an entire plant in UWB is a design nobody adopts without a very clear reason. Treat it as a technology you deploy area by area.
BLE | The Standard Answer for Zone Use Cases, With AoA Available for More Accuracy
BLE with RSSI gives accuracy of around 3 to 5 m, which is sufficient for any zone-level application. Tags are inexpensive with long battery life, and gateways run about USD 50 to 200 each, so the load on the infrastructure side is light. That is its main advantage.
Using AoA, the angle-of-arrival capability added in BLE 5.1, accuracy improves to 0.1 to 1 m. At that level it can cover applications approaching UWB territory, but AoA gateways carry antenna arrays and therefore cost more than ordinary BLE gateways, with more effort required for installation and calibration. When you choose BLE, go back to the use case table and confirm whether RSSI is enough or AoA is genuinely needed.
Passive RFID | A Technology for Capturing Passage Rather Than Position
Passive RFID is not strictly RTLS. The tag has no battery and is energised by the reader’s field, so it is detected only when it passes close to a reader. What you get is a record of passage rather than position, in other words a point.
Even so, the value of capturing those points cheaply and in volume is considerable, and tag unit prices are far below any other method. Placing gates at the main entry and exit points between processes and filling in the dwell between them with BLE is a strong design on cost-benefit grounds. The cost structure of RFID itself is broken down in RFID deployment cost breakdown and market rates.
Wi-Fi | Reuses Existing Infrastructure but Stops at Zone Accuracy
Wi-Fi positioning gives zone-level accuracy of around 5 to 15 m. Where existing access points can be repurposed for positioning, the advantage is a smaller infrastructure investment.
The tag side is not free, however. Wi-Fi tags are quoted at around GBP 40 to 80 each, which is more expensive than BLE tags, and they tend to consume more power. Whether your existing APs support positioning, and whether a licence is needed to enable it, varies by vendor, so confirm both at the quotation stage.
Breaking RTLS Cost Into Four Layers | Tags, Gateways, Software, Installation
RTLS quotations are hard to read because the cost splits across four layers and vendors differ in which layer they put each item. When you compare, always break the quotes into the following four layers first.
Layer 1 | Tags
This is the cost that scales with the number of things you track. It is determined by which of your trolleys, jigs, tools, vehicles and people get tagged, and how many. Unit prices vary widely by method, with passive RFID cheapest, followed by BLE, Wi-Fi and UWB in ascending order.
The item most often overlooked is the running cost of battery replacement. Operate several hundred tags and detecting flat batteries and swapping them becomes routine work. The replacement interval depends on the update rate setting, so the judgement described in trap 1, not demanding a faster refresh than you need, comes back here as an operating cost.
Layer 2 | Gateways and Anchors
This is the cost of the receivers installed around the building. The quantity is set by the covered area and the accuracy requirement, and density rises as accuracy rises. BLE gateways are quoted at around USD 50 to 200 each, and UWB anchors cost more than that.
This is the layer where the accuracy requirement hits the budget hardest. Demand centimetre accuracy for a job that only needs zone level and the unit count here multiplies. Think of this layer as the place where trap 2 shows up as money.
Layer 3 | Software
This is the part that receives the location data, displays it on a map, and aggregates dwell times and movement paths. Licensing models vary more here than anywhere else, ranging from a one-off purchase to annual subscription to per-tag metered pricing.
Integration development for existing systems also belongs here. Where you are building the traceability linkage described in use case 4, or synchronising master data with a production management system, it is not unusual for that development to cost more than the base licence. When comparing quotes, work through your own operating procedures rather than a feature list to determine whether standard functionality is enough or bespoke development is required.
Layer 4 | Installation
This covers the physical work of mounting gateways, power supply work, LAN cabling, and fitting brackets to ceilings and beams. In a running factory this layer expands beyond expectations, because conditions are attached, such as having to stop production for work at height, or a limited choice of equipment certified for explosion-proof areas.
This layer varies enormously with local building conditions, so no catalogue will tell you the figure. Conversely, getting a local contractor to walk the site early makes a dramatic difference to the accuracy of your capital request.
A Model Case Cost Estimate, Calculated In House
The following is our own estimate, prepared to show the structure of the cost rather than the price. The model is a fictional automotive parts plant in eastern Thailand with press, welding and assembly processes, a floor area of 10,000 square metres, and two shifts. It is not the record of a real plant, and every unit price is an assumed figure. Only the gateway unit price is anchored to published data, set provisionally at USD 120 as roughly the midpoint of the sourced range of USD 50 to 200.
Model A | A PoC Limited to One Area
The target is a single area of the welding process, about 1,500 square metres, with 200 BLE tags on WIP trolleys and 20 gateways installed.
- Tag layer, 200 BLE tags at an assumed USD 15 each, USD 3,000
- Gateway layer, 20 units at an assumed USD 120 each, USD 2,400
- Software layer, an assumed USD 8,000 initial with annual maintenance at an assumed USD 2,400
- Installation layer, an assumed USD 6,000
- Total initial cost, approximately USD 19,400
Model B | Zone Operation Across a Whole Building
Here the scope widens to the full 10,000 square metre building, with 800 tags and 90 gateways. Across a whole building the proportion of aisles and storage areas is higher, and zones there can be cut more coarsely than in process areas, so the area covered per gateway is assumed to be wider than in Model A.
- Tag layer, 800 tags at an assumed USD 15 each, USD 12,000
- Gateway layer, 90 units at an assumed USD 120 each, USD 10,800
- Software layer, an assumed USD 25,000 initial with annual maintenance at an assumed USD 7,500
- Installation layer, an assumed USD 30,000
- Total initial cost, approximately USD 77,800
Model C | Model B Plus UWB for Collision Safety
This overlays UWB on the roughly 2,000 square metres where forklift traffic concentrates, with 40 UWB anchors and 66 UWB tags covering 6 forklifts and 60 workers in that area.
- UWB anchors, 40 units at an assumed USD 350 each, USD 14,000
- UWB tags, 66 units at an assumed USD 60 each, USD 3,960
- Additional software layer, an assumed USD 12,000
- Additional installation layer, an assumed USD 15,000
- Additional total approximately USD 44,960, giving approximately USD 123,000 together with Model B
Line the three up and two things become visible. Widening the covered area by about 7 times raises the cost only about 4 times, while adding UWB for safety over an area that is only 20% of the building pushes the cost up by close to 60%. The first figure lags the area ratio because receiver density can be reduced, and because tag density and software licensing also grow more slowly than floor area, so every layer tapers. The second figure jumps because a higher accuracy requirement raises installation density directly even over a small area, while the safety functionality adds to the software layer as well. Treat RTLS cost as being set not by area itself, but by area multiplied by the accuracy demanded within it.
The benefit side can be estimated the same way. Borrowing the sourced figure of 10 minutes of searching per person per day equalling 40 hours per year, and assuming 40 people handle jigs and tools across processes, 1,600 hours a year disappear into searching. Multiply that by your own hourly labour cost to convert it into money, but use your own actual rate, since it differs from plant to plant. What matters is that the benefit of RTLS is spread across reduced dwell time, prevented safety incidents and lower stocktaking effort as well as search time. Try to justify the investment on a single benefit and it will usually fall short.
How to Deploy RTLS in a Factory | From Zoning and PoC to Full Rollout
With the cost structure visible, the next question is sequence. Designing RTLS to cover everything at once raises the failure rate, so the work is split into stages.
Stage 1 is fixing the use case. Pick one of the four quadrants and commit to it. Raise several use cases at once and the whole design gets dragged up to the accuracy demanded by the strictest one, and the cost follows. A realistic first choice is use case 2, where the benefit is easy to state in money, or use case 1, where visualising dwell usually reveals substantial room for improvement.
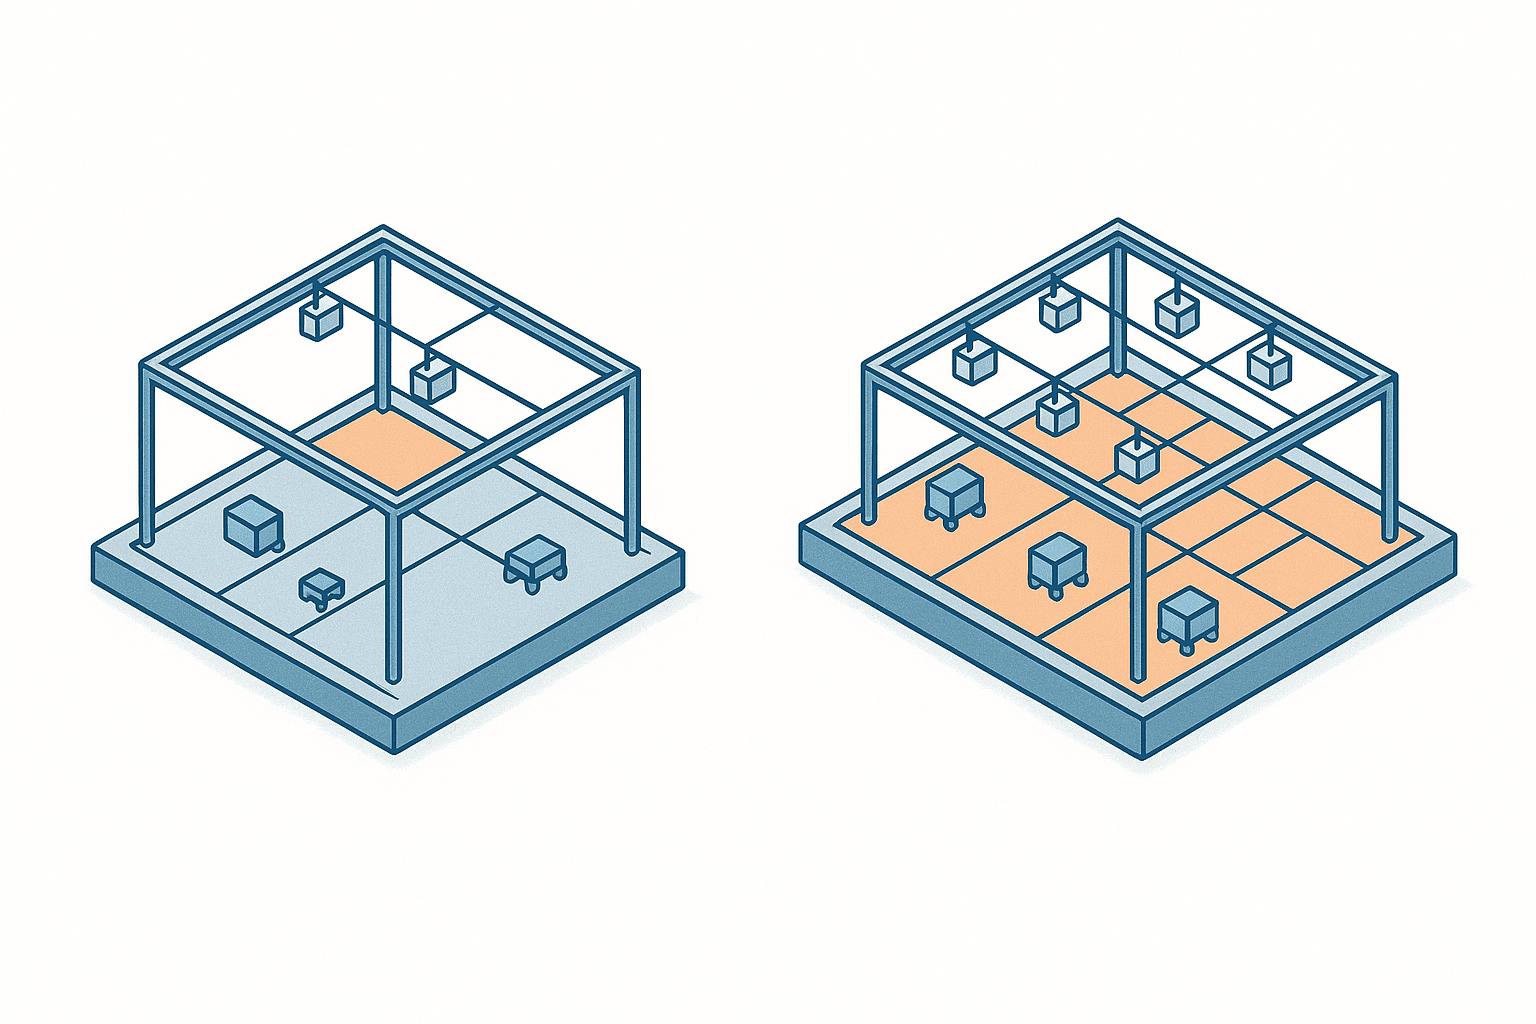
Stage 2 is zoning. Spread out the floor plan and decide the unit by which location will be divided. By process, by line, or by staging area. That division becomes your accuracy requirement. Skip zoning and go straight to model selection and you land directly in trap 2.
Stage 3 is a PoC in a limited area. Restrict it to one process area, install real equipment, and measure positioning accuracy in place. What you are confirming is the figure for your own building, not the catalogue. Deliberately choose difficult points, in front of and behind metal racking, in the shadow of machines, and where the ceiling height changes. A PoC measured only in the good spots is useless for designing the real thing.
Stage 4 is operational design. Who attaches and removes tags, who notices a flat battery and replaces it, who looks at the location data and when, and who acts when something is wrong. A system without answers to those four questions stops being opened about 3 months after go-live. Draft the operating procedure during the PoC and have the shop floor try it.
Stage 5 is the full rollout. Recalculate installation density from the measured PoC values and extend the covered area. Only at this point do you consider layering another use case on top. When you add one, always check whether you can do so without changing the existing zoning and data format.
The time from PoC to production varies with scope, but as a rule of thumb from what we have seen on site, allow 2 to 3 months from fixing the use case to having readable data, and around 6 months including the full rollout.
Issues Specific to Deploying RTLS in a Thai Factory
Everything so far applies generally. Japanese-owned plants in Thailand face some particular circumstances on top.
The first is reflection caused by building structure. Thai factories are typically steel-framed, and layouts with densely packed metal racking are common. The multipath reflection described in trap 3 can be stronger than in a plant in Japan. Even if you choose UWB, areas surrounded by metal may not deliver catalogue accuracy. The remedy is simple, which is to measure during the PoC and then set the production installation density. Import the installation density that head office derived from a plant in Japan and you will find yourself paying for additional work in Thailand when the accuracy does not materialise.
The second is standardisation across multiple sites. Where RTLS is deployed at several sites, Japan and Thailand, or Thailand and Vietnam, differing vendors and methods per site make it impossible to consolidate a dashboard at head office. UWB and BLE differ in both position data format and update rate, and aligning them afterwards on common indicators is not easy. The method itself can vary with each site’s use case, but settle the location data format, the way zones are defined, and the time synchronisation method in advance. This work is unglamorous, and vastly cheaper than realigning everything once consolidation has already started.
The third is the relationship between worker location and PDPA. Where workers themselves carry tags, as in the collision safety use case, that location data can constitute personal data. A record of who was where and when is safety data and a behavioural history at the same time. The handling of personal data in factory IoT is set out in Personal data protection for factory IoT 2026, and the structure is identical for RTLS. Either restrict the use case to asset tracking so that no individual is covered, or, if workers are in scope, state a purpose limited to safety, obtain consent, and fix the retention period and access rights. The point where this most often comes unstuck in practice is when location history from a system introduced for safety is later repurposed for attendance or productivity assessment. Repurposing may amount to use beyond the stated purpose, and it destroys shop-floor trust in a single step. Document the limitation on use at the time of deployment.
The fourth is movement in the surrounding industry. As background, Identiv, which supplies RFID and BLE capable IoT solutions, announced in December 2025 that it had completed the transfer of manufacturing from Singapore to a new plant in Bangkok, Thailand. The company positions this as a foundational milestone as a dedicated IoT business. It is not a direct RTLS deployment case, but it is worth reading as evidence that production capacity for advanced IoT equipment, including location tracking, is being strengthened in South East Asia. The reasonable reading is that procurement and support options may broaden over time, and nothing stronger than that.
Five Common Ways RTLS Deployments Fail
Finally, here are the typical stumbles that show up after go-live.
The first is trying to cover everything at once. A plan covering the whole factory carries a large number, drags out the approval process, and never settles as a design because conditions differ area by area, so half a year passes before anything starts. Plants that begin with a PoC in one area reach full coverage sooner in the end.
The second is adding tags when the accuracy is not there. Most accuracy shortfalls originate not with the tags but with gateway placement and the reflection environment. Adding tags does not fix it and increases the battery replacement burden. Measure reception first and revisit the layout.
The third is not deciding who looks at the location data. A screen with tags moving across a map gets plenty of attention right after go-live. A month later nobody opens it. What people need is not a map but a list sorted by longest dwell time, or a notification when a threshold is crossed. Decide who looks at what, when, and what they then do, before you specify the screen.
The fourth is leaving tag attachment and removal entirely to the shop floor. Tags that fell off a trolley, tags that went into someone’s locker and never came back, tags moved onto a different trolley. Once that management breaks down, the position is accurate but you no longer know what it belongs to. Define the procedure for updating the link between tag and object, and name who owns it.
The fifth is starting a safety application on a lower-accuracy method. Starting with BLE for budget reasons and replacing it with UWB later is a dangerous plan when safety is involved. An alarm that does not sound can be more dangerous than no alarm at all. For safety applications, either start with a method that meets the requirement, or do not start.
Frequently Asked Questions
What Should Be Decided First When Deploying RTLS in a Factory
The use case, not the technology. WIP tracking between processes, searching for jigs and tools, vehicle and worker collision safety, and quality traceability linkage each demand different accuracy and update rates. Narrow it to one use case, write the accuracy and update rate that use case requires into the specification, and choose the technology last. Reverse that order and you get one of two outcomes, either centimetre-grade equipment installed for a job that needed zone level, multiplying the cost, or an under-specified method used for a safety application, producing a system nobody trusts.
Should We Choose UWB or BLE
It depends on the use case. UWB delivers 10 to 30 cm accuracy over a range of 1 to 50 m, reaching up to 200 m in favourable conditions. For applications that need centimetre-class accuracy and a sub-second update rate simultaneously, such as forklift and worker collision prevention or AGV navigation, UWB is effectively the only option. BLE with RSSI gives 3 to 5 m, improving to 0.1 to 1 m with the AoA capability of BLE 5.1. For dwell visibility at process-area level or for finding tools, BLE is sufficient, and with gateways at around USD 50 to 200 each the infrastructure burden stays light. There is no need to choose exclusively between them. Covering most of the plant with BLE and overlaying UWB only in the limited areas that need safety is the realistic configuration.
How Much Does an RTLS Deployment Cost
Cost splits into four layers, tags, gateways, software and installation, and the layer that responds most strongly to the accuracy requirement is the gateway count. Among publicly available unit prices, BLE gateways run around USD 50 to 200 each and Wi-Fi tags around GBP 40 to 80 each, with UWB more expensive than both on tags and infrastructure. As an in-house estimate using a fictional model plant, this article showed approximately USD 19,400 for a single-area PoC, approximately USD 77,800 for zone operation across a whole building, and approximately USD 123,000 once UWB for collision safety is layered on top. All of these use assumed unit prices, and a real quotation will move with quantities and building conditions.
Can We Not Trace Work in Progress With RFID or Barcodes
It depends on the objective. If the objective is knowing how many there are and which lot passed which process, passive RFID, barcodes and job tickets are enough. That is a point record, and the tag unit price is incomparably lower. RTLS becomes necessary when you want to know what happened between the points. A job ticket will tell you that it took 90 minutes from process A to process B, but only continuous position tracking will tell you how many of those minutes vanished on which staging area. If the objective is finding bottlenecks in material flow, RTLS. If it is counting or identifying, RFID or conventional tracking. Using both, with RFID on the main process transitions and BLE filling in the dwell between them, is also effective.
Is There a Legal Problem With Asking Workers to Carry Tags
Location data on an individual worker can constitute personal data, so it is handled differently from tracking assets alone. Under the Thai PDPA framework you need to define the purpose clearly, explain it to the individual, obtain consent, and limit both the retention period and who can view the data. The practical point to watch is the case where location history from a system introduced for safety is later diverted into attendance management or productivity assessment. That may amount to use beyond the stated purpose, and it costs you the trust of the shop floor to the extent that the system stops being viable. If workers are in scope for a safety application, document the limitation on use at the time of deployment.
Summary
When deploying RTLS in a factory, the first fork is the use case, not the technology. WIP tracking between processes, searching for jigs and tools, vehicle and worker collision safety, and quality traceability linkage each demand a different combination of accuracy and update rate. Skip that classification and start from the centimetre figure in the catalogue, and you fall into one of three traps, confusing accuracy with update rate, demanding centimetre accuracy where zone level suffices, or believing catalogue figures despite multipath reflection.
On technology, the summary is UWB for safety applications needing centimetre class and low latency together, BLE for the majority of use cases that work at zone level, passive RFID for recording passage, and Wi-Fi where existing infrastructure can be reused. Compare cost by breaking it into the four layers of tags, gateways, software and installation, and keep in mind the structure by which the accuracy requirement drives the total through the gateway count.
The sequence runs from fixing the use case, to zoning, to a PoC in a limited area, to operational design, to full rollout. In the PoC especially, measuring at the difficult points, in front of and behind metal racking and in the shadow of machines, rather than the convenient ones, is what determines the quality of the production design. In Thailand, three further issues come into play, reflection from steel-framed buildings, unifying data formats across multiple sites, and the relationship between worker location data and PDPA.
Do you want to count stock, or know where it is right now? Answer that question before you enter the accuracy debate.
Which area to start with, how to connect to your existing production management and traceability systems, and what a PoC needs to measure to support the production design all have answers that depend on your building structure and current system landscape. TOMAS TECH works through these site-specific conditions with Japanese-owned plants in Thailand, drawing on our experience building production monitoring and traceability systems here. Even at an early stage where the direction is not yet settled, tell us which processes you have in mind and where the difficulty currently sits through our contact page. We can start from the practical questions, such as how to carve out the first use case and which area to put the first PoC in.
References
- Real-Time Location Systems Market (Polaris Market Research) — global RTLS market size estimates and the 18.6% CAGR outlook
- RTLS for Manufacturing and Automotive Market (MarketsandMarkets) — RTLS adoption trends in manufacturing including tool tracking and AGV navigation
- BLE vs UWB (Locaxion) — positioning accuracy and range for UWB and BLE, and the accuracy gain from BLE 5.1 AoA
- Technology Comparison of RTLS Technologies BLE vs UWB vs RFID (Sentrax) — accuracy by method and the position of Wi-Fi as zone-level positioning
- Indoor RTLS Asset Tracking Systems BLE vs UWB Technology Comparison (Strategic Tracking) — price ranges for BLE gateways and Wi-Fi tags, and a qualitative view of UWB cost-effectiveness
- Lost Tools, Lost Time (Nokia) — the Sandvik Coromant estimate of productivity lost to tool searching and its annual equivalent
- Forklift Collision Prevention (Browan) — US Bureau of Labor Statistics forklift incident data and a UWB proximity detection implementation
- Identiv Completes Thailand Manufacturing Transition (PR Newswire) — the December 2025 announcement of completed manufacturing transfer from Singapore to Bangkok
- NEC Networks and System Integration — RTLS product overview covering how real-time location systems work and where they are used (Japanese)
- SATO Corporation — real-time location system product overview on tracking the current position of people, assets and vehicles (Japanese)


