


The line goes down first thing in the morning, and it is back up the following evening. The cause gets written off as “probably that motor,” and the report lists “stricter daily inspections” as the countermeasure. If you run a Japanese-owned plant in Thailand or Vietnam, you have seen this play out. As long as major stoppage analysis depends on instinct and experience, the same failure keeps coming back wearing a different mask. This article separates major stoppages from minor ones, then walks through the root cause analysis procedure and the production data collection that has to sit underneath it.
What a major stoppage is and how it differs from a minor one
When people on the floor say “the equipment stopped,” they are lumping together two events with completely different characteristics. Managing both in the same log is the single biggest reason root cause investigations never go anywhere.
The JIS definition of a minor stoppage, and where major stoppages sit
A minor stoppage is defined in JIS Z8141 as a partial stoppage of equipment, or a stoppage caused by a defect in the object the equipment is acting on, that can be recovered from in a short time. In practice it means anything from a few tens of seconds up to about 10 minutes, where the operator standing at the machine clears a workpiece or presses a reset button and production resumes. No dedicated maintenance technician is called, and no parts have to be ordered.
A major stoppage is a different animal. A burned-out motor or a failed control board takes hours or even days to recover from. Parts have to be replaced, and a specialist maintenance technician has to get involved before anything moves. In a Thai plant, it is common for the sequence to start with discovering that the replacement part is not in country and has to be shipped in from Japan or China.
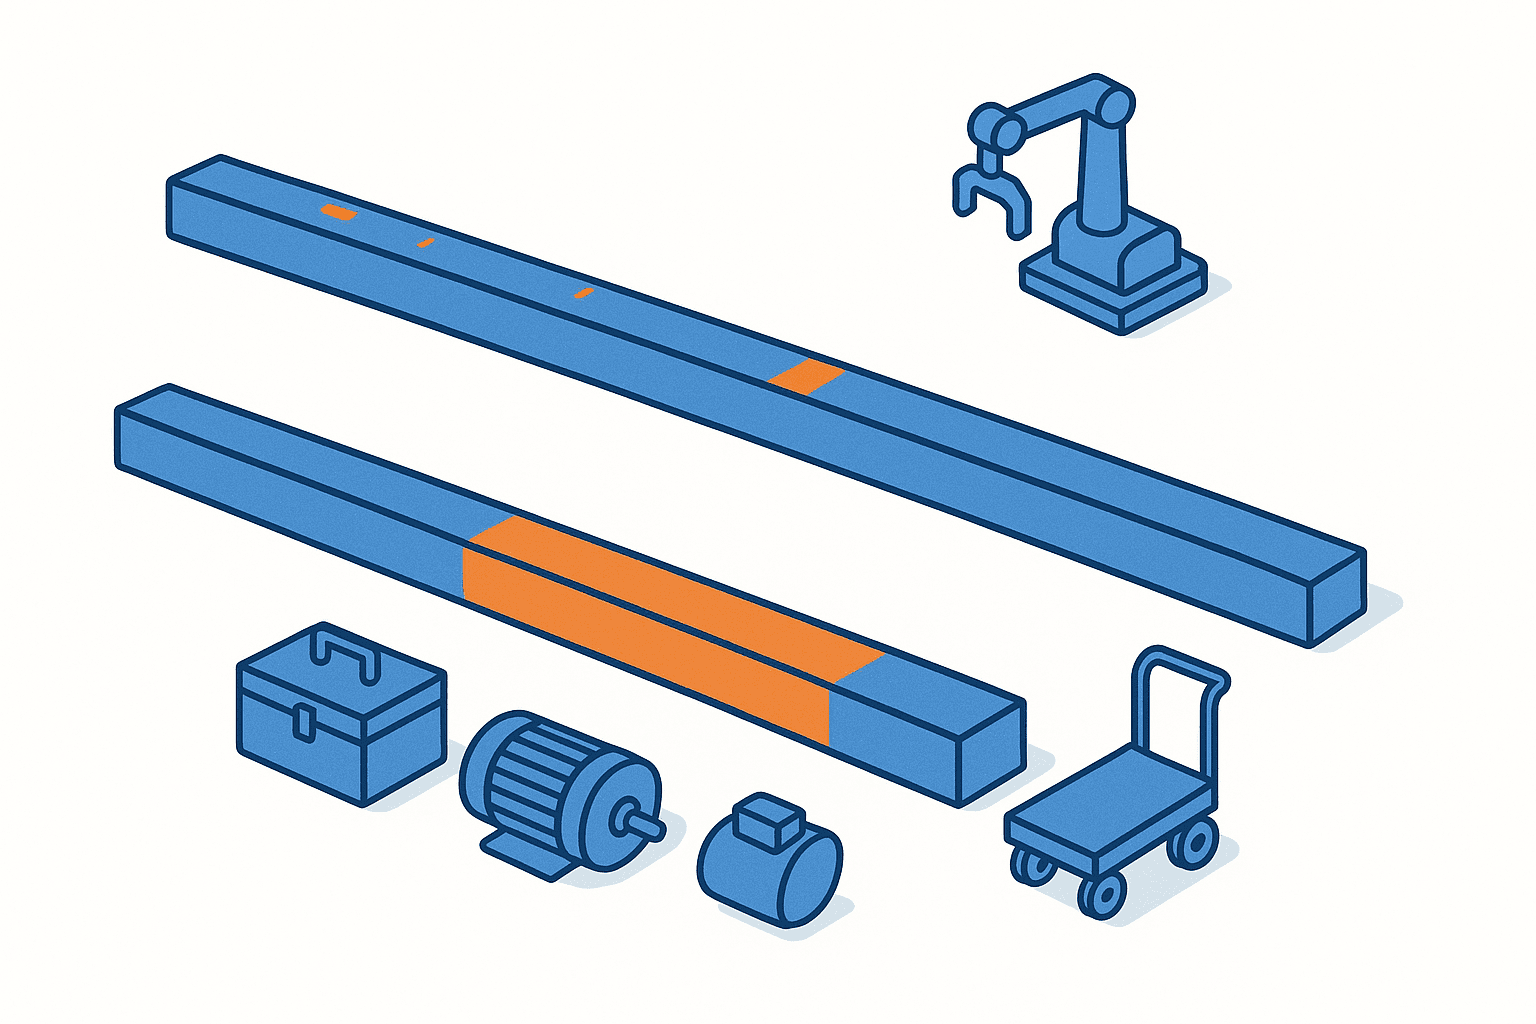
So what separates the two is not just how long the line was down. The people, the parts and the level of decision-making needed to recover are different all the way through. Laid out side by side, the contrast looks like this.
| Aspect | Minor stoppage | Major stoppage |
|---|---|---|
| Typical duration | Tens of seconds to about 10 minutes | Hours to days |
| Who recovers it | The operator at the machine | A specialist maintenance technician |
| What it takes | Clearing a workpiece, pressing reset | Parts replacement, calling in an outside vendor |
| Frequency | High and routine | Low and sporadic |
| Loss per occurrence | Small | Extremely large |
| What actually works | Shop floor improvement, mechanism redesign | Early warning detection, root cause analysis |
The last row of that table is the point of this whole article. Frequent minor stoppages respond well to continuous improvement activity on the floor. Infrequent but devastating major stoppages need a fundamentally different approach.
Why the loss per occurrence is an order of magnitude apart
Minor stoppage losses accumulate. A frequently cited calculation looks at a line producing 100 electronic components per minute at a unit price of 10 yen. If a 10-minute minor stoppage occurs once an hour, on 24-hour operation across 300 days a year, the annual loss reaches approximately JPY 72 million. Any single occurrence costs only about 10,000 yen, but the yearly total is a number the board notices.
Major stoppages invert that structure. The calculation above is for minor stoppages, but apply the same assumption of 1,000 yen of output per minute, and an 8-hour major stoppage comes to 480,000 yen in lost production alone. And with a major stoppage, lost production is only a fraction of the real cost.
- Air freight and spot-price purchasing for emergency parts
- Weekend and overtime work for maintenance technicians and operators
- Bumping other lines and running extra changeovers to recover the schedule
- Special shipments to the customer, or penalties for late delivery
- Quality degradation and scrapping of work in process left sitting during the stoppage
- The hours spent explaining the event to headquarters in Japan and the customer, and writing the corrective action report
In Japanese-owned plants in Thailand, that last item weighs far more than anyone expects. The plant manager spends the day after the stoppage buried in reporting material, and the actual investigation gets pushed back. The conclusion lands on “cause unknown, countermeasure is to increase inspection frequency,” and the same class of failure returns six months later. Breaking that cycle is what stoppage root cause analysis is for.
You cannot prevent major stoppages by extending minor stoppage countermeasures
Minor stoppages happen often enough that a few weeks of data reveals patterns. A process where the sensor misreads, a chute where workpieces jam up. The symptom and the location map onto each other cleanly.
Major stoppages do not cooperate. For an event that occurs a few times a year, trying to reconstruct after the fact why it happened runs into a wall, because no data describing the state of the equipment at that moment was ever recorded. All that survives is a single line in the daily report saying the line stopped due to motor failure. There is nothing there to analyze.
The essence of major stoppage analysis is not post-incident investigation, it is data design done in advance. Whether the cause can be identified is determined by whether you were continuously capturing runtime data such as current, temperature, vibration and cycle time long before the failure. For the minor stoppage side of the problem, see our article on minor stoppage countermeasures.
Why major stoppage analysis is urgent for Japanese-owned plants in Southeast Asia
The same major stoppage does not carry the same weight in a plant in Japan and a plant in Thailand or Vietnam. Local structural factors are behind the difference.
Labor shortage and productivity as structural constraints
On the environment surrounding Thai manufacturing, the Krungsri industry outlook as of January 2026 points to declining industrial competitiveness, labor shortages and low labor productivity as structural drags on medium-term growth. In the IMD World Competitiveness Ranking, Thailand slipped to 30th in 2025, down from 25th the year before.
What that means on the shop floor is that the room to recover through sheer headcount is shrinking year by year. When a major stoppage hits, the traditional answer of burning a Saturday on overtime to catch up is becoming difficult to sustain, both in terms of securing people and in terms of labor cost.
The risk of maintenance that lives in one person’s head
At many Japanese-owned plants, the person who knows the quirks of the equipment is one or two specific Thai maintenance leads. The judgment that a particular noise means trouble exists only inside that person’s head. That arrangement carries two risks.
The first is that when the person is on leave or leaves the company, nobody can make the call. The second is that because the basis for the judgment is never recorded as data, it cannot be explained to headquarters in Japan. “I know from experience” is not material that gets a capital expenditure request approved at head office.
Accountability to headquarters in Japan
What headquarters expects from a local plant manager gets more specific every year. When a stoppage occurs, the ask is to show in numbers when it happened, which equipment stopped, for how many hours, what caused it, and what will prevent recurrence.
Managed on daily paper reports, simply answering those questions takes days, and the answers are not very accurate. Plants that have a production data collection system and plants that do not end up in completely different positions internally after the same stoppage.
The shape of stoppage root cause analysis in six steps
The standard procedure for identifying the cause of a major stoppage is root cause analysis, or RCA. For manufacturing, RCA is structured as six steps.
| Step | Content | Main output |
|---|---|---|
| 1 | Problem definition | The stoppage event identified and quantified |
| 2 | Data collection | Runtime records, alarm history, work records |
| 3 | Identifying candidate causes | Pareto chart, five whys, fishbone diagram |
| 4 | Verifying the root cause | Evidence that supports the hypothesis |
| 5 | Implementing corrective action | Actions executed with named owners |
| 6 | Ongoing monitoring | Effect measurement and recurrence checking |
The order of these six steps matters. Below is what each one actually looks like on the floor.
Step 1 Problem definition
Start by deciding in numbers what counts as a problem. “The equipment stops and it causes trouble” is not a definition. Write it as something like “any event where the filling machine on Line A stops for 30 minutes or more,” naming the target equipment, the threshold and the period.
Setting that threshold is the first step toward separating minor and major stoppages in the log. Draw the line at 30 minutes and from that moment the two become separate objects of analysis.
Step 2 Data collection
This is where the analysis is won or lost. What you need is not only the record of the stoppage, but the state of the equipment on the way to it. The section on production data collection later in this article covers the detail.
Step 3 Identifying candidate causes
Draw up candidate causes from the data you have. Three tools get used here, each for a different job: the Pareto chart, five whys and the fishbone diagram. Take an overview with the Pareto chart first, then dig into only the top-ranked events with five whys and the fishbone diagram. Working in those two stages stops your limited analysis hours from spreading thin.
Step 4 Verifying the root cause
Once you have candidates, verify that they really are root causes. The test is simple. Can you answer with confidence whether removing this cause would stop this failure from happening? If you cannot, you are still looking at a symptom and have not reached the cause.
Step 5 Implementing corrective action
Every countermeasure gets an owner and a deadline. A countermeasure with no subject, like “stricter inspections,” cannot be checked afterwards to see whether it was carried out, so it does not qualify as a countermeasure at all. Drive it down to something like “A in the maintenance section will implement automatic alerting when bearing temperature exceeds the set value, by the end of this month.”
Step 6 Ongoing monitoring
Keep watching to confirm the same stoppage does not recur. If you use a metric such as OEE here so the effect of the countermeasure can be shown in numbers, your headquarters reporting material assembles itself.
Using a Pareto chart to find the 20 percent of causes
The first tool to reach for in stoppage root cause analysis is the Pareto chart. Plot the downtime by cause as bars in descending order, and overlay the cumulative ratio as a line.
Setting priorities with the 80/20 rule
Manufacturing downtime is widely held to follow the 80/20 rule, where 20 percent of the causes account for 80 percent of the downtime. Count up your stoppage causes and you get 20 or 30 of them, but measured in time, the top handful explain most of the total.

Why that matters in practice is that the answer to where you spend your limited maintenance resources is decided by data rather than by debate. Instead of following whoever argues loudest in the meeting, you work from the left edge of the Pareto chart inward. That change alone moves the cost effectiveness of your countermeasures substantially.
The flip side is that building the Pareto chart by number of occurrences will fail you. Ranked by count, minor stoppages take every top slot and the motor burnout that happens twice a year sits buried at the bottom. A Pareto chart for major stoppage analysis must be built on cumulative downtime or on financial loss.
When to use five whys and when to use a fishbone diagram
Once the Pareto chart has told you where to attack, the next question is why it happened. Two tools split the work here.
Five whys is a vertical tool. It takes a single event, repeatedly asks why, and follows the chain of causation downward. It suits events where you already have some idea of the cause.
The fishbone diagram is a horizontal tool. It sweeps for candidate causes across perspectives such as people, equipment, materials, methods, measurement and environment. It suits events where you have no idea at all what caused them.
In practice, the easiest flow is to widen the candidate set with a fishbone diagram first, then take the most promising branches deeper with five whys.
Three mistakes people make in the analysis
The first is stopping the five whys at human fault. Stop at “because the operator neglected the inspection” and your countermeasure can only be an appeal to discipline. Push on to “because the system gave no way to notice when an inspection was skipped.”
The second is analyzing from memory. Witness accounts gathered a week after the stoppage are already reconstructed memories. Without data, analysis always converges on the hypothesis of whoever speaks loudest.
The third is firing off countermeasures and walking away. Only by carrying through to the ongoing monitoring of step 6 do you learn whether the countermeasure was the right one.
How to start collecting production data
Of the six RCA steps, the one plants in Southeast Asia struggle with most is step 2, data collection. Trying to fill that gap with hand-written daily reports leaves you short on both accuracy and timeliness.

What data to collect
The data needed for major stoppage analysis falls into three broad layers.
- Operating state layer: the distinction between running, stopped, changeover and idling, and the timestamps of each transition
- Stoppage information layer: stoppage start time, end time, stoppage reason code, and who recovered it
- Equipment condition layer: motor current, bearing temperature, vibration, hydraulic pressure, cycle time
A daily report captures only part of the second layer. And the early warning signs of major stoppages such as burnouts and board failures appear in the third layer. In a plant that is not capturing the third layer, no amount of post-failure meetings will identify the cause.
Three options for collecting it
Which collection method is realistic depends on how your equipment is configured.
| Method | Suits | Implementation effort | Granularity obtained |
|---|---|---|---|
| Reading directly from the PLC | Relatively new Japanese, European or US equipment | Medium | High, down to internal state |
| Retrofit IoT sensors | Older equipment, equipment that cannot be modified | Low | Medium, current, vibration and temperature |
| Monitoring stack lights and contact signals | Mixed-model lines with multiple equipment makers | Low | Low, running versus stopped only |
There is no need to pick just one. Mixing methods machine by machine along a line is the realistic answer. A combination that works well in Thai plants is to start with stack light monitoring so that running and stopped states are captured across the whole line without gaps, then add retrofit sensors for current and temperature on only the critical machines most likely to cause a major stoppage. Our article on capturing equipment runtime logs covers the acquisition methods in detail.
The design of stoppage reason codes determines the quality of the analysis
Automation captures the fact that something stopped. Why it stopped still has to be entered by a person. This is where the design of stoppage reason codes earns its keep.
There are three points to code design. First, keep the list to around 20 options. Go past 50 and operators will only ever pick the first item or “other.” Second, display them in Thai. A list of English technical terms will not be selected accurately. Third, review the count of “other” selections every month and promote the most frequent ones into proper codes.
That third point is unglamorous as an operating routine, but six months on, plants that keep it up and plants that do not are clearly separated in the quality of their analysis.
Where plants in Thailand tend to get stuck
When you start collecting data locally, the things that stall the project are often not technical.
- The equipment maker will not disclose the communication specification, so values cannot be read from the PLC
- The plant network does not separate production and information systems, so the IT department will not approve the connection
- Power outages or surges knock over the collection terminal and leave gaps in the data
- Operators asked to enter data read it as surveillance and stop cooperating
The last point matters most. Stating up front that stoppage reason entry exists to fix the equipment and not to evaluate the operator, and then feeding the collected data back to the floor where people can see it, is what decides whether the practice takes hold. If the data only ever appears in the monthly management meeting, the floor has no reason to keep entering it.
Turning collected data into early warning detection
The real value of production data collection is not that the monthly report generates itself, it is that you can act before the next major stoppage happens. Motor burnouts and bearing failures, the classic major stoppages, look like they arrive out of nowhere, but in many cases the signs have been building in the equipment condition data over weeks or months.
Catching those signs does not require starting with difficult statistics. Begin by saving the current and temperature traces from a period when the machine was running normally as your baseline waveform. Then overlay recent traces taken under the same conditions and check how far they have drifted from the baseline. If average motor current is creeping upward while the same product runs at the same speed, mechanical resistance is likely increasing.
Because having a person compare those traces daily is not realistic, build in automatic alerting when a threshold is crossed. The key point is that the threshold should come from the measured distribution of your own plant’s normal operation, not from the protection setting given by the equipment maker. The maker’s protection value is a last line of defense to keep the machine from destroying itself, and by the time you reach it the major stoppage has already begun.
Then decide in advance who checks what, and within how many hours, when an alert fires. A state where alerts pile up and nobody looks at them is functionally no different from collecting no data at all. It is actually worse, because you also lose the trust of the floor. Early warning detection is a question of operating rules as much as it is a question of technology.
Measuring the results of major stoppage analysis with OEE
The common metric used to demonstrate the effect of analysis and countermeasures is OEE, overall equipment effectiveness.
World class at 85 percent, industry average at 60 percent
OEE is calculated by multiplying three factors together: availability, performance and quality. The level regarded as world class is 85 percent or above, which breaks down as availability of 90 percent, performance of 95 percent and quality of 99.9 percent multiplied together. The industry average, by contrast, is put at about 60 percent.
That 85 percent benchmark originates in the TPM, or total productive maintenance, framework of Seiichi Nakajima, and it was confirmed again in a 2025 study by Fabrico covering 250 European factories. A benchmark set out within TPM still holding up against current measurements in European plants is a solid reason to adopt it as a target for your own site.
Where major stoppages hit OEE
What a major stoppage hits directly is availability. Lose one hour out of eight hours of planned operating time and availability falls to 87.5 percent on its own, short of the world class 90 percent. Even at a few occurrences a year, averaged across a month or a year, major stoppages push availability down by several points.
What gets overlooked is the ramp-up loss after a major stoppage. Immediately after restarting equipment that has been down for a long time, plants commonly run at reduced speed until temperature and quality stabilize, and that drags down both performance and quality. In other words, a major stoppage propagates into all three OEE factors. Our broader thinking on improving OEE is set out separately.
What the case studies show
As an example of systematically adopting RCA, one manufacturer running CNC machining equipment reported a 40 percent reduction in unplanned downtime, a 25 percent reduction in maintenance cost and a 10 percent improvement in OEE. The root cause actually found in that case was inadequate filter cleaning, and the countermeasures implemented were automatic alerting, operator training and stronger temperature monitoring.
What deserves attention is that downtime reduction and maintenance cost reduction were achieved at the same time. Normally, reducing stoppages means increasing inspection frequency and spare parts inventory, which pushes maintenance cost up. Both came down together because the Pareto chart and RCA narrowed the aim onto an unremarkable but precisely correct cause, filter cleaning. That is the substantive benefit of data-driven stoppage root cause analysis.
A 90-day roadmap to start major stoppage analysis
You do not need to instrument every line at once. Here is a startup sequence that runs realistically in a Thai plant, laid out over roughly 90 days.
| Period | What to do | Completion criteria |
|---|---|---|
| Weeks 1 to 2 | Select the target line and define what counts as a stoppage | The threshold, such as 30 minutes or more, documented |
| Weeks 3 to 6 | Deploy automatic running and stoppage capture on one line | Daily utilization visible from stack light monitoring |
| Weeks 5 to 8 | Design stoppage reason codes and start Thai-language entry | The share of “other” below 20 percent |
| Weeks 7 to 10 | Add current and temperature sensors on critical equipment | Pre-stoppage equipment condition visible retrospectively |
| Weeks 9 to 12 | Run the first RCA from a downtime-based Pareto chart | Owners and deadlines assigned to the top three causes |
| Week 13 onward | Measure effect with OEE and roll out to further lines | Monthly headquarters reporting material generated automatically |
The important feature of this roadmap is that automatic collection starts in week 3 while analysis is held back to week 9 and later. Try to start with analysis and you will run aground on missing data every time.
Setting explicit criteria for moving between stages also speeds up internal agreement. Treat the following three conditions as the signal that you may extend to the next line. First, downtime on the target line is aggregated daily and automatically. Second, the share of “other” among stoppage reasons is held below 20 percent. Third, at least one of the top three causes raised in the first RCA has a completed countermeasure whose effect is confirmed in numbers.
Frequently asked questions
What is the difference between a major stoppage and a minor stoppage
The duration and the resources needed for recovery. A minor stoppage is defined in JIS Z8141 as a partial stoppage of equipment, or a stoppage caused by a defect in the object the equipment is acting on, that can be recovered from in a short time, meaning tens of seconds to about 10 minutes with the operator recovering it on the spot. A major stoppage means a serious failure such as a motor burnout or board failure, taking hours to days to recover and requiring parts replacement and a specialist maintenance technician. Frequent minor stoppages with small losses respond to shop floor improvement, while infrequent major stoppages with large losses need early warning detection and root cause analysis. Managing both in one log lets the high-count minor stoppages pull the analysis toward themselves and buries the causes of major stoppages.
Where should stoppage root cause analysis start
Narrow the scope to a single line and start by setting the threshold for what counts as a major stoppage. Documenting a line such as 30 minutes or more gives you a log that does not get mixed up with minor stoppages. From there, follow the six RCA steps of problem definition, data collection, identifying candidate causes, verifying the root cause, corrective action and ongoing monitoring. At the stage of narrowing candidate causes, build the Pareto chart on cumulative downtime and use the 80/20 rule, where 20 percent of causes account for 80 percent of downtime, to decide the order of attack. Building the Pareto chart on occurrence counts lets minor stoppages take the top slots, so always rank by time or by financial loss.
How should production data be collected
Match the method to the age and communication specification of the equipment. Relatively new machines can be read directly from the PLC, giving fine visibility down to internal state. For older equipment and equipment that cannot be modified, retrofit IoT sensors measuring current, vibration and temperature are the realistic option. On mixed-model lines with multiple equipment makers, an easy configuration is to monitor stack lights or contact signals first so running and stopped states are captured across the whole line without gaps, then add sensors only on the critical machines most likely to cause a major stoppage. Alongside that, design roughly 20 stoppage reason codes displayed in Thai, and set up a routine of reviewing the contents of “other” every month to grow the code list.
How should the results of the analysis be evaluated
OEE, overall equipment effectiveness, is the usual measure. The world class level is 85 percent or above, made up of availability of 90 percent, performance of 95 percent and quality of 99.9 percent multiplied together. The industry average is put at about 60 percent. Major stoppages not only hit availability directly, they also propagate into performance and quality through ramp-up loss after restart, so they show up in all three OEE factors. In one case of systematic RCA adoption at a manufacturer running CNC machining equipment, the reported results were a 40 percent reduction in unplanned downtime, a 25 percent reduction in maintenance cost and a 10 percent improvement in OEE.
Summary
The key points of major stoppage analysis.
- Major and minor stoppages are genuinely different things, separated not only by duration but by the resources recovery requires
- Infrequent major stoppages can only be diagnosed from production data accumulated in advance, never from interviews conducted after the fact
- Run stoppage root cause analysis as six steps from problem definition through ongoing monitoring, and build the Pareto chart on downtime rather than counts
- Start production data collection with stack light monitoring and add current and temperature sensors on critical equipment, staging the deployment
- Keep stoppage reason codes to around 20 options in Thai and review “other” monthly to grow the list, because that routine determines analysis quality
- Measure the effect with OEE, using world class 85 percent and the industry average 60 percent as reference lines for headquarters reporting
With Thai manufacturing facing structural constraints in labor supply and productivity, the traditional practice of recovering from major stoppages by throwing people at them is close to its limit. The shift is from responses that rest on one person’s instinct to root cause analysis grounded in data. The first step is not a large capital investment, it is beginning to record running and stopped states automatically on a single line.
TOMAS TECH is based in Bangkok and supports Japanese manufacturers across Thailand and Southeast Asia with the PEGASUS production management system and with putting shop floor IoT data to work. We are glad to discuss production data collection that makes use of your existing equipment, stoppage reason code design, and building reporting formats for submission to headquarters in Japan, tailored to the realities of your site. It is entirely fine if you are still at the stage of shaping the idea. Tell us about the situation on your floor through our Contact page.
References
- Definitions distinguishing minor and major stoppages, and the sample annual loss calculation for minor stoppages, from a Japanese-language manufacturing column on inasho.com
- The six steps of root cause analysis in manufacturing, Pareto-based 80/20 prioritization, and the reported results at a manufacturer using CNC machining equipment, from FourJaw, Root Cause Analysis in Manufacturing
- The world class OEE level of 85 percent and the industry average of 60 percent, the TPM framework of Seiichi Nakajima, and the Fabrico study of 250 European factories, from Fabrico, OEE Benchmark
- Structural challenges in Thai manufacturing and the movement in the IMD World Competitiveness Ranking, from Krungsri Research, Thailand Industry Outlook 2026-2028


