



A voltage monitoring system does not explain an equipment trip if it leaves no evidence from before and after the event. The team still cannot distinguish a voltage dip from an internal load change, a protection setting, control power, or another failure. This guide is for factories in Thailand. It separates periodic voltage and energy visibility, event monitoring, and engineering-grade power-quality measurement, then turns them into a practical plan for placement, time synchronisation, a 30-day PoC, RFP, FAT/SAT, and a 90-day investment gate.
What is a voltage monitoring system, and why must its purpose come before the dashboard?
A voltage monitoring system obtains voltage and related electrical values at points such as the incoming supply, distribution boards, feeders, equipment inputs, and control-power circuits. It can display and record values, detect events, issue notifications, and support analysis. The label covers very different capabilities. A PLC analogue input that shows a periodic value, a networked energy meter, and a power-quality instrument that records voltage dips, short interruptions, and harmonics answer different questions.
Separate the solution into three layers before selecting a product:
- Periodic display and energy visibility: see present values, demand, energy use, and trends for operations improvement and early anomaly detection.
- Event monitoring: capture a voltage change against defined conditions and retain its start time, duration, affected point, and records from before and after the event.
- Engineering-grade power-quality analysis: use defined measurement methods for comparable treatment of frequency, voltage magnitude, flicker, dips, swells, interruptions, transients, unbalance, harmonics and interharmonics, rapid voltage changes, and related parameters.
Periodic visibility is not inferior. It is useful for energy consumption and long-term trends. It may, however, leave a blind spot when a root-cause study needs a phenomenon shorter than the collection interval or a waveform around the event. The opposite extreme is also poor design: deploying the most capable instrument at every point does not guarantee value. The layers should be combined according to purpose and risk.
What monitoring can and cannot establish
Monitoring strengthens the record of what changed, where, and when. If clocks at multiple points agree and the data can be linked to machine-trip logs, the evidence can narrow the hypotheses. It does not follow that an event first seen at the incoming supply automatically proves utility responsibility. The investigation may still need to consider plant distribution, starting current, loose connections, relay settings, control power, equipment immunity, software, and communications.
PEA Power Map is an official planning reference for broad network capacity. Its own page says the information is preliminary and not legally binding. It is not a diagnosis of power quality or responsibility at a particular factory. When monitoring evidence is used in an external discussion, its quality still depends on the measurement purpose, method, calibration, placement, time record, and disclosure of missing data.
IEC 61000-4-30:2025 and the purpose boundary between Class A and Class S
IEC 61000-4-30:2025 is the current fourth edition on methods for measuring power-quality parameters. It replaced the 2015 edition, and the IEC page lists Corrigendum 1 dated July 2026. Its scope includes power frequency, supply-voltage magnitude, flicker, voltage dips, swells, interruptions, transients, voltage unbalance, harmonics and interharmonics, rapid voltage changes, current magnitude, and current unbalance.
The standard defines Class A and Class S measurement methods. A procurement team should not decide that Class A is always required because it is perceived as higher, or that Class S is always sufficient because it may cost less. The owner must state whether the purpose is a potentially contractual comparison, rigorous comparison among instruments, a detailed engineering survey, fleet screening, trend detection, or internal troubleshooting. The class should follow that purpose. This article does not reproduce paywalled tables or declare universal thresholds.
IEC 62586-1:2017 specifies product and performance requirements for power-quality instruments whose Class A or Class S methods are defined in IEC 61000-4-30. This does not make every smart meter, protection relay, PLC input, or IoT gateway compliant. Do not accept a marketing phrase such as “power-quality ready” in place of the applicable standard, edition, class, covered parameters, evidence of conformity, and test conditions.
IEEE 1159-2019 is a useful engineering reference covering descriptions of power-quality phenomena, monitoring devices, application techniques, and interpretation. It is not a Thai statutory limit. IEEE 1159.3-2025 defines PQDIF for vendor-independent transfer of raw and processed power-quality data and metadata. PQDIF can be an interoperability consideration, but it is not mandatory for every project.
Monitoring and immunity testing are different activities
Monitoring observes what happened in the factory. Immunity testing asks whether equipment can withstand a defined phenomenon. IEC 61000-4-34:2005+A1:2009+A2:2025 covers immunity tests for voltage dips, short interruptions, and voltage variations for equipment above 16 A per phase. Do not generalise that scope to every device. After monitoring finds an event, verify the affected equipment specification, applicable standard, test report, and actual control-power arrangement.
Where should voltage monitoring be placed, from the incomer to control power?
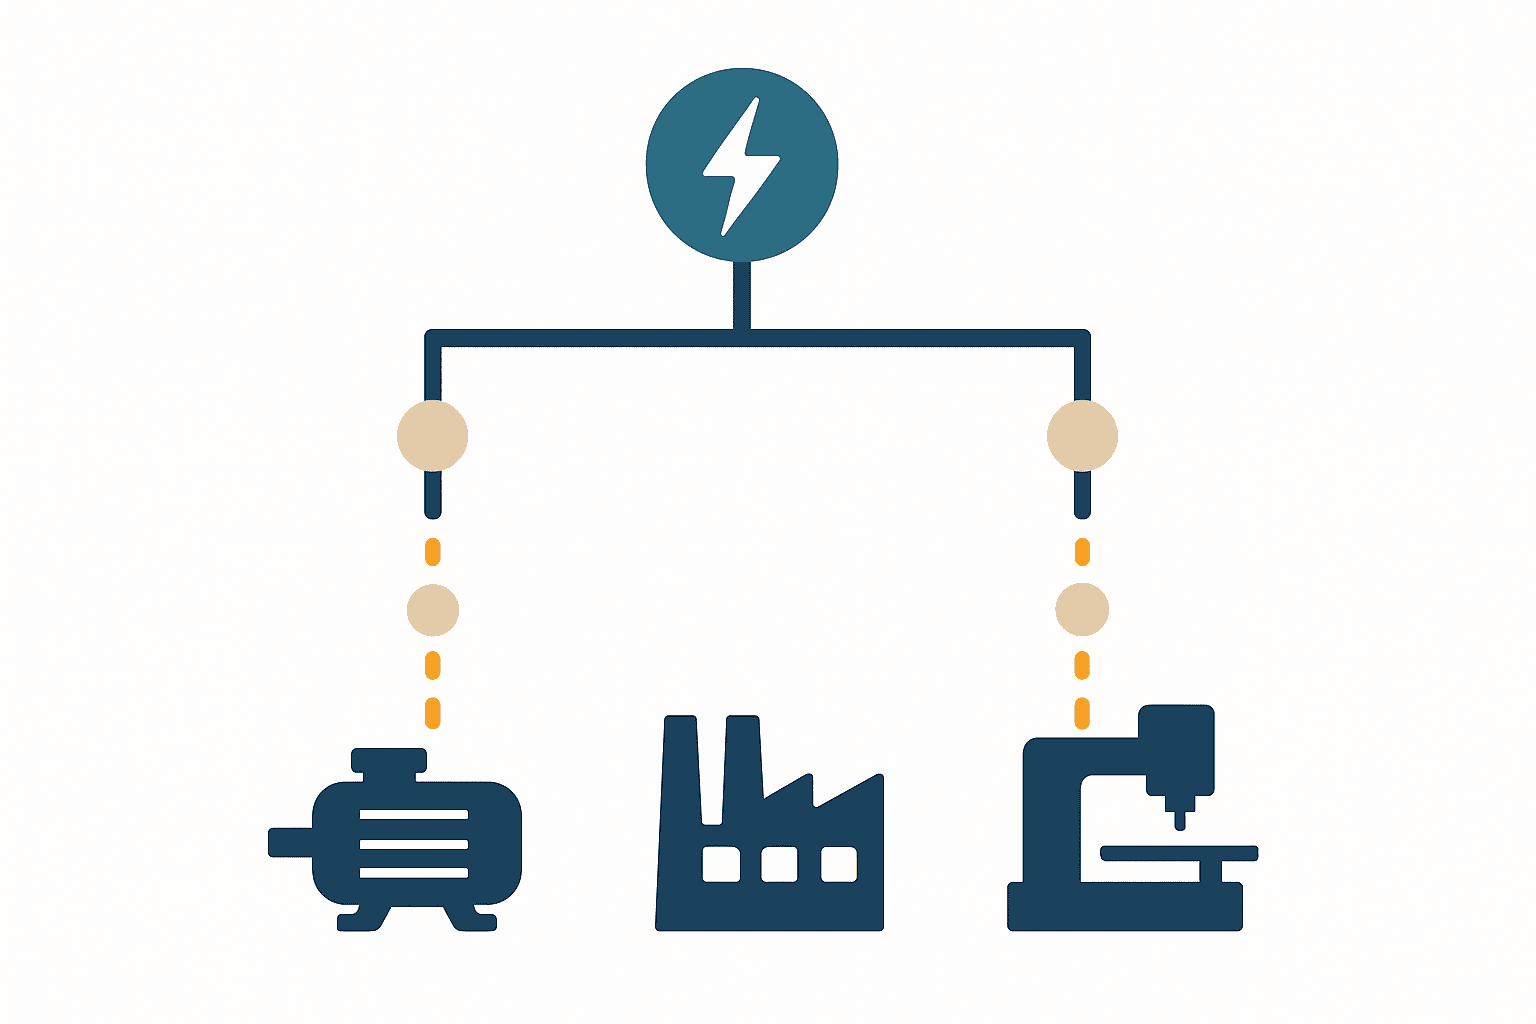
The same instrument produces different conclusions at different locations. Monitoring only the incoming supply is useful for phenomena common to the plant, but it may not identify the feeder or load involved. Monitoring only an equipment input cannot show whether the phenomenon travelled from upstream or arose locally. Hierarchical placement is not intended to produce an automatic verdict; it creates observation points that allow competing hypotheses to be compared.
| Monitoring location | Main question | Evidence to retain | Main limitation |
|---|---|---|---|
| Incoming point | Did the phenomenon enter the plant or affect it broadly? | Three-phase event time, duration, waveform or aggregate, relation to current | Weak at locating an internal source or vulnerable asset |
| Main feeder | On which distribution path is the phenomenon concentrated? | Feeder ID, wiring and ratios, voltage/current, protection operation | Leaves differences among downstream branches and assets |
| Branch or equipment input | What did the affected machine actually receive? | Asset ID, operating state, trip time, pre/post-event context | Without upstream comparison, internal and external causes remain hard to separate |
| Control-power side | Is the event related to a PLC, IPC, sensor, or relay reset? | AC/DC state, UPS, control log, restart or communication loss | Main-circuit monitoring is not a substitute; methods can differ |
A placement decision sequence
First select trips with significant loss, safety impact, or quality impact. Overlay the single-line diagram with distribution boards, transformers, major loads, protection devices, UPS systems, and control-power paths. Trace the electrical route to each affected machine. Choose a comparable combination of incoming, shared-feeder, and equipment-input points. Temporary measurement can narrow the hypothesis before the permanent scope is fixed.
Start/stop logs for variable loads such as motors, welders, heaters, compressors, and drives are also useful. Correlation is not causation. A load that changes at the same time may be the source, or it may simply have experienced the same upstream event. Current, voltage, directionality where available, event order at several points, and protection logs help distinguish the cases.
Work on live panels and voltage inputs, CTs, or VTs can introduce shock, arc, miswiring, and protection risks. This article is not an electrical-work instruction. Design, risk assessment, outage planning, work permits, isolation, protective equipment, and tests must be handled by authorised, competent personnel under site rules and applicable Thai requirements.
A data contract linking energy metering and voltage-dip monitoring
Before connecting devices, define what each record and event means. Without a data contract, a dashboard may be full of numbers yet remain impossible to correlate with an equipment trip.
| Data field | Minimum decision | Evidence requested in the RFP |
|---|---|---|
| Timestamp | Time zone, precision, event start/end representation | Time source, sync state, drift record, recovery after outage |
| Point ID | Unique identity for incomer, board, feeder, and asset | Register, single-line diagram, labels, change history |
| Wiring and ratio | Phase, CT/VT ratio, polarity, circuit-change date | Configuration export, inspection record, approval history |
| Event | Type, start, duration, representative value, decision condition | Definition, settings, change log, reproducibility test |
| Waveform and context | Pre/post-event record, related current, operating state | Format, capture range, quality flag when missing |
| Data quality | Missing data, time error, out-of-range value, communication loss | Flag definition, interpolation policy, completeness report |
| Device condition | Calibration, firmware, restart, setting change | Certificate, version, backup, audit trail |
| Export | API, CSV, standard format, raw-data retention | Sample file, schema, re-import test |
| Access | Roles for view, configure, approve, and maintain | Permission matrix, authentication, operation log, periodic review |
“NTP enabled” is not a complete time specification
The procurement specification should state the time source, hierarchy, synchronisation interval, permitted drift, out-of-sync flag, restart behaviour, ICT representation without daylight saving, and whether UTC is stored. If meters, SCADA, PLCs, MES, and machine controllers disagree, even a ±2-second correlation window loses meaning. FAT and SAT should deliberately remove the time source and verify the alarm, buffering, recovery, and audit record.
Retain decision context, not just an event summary
A summary stating “one voltage dip” does not allow a reviewer to reconsider which phases were affected, how long the event lasted, or what current did before and after it. Yet unlimited high-resolution retention is not automatically appropriate. Design separate retention for event data, necessary waveforms, and periodic trends according to the investigation purpose, frequency, network, storage cost, confidentiality, and future re-analysis. The owner should enter justified retention periods rather than copying a universal number from an article.
Design the OT architecture and security together
As explained in our SCADA system selection guide, monitoring value depends not only on collection but also on continuity during outages, traceable changes, and delivery to the right people. NIST SP 800-82 Rev. 3 is the current final OT security guide and explicitly considers OT reliability and safety constraints. A pre-draft call for Rev. 4 opened in January 2026, but Rev. 4 is not final; use Rev. 3 as the current normative reference.
Apply the following baseline principles:
- Keep monitoring read-oriented where possible and avoid an unnecessary write path into control systems.
- Zone OT devices, monitoring servers, users, and external maintenance, and permit only required flows.
- Avoid shared device accounts; apply role-based least privilege, strong authentication, and time-limited maintenance access.
- Continue local measurement and event buffering when the higher network or cloud is unavailable.
- Test order, duplication, missing data, and time shifts after reconnect, and never erase quality flags.
- Approve and record changes to settings, triggers, firmware, and wiring records, with a rollback path.
- Back up configuration and data and prove restoration into a clean environment.
- Keep remote trip or configuration change disabled by default unless a risk assessment and explicit authority justify it.
A remote connection intended to improve availability can create a new outage path. Vendor VPNs, cloud relays, mobile notifications, and API tokens need an owner, expiry, logging, revocation, and an isolation procedure. Verify that failure of the monitoring server does not impair the original protection or production function.
A 30-day PoC: correlating a power event with a machine trip
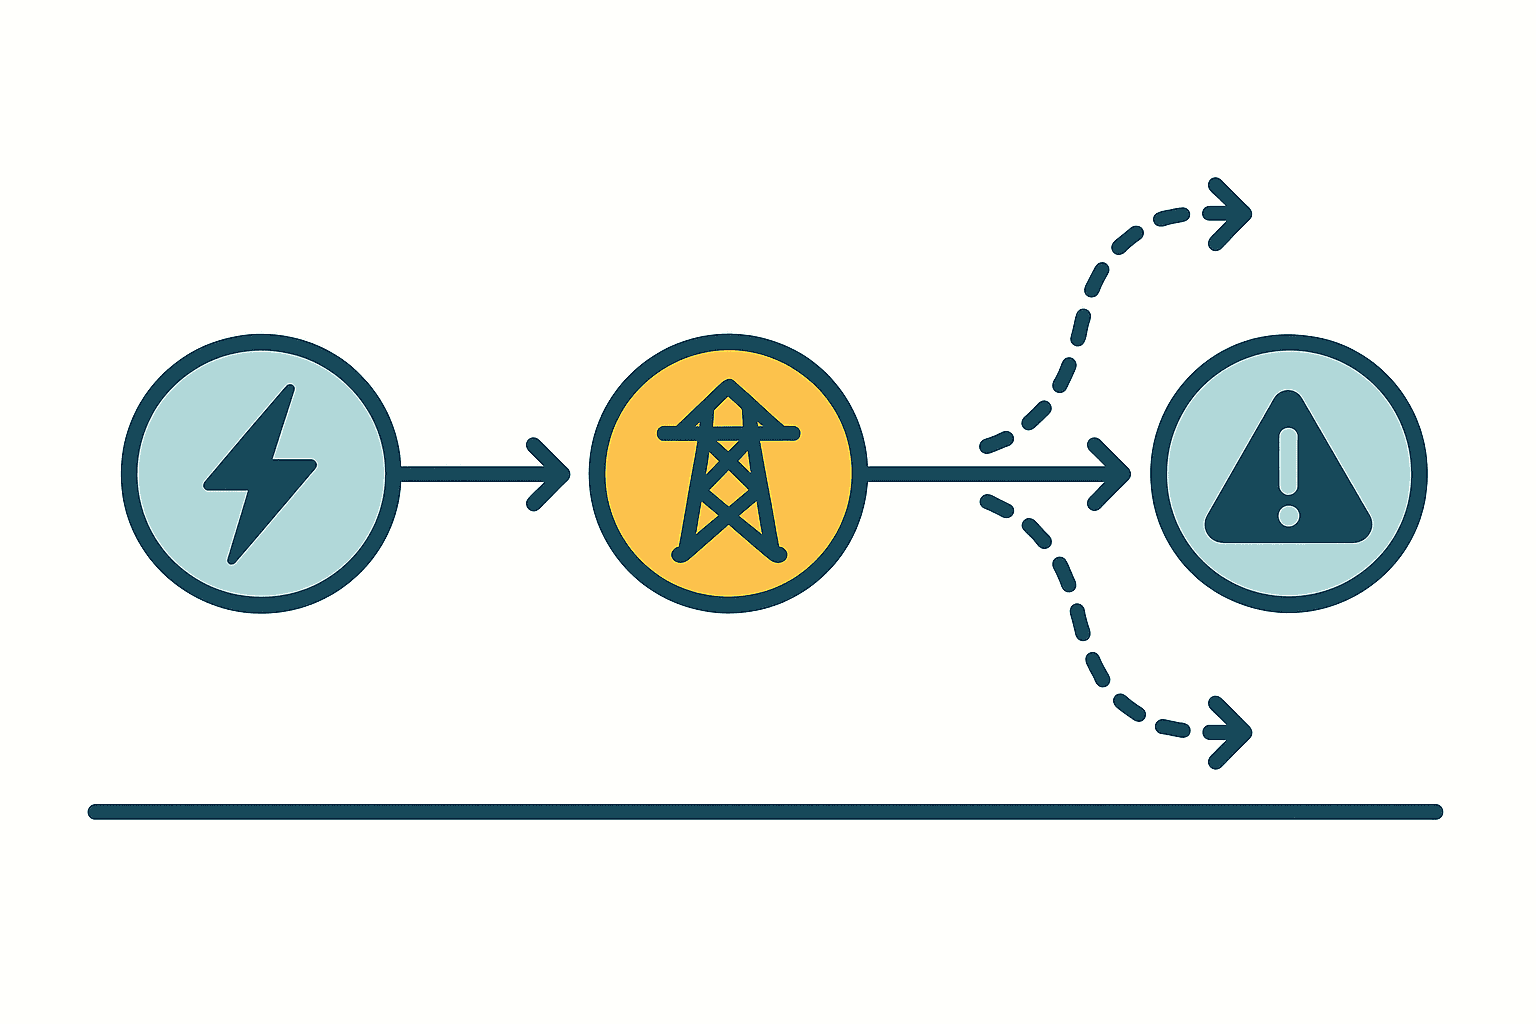
Every number in this section is an illustrative assumption. It is not a Thailand benchmark, tariff, market price, or guaranteed effect. The same figures are used in all four language versions.
Assume a plant with one incoming point, three main feeders, and six critical production assets. The baseline period is 30 days. There were 14 unexplained machine stops averaging 18 minutes.
Baseline stoppage exposure = 14 events × 18 minutes = 252 machine-minutes
After installation, assume the system recorded 24 power-quality events. Machine trips occurred within an illustrative ±2-second correlation window for 9 events. Of those 9, seven share the same feeder and have retained waveform/event evidence. Two do not contain enough data for attribution.
This does not mean that all 24 events caused stops or that the utility caused the seven correlated cases. The nine are time-related candidates, and the seven strengthen a common-feeder hypothesis. Review current, the event order upstream and downstream, protection operation, machine state, control power, and clock drift. Do not conveniently exclude the two incomplete cases; treat the missing evidence as an improvement item.
For a dimensionless loss illustration, assume 1.4 cost units per minute. This is arithmetic only.
252 machine-minutes × 1.4 cost units/minute = 352.8 cost units
After one corrective-action cycle, assume five unexplained stops averaging 14 minutes.
5 events × 14 minutes × 1.4 cost units/minute = 98 cost units
Observed difference = 352.8 − 98 = 254.8 cost units
The 254.8 result is only an observed arithmetic difference. It is not automatically a causal effect of monitoring or corrective action, a recurring benefit, or a monetary amount. Production volume, product mix, maintenance, season, network conditions, and trip definitions may differ. Record the conditions of the baseline and comparison periods and look for repeatability across periods.
What to verify in the 30-day review
- Were events and periodic data captured from every planned point?
- Can the team explain clock drift among instruments, PLC, SCADA, and machine logs?
- Can trip IDs and event IDs be linked without excessive manual work?
- Were false alerts, duplicates, communication loss, and missing data retained as quality metrics?
- Did the owners of event review, first diagnosis, escalation, and corrective action actually respond?
- Was placement, triggering, or retention changed so the two incomplete cases can be captured next time?
The review decides whether to add instruments, move points, or integrate machine logs first. A PoC can still be valuable without a final cause after 30 days if it clearly weakens some hypotheses and identifies the next evidence to collect.
Comparing power-monitoring options by purpose
| Option | Strongest purpose | What to verify | Where it is often insufficient alone |
|---|---|---|---|
| Power-quality instrument | Analysis of dips, swells, interruptions, harmonics, and related events | Method/class, waveform, sync, trigger, conformity evidence | Cost of broad deployment; machine operating context |
| Power or energy meter | Consumption, demand, long-term trends, site comparison | Update interval, accuracy, retention, CT/VT, communication | Short events and pre/post-event waveform |
| Protection relay plus gateway | Relating protection operation to electrical values; reusing assets | Event format, time, setting governance, no adverse effect on protection | Method may not equal a power-quality measurement method |
| PLC or IoT input | Machine state, trip contact, auxiliary-power context | Scan, range, isolation, sync, missing data | Engineering PQ analysis, measurement class, waveform |
There is no universal winner. One architecture may cover the incoming point and critical feeders with power-quality instruments, use energy meters for broad trends, and correlate PLC/IoT machine states. Existing relay events may help if the original protection function is not compromised and the data meaning is verified.
Energy improvement, discussed in our factory energy-saving guide, has a different objective from power-quality root-cause investigation. The same collection platform may serve both, but the KPI and granularity must remain distinct. In power-meter data collection for compressed air, the emphasis is consumption correlated with machine state. A voltage-dip study additionally needs event start, duration, waveform, and comparison across points.
Make the voltage-monitoring RFP answerable
Divide each requirement into mandatory, optional, future, or out of scope. Require the supplier to answer standard, option, custom, or unsupported, with cost, lead time, assumption, exception, and evidence. Adjectives such as “high accuracy,” “real time,” and “AI analysis” are not acceptance criteria.
| Requirement | Owner input | Supplier answer and evidence |
|---|---|---|
| Measurement purpose | Contract comparison, engineering study, screening, energy management, etc. | Applicable method and limitations |
| Measurement performance | Parameters, class, range, environment, point count | Standard/edition, declaration, data sheet, test report |
| Placement | Single-line, points, temporary/permanent, outage condition | Architecture, inputs, CT/VT, panel modification, responsibility |
| Events | Phenomena and owner-entered trigger requirements, pre/post context | Setting range, detection method, waveform, dead time |
| Time | Source, required precision, drift evidence, UTC/ICT | Sync method, loss behaviour, logs, test method |
| Data | Retention fill-in, quality flags, export | Capacity calculation, format, API, PQDIF option, samples |
| OT security | Zones, read orientation, roles, remote support, logs | Data flow, ports, accounts, update and vulnerability process |
| Operations | Monitor, first response, escalation, SLA | Notification, training, support, spares, restoration time |
| Acceptance | FAT, SAT, 30-day and 90-day evidence gates | Procedures, test equipment, results, corrective loop |
Separate measurement class from marketing claims
Do not accept “Class A equivalent,” “designed to IEC,” or “power-quality monitor” without asking which requirements of which edition are met by which configuration, firmware, and input conditions, and what manufacturer or third-party evidence supports the statement. Conversely, requiring Class A at every screening point may add cost without adding relevant evidence. Tier critical points and uses, then invest in the evidence each purpose needs.
FAT, SAT, and a 90-day operational evidence gate
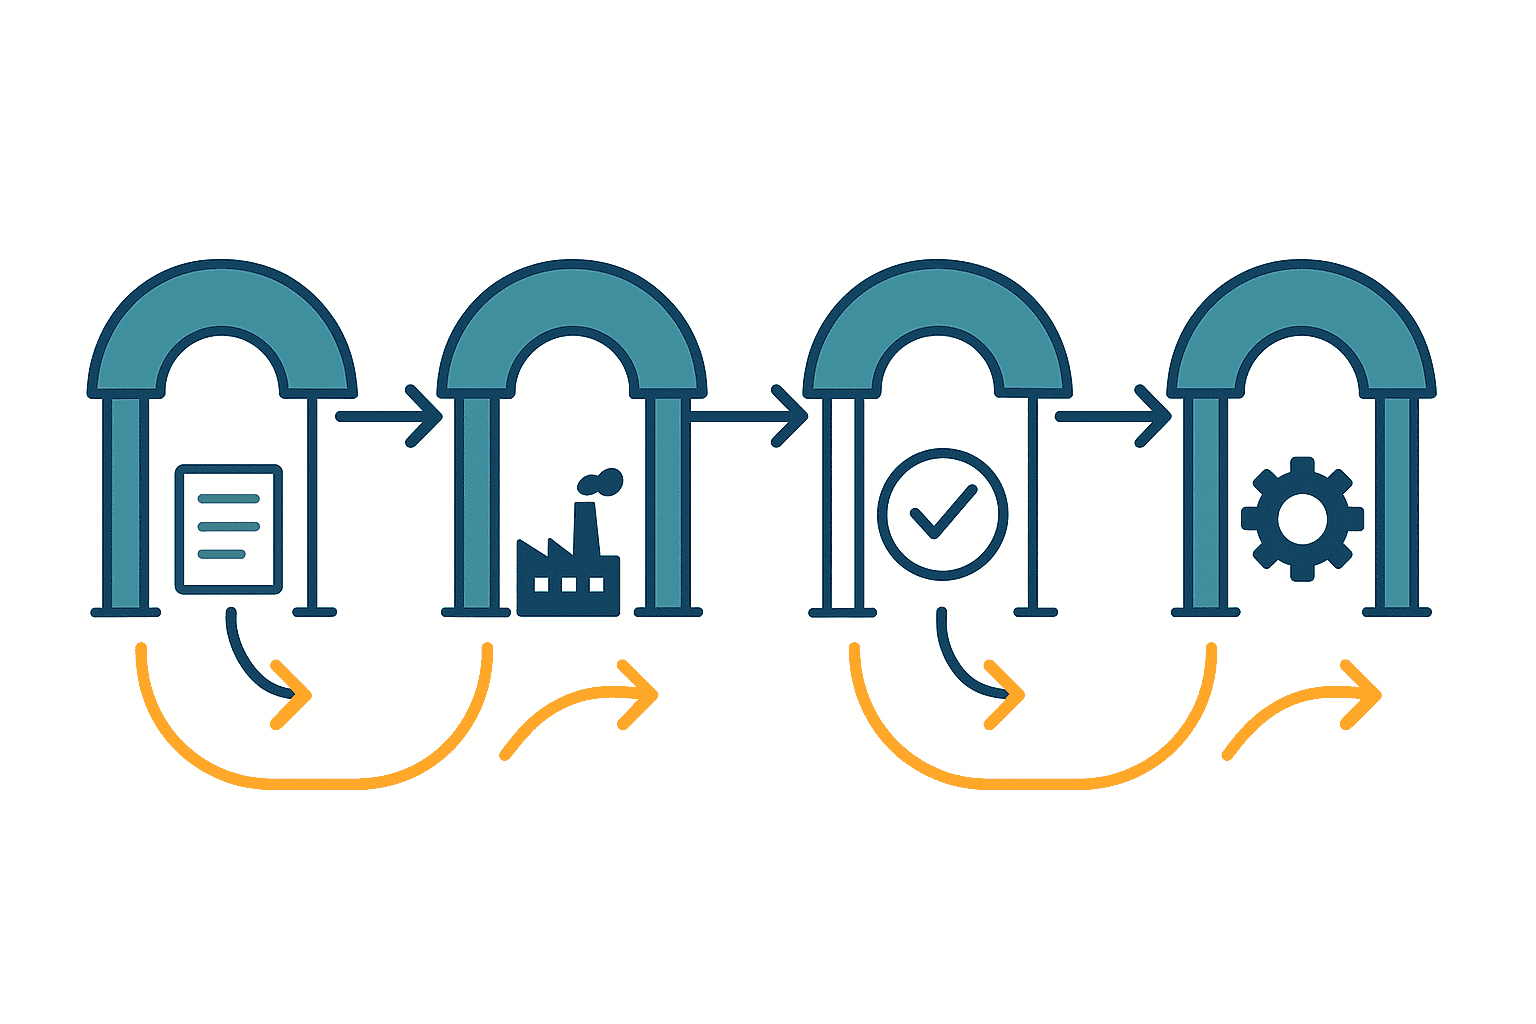
FAT verifies the configuration, settings, data, and abnormal behaviour before shipment or in a controlled environment. SAT verifies performance with the actual panels, communications, time source, machine logs, users, and site conditions. A picture of the installed device or a live dashboard is not sufficient acceptance evidence.
Representative FAT checks
- Match every input, phase, point ID, ratio, and polarity against the configuration export.
- Use known test inputs to check periodic values, event detection, and pre/post-event records.
- Test time synchronisation, time-source loss, drift indication, and quality flags.
- Test local buffering during a communication loss and order, duplicates, and gaps after recovery.
- Test roles, configuration changes, audit logs, backup, and restoration into a clean environment.
- Export and re-import agreed CSV, API, and, where required, PQDIF data.
- Exercise alert suppression, re-notification, acknowledgement, and owner assignment.
Representative SAT checks
- Reconcile the single-line diagram, panel labels, point register, and actual wiring.
- Compare time series at incoming, feeder, equipment-input, and control-power points.
- Correlate PLC, SCADA, and machine-trip logs with the correct time zone.
- Exercise real network loss, server outage, restart, and recovery after power loss.
- Demonstrate notification, shift handover, first diagnosis, and escalation.
- Capture events and context during known maintenance operations or safely created test conditions.
- Approve the record of open items, temporary controls, residual risk, owners, and dates.
Fill in the 90-day decision table
Elapsed time alone is not a pass criterion. Complete these fields for the project. This guide does not set universal acceptance percentages.
| Evidence gate | Owner-entered criterion | Actual | Return path if failed |
|---|---|---|---|
| Event-capture completeness | Points, period, mandatory events: ____ | ____ | Redesign placement, triggers, capacity |
| Clock-drift evidence | Source, check interval, tolerance: ____ | ____ | Correct sync, monitoring, recovery |
| Trip correlation | Assets, window, required context: ____ | ____ | Integrate machine logs, IDs, waveforms |
| False/duplicate alerts | Definition, allowance, exclusions: ____ | ____ | Correct rules, suppression, ownership |
| Missing-data rate | Data set, formula, allowance: ____ | ____ | Correct buffering, communication, maintenance |
| Response ownership | Roles, timing, escalation: ____ | ____ | Correct RACI, training, duty coverage |
| Corrective-action closure | Required evidence, approver, due date: ____ | ____ | Return to analysis, work, and re-test |
| Repeatability | Comparison periods, operating conditions, review: ____ | ____ | Revisit baseline and hypothesis |
Failure should send the project back to the relevant requirement, placement, setting, integration, or operating process rather than automatically rejecting all equipment. Do not pass major safety or data-integrity deviations into the next rollout or payment gate. Minor exceptions need an approved temporary control, due date, owner, and residual-risk statement.
Five common voltage-monitoring failures
1. Placement does not follow the affected asset’s electrical path
Looking only at the incomer and declaring the plant healthy, or looking only at the asset and blaming the utility, leaves no comparison. Select upstream and downstream points from the single-line diagram and the common paths of affected assets.
2. Clocks are not synchronised
If machine logs and instruments differ by several seconds, the illustrative ±2-second window is unusable. Retain the time source, drift, loss of sync, restart behaviour, and time zone as evidence, not just the displayed time.
3. The event summary has no waveform or operating context
An event count may look like a KPI, but it cannot compare hypotheses without phase information, duration, current before and after, and machine state. Retain waveforms and event context according to purpose, and flag missing evidence.
4. Machine-trip logs are not integrated
If electrical events and stoppages live in separate spreadsheets or screens, they cannot reliably join on asset ID, time, and trip reason. Standardise IDs, timestamps, event numbers, operating states, and operator records.
5. No one owns the alert
More notifications do not help without a person who reviews them, follows a defined first-check sequence, escalates, and closes the case with evidence. Set a RACI across shifts, maintenance, electrical, OT, production, and external support.
Frequently asked questions about voltage monitoring systems
What is the difference between a voltage monitoring system and a power monitoring system?
Voltage monitoring focuses on voltage condition and events. Power monitoring often includes current, power, energy, demand, and power factor, but product names are inconsistent. Compare parameters, update interval, events, waveform, synchronisation, and measurement method in the specification.
Is Class A mandatory for voltage-dip monitoring?
Not automatically at every point. Define whether the purpose is contractual comparison, rigorous engineering analysis, site screening, or internal troubleshooting. Then specify the method and evidence. Class S is not always sufficient, and Class A is not always excessive.
Can a smart meter or PLC record a voltage dip?
Some configurations can detect some changes, but their data are not automatically equivalent to a power-quality instrument. Check scan/update interval, range, triggering, time sync, pre/post-event context, waveform, missing data, and measurement method.
Does finding a power-quality event prove the cause?
No. Correlation with a machine stop narrows the candidates. Evidence may still need to distinguish the utility, plant distribution, loads, protection settings, wiring, control power, and equipment immunity. Do not assign responsibility from one point and one event.
How many years should data be retained?
There is no universal period. Base it on investigation purpose, contract, event frequency, seasonality, storage cost, confidentiality, re-analysis, and backup. High-resolution waveform, event summary, and periodic trend can have different tiers.
Is a 30-day PoC enough for an investment decision?
Thirty days can reveal weaknesses in placement, time sync, capture completeness, log integration, and response, but may not establish causality or seasonality. Define the conditions for moving to a 90-day gate or multi-period comparison in advance.
Is a voltage monitoring system mandatory for ISO 50001 certification?
ISO 50001:2018 provides a PDCA framework for improving energy performance and was confirmed as current in 2024. Its 2024 amendment adds climate-action changes. It does not mean that one instrument automatically certifies the organisation or that voltage monitoring is universally mandatory. The measurement plan should follow the organisation’s energy review, objectives, and significant energy uses.
Can PEA Power Map determine factory power quality?
No. It is a preliminary planning reference for broad network capacity, not a diagnosis of dips, waveforms, internal distribution, or responsibility at a specific factory. On-site measurements and equipment/distribution logs are required.
Summary: design voltage monitoring as one system of placement, time, evidence, and ownership
The value of a voltage monitoring system is not set by dashboard appearance or sensor count. Separate periodic visibility, event monitoring, and engineering analysis. Select Class A or Class S from the measurement purpose. Place comparable observation points at the incoming supply, feeder, equipment input, and control-power side. Give each record a time source, point ID, wiring and ratio metadata, event definition, waveform, quality flag, calibration and version record, access control, and audit trail.
The illustrative 30-day PoC presents both correlation and limits: 14 stops, 24 events, nine within ±2 seconds, seven with common-feeder evidence, and two that cannot be attributed. Do not convert 252 machine-minutes, 352.8 cost units, the post-action 98 cost units, or the observed difference of 254.8 into a guaranteed benefit. FAT, SAT, and the 90-day proving period should gate event-capture completeness, clock drift, trip correlation, false alerts, missing data, response ownership, corrective-action closure, and repeatability.
TOMAS TECH can support a Thailand factory from the early stage of documenting unexplained trips and planning monitor locations, a 30-day PoC, an RFP, and FAT/SAT conditions. If you want to reuse existing energy meters, PLCs, and SCADA while identifying the missing power-quality evidence, contact TOMAS TECH.
Primary references
- IEC 61000-4-30:2025 Power quality measurement methods
- IEC 62586-1:2017 Power quality instruments
- IEEE 1159-2019 Monitoring electric power quality
- IEEE 1159.3-2025 PQDIF
- NIST SP 800-82 Rev.3 Guide to OT Security
- NIST SP 800-82 Rev.4 pre-draft status
- ISO 50001:2018 Energy management systems
- ISO 50001:2018/Amd 1:2024
- PEA Power Map
- IEC 61000-4-34 consolidated edition


