


Plant managers searching for factory logistics improvement case studies often face the same question: should they start with an AGV, change the layout, or redesign material supply first? This guide does not present a single vendor product or claim unpublished customer results. Instead, it converts public production, safety and interoperability principles into six model patterns that a factory in Thailand can test with its own data. The sequence runs from observation to layout, point-of-use storage, supermarkets, milk runs, conveyors and AGV/AMR, followed by a 90-day proof, RFP, FAT and SAT. Every ROI figure is an illustrative assumption that can be recalculated; none is presented as a TOMAS TECH customer result.
Why factory logistics improvement starts with flow, not a vehicle
Thailand’s National Economic and Social Development Council estimates national logistics costs for 2024 (2024e) at THB 2,509.4 billion, equal to 13.5% of GDP, compared with 14.2% in 2023. These figures show the strategic weight of logistics in the economy, but they include national transportation, inventory holding and logistics administration. They are not a ratio for intralogistics inside an individual factory. A plant must measure its own travel, waiting, work in process, shortages, transfers and stoppages before using a national indicator in an investment case.
The investment context is also active. A Thailand Board of Investment announcement for the first half of 2026 listed THB 40.2 billion across 170 investment applications in logistics and high-value services, THB 13.1 billion across 82 applications in machinery, automation and robotics, and THB 17.2 billion across 132 applications under Smart and Sustainable Industry. These are investment applications. They should not be described as equipment that is already approved, commissioned or delivering benefits. The figures nevertheless reinforce why factories need clear baselines and acceptance criteria before joining an investment wave.
A common shortcut is to see an operator pushing a cart and conclude that an AGV should replace that person. If the current route includes avoidable detours, waiting for an empty location, searching for a container, duplicate scans or unplanned priority changes, automating only the vehicle reproduces the waste more consistently. Toyota defines Just-in-Time around making only what is needed, only when it is needed, and only in the amount needed. The practical lesson is to stabilize the flow and its signals before choosing the transport technology.
Three questions to ask when reading a logistics automation case study
Before transferring a published case to a factory in Thailand, check three dimensions.
- Are the load and frequency comparable? A pallet moved every ten minutes and a tote delivered on demand require different handling and control.
- Is the exception rate comparable? A route with blocked aisles, missing empties, urgent calls and frequent model changes cannot be judged by normal travel speed alone.
- Is the outcome denominator comparable? Headcount, labor hours, line-stoppage minutes and WIP reduction are different results. The scope, shifts, time period and included costs must be visible.
The six patterns below are therefore not claims that one customer’s percentage can be repeated elsewhere. They are model cases derived from public principles and designed for validation with the reader’s own operating data.
Build a baseline with seven days of observation
Alternatives can only be compared if “current state” has a shared definition. Before requesting equipment quotations, select one representative process or logistics loop and observe it for about seven days. Include busy periods, changeovers, shortages and congested aisles rather than recording only a quiet, normal shift.
Minimum data set
| Data | Example definition | Decision supported |
|---|---|---|
| Distance per trip | Actual metres from departure to completed handover | Compare layout and vehicle options |
| Transport time | Separate travel, waiting, loading and unloading | Decide whether waiting matters more than speed |
| Frequency | Trips by part, load type and time window | Compare milk run, call-off and conveyor |
| Touch count | Each handling, transfer or inspection counts once | Locate quality risk and labor opportunity |
| Shortage or stop | Reason code and line-stoppage minutes | Establish supply-reliability baseline |
| WIP | Standard containers or units between processes | Size a supermarket and buffer |
| Exceptions | Blocked aisle, unreadable ID, missing empty, and others | Create abnormal test cases for the proof |
A spaghetti diagram captures distance; direct observation captures time; warehouse, kanban and call logs help with frequency. A plant without digital records does not need to install many sensors on day one. A simple sheet with timestamp, origin, destination, load, quantity and waiting reason is enough to create a first bottleneck hypothesis.
Do not classify all walking as waste. Some routes contain genuine judgement: detecting a defect, confirming a variant, or coordinating a change across processes. The best early automation candidate has high repetition, stable rules and relatively few judgement-heavy exceptions. If a person remains responsible for exceptions, define which event is escalated to whom and within how many minutes.
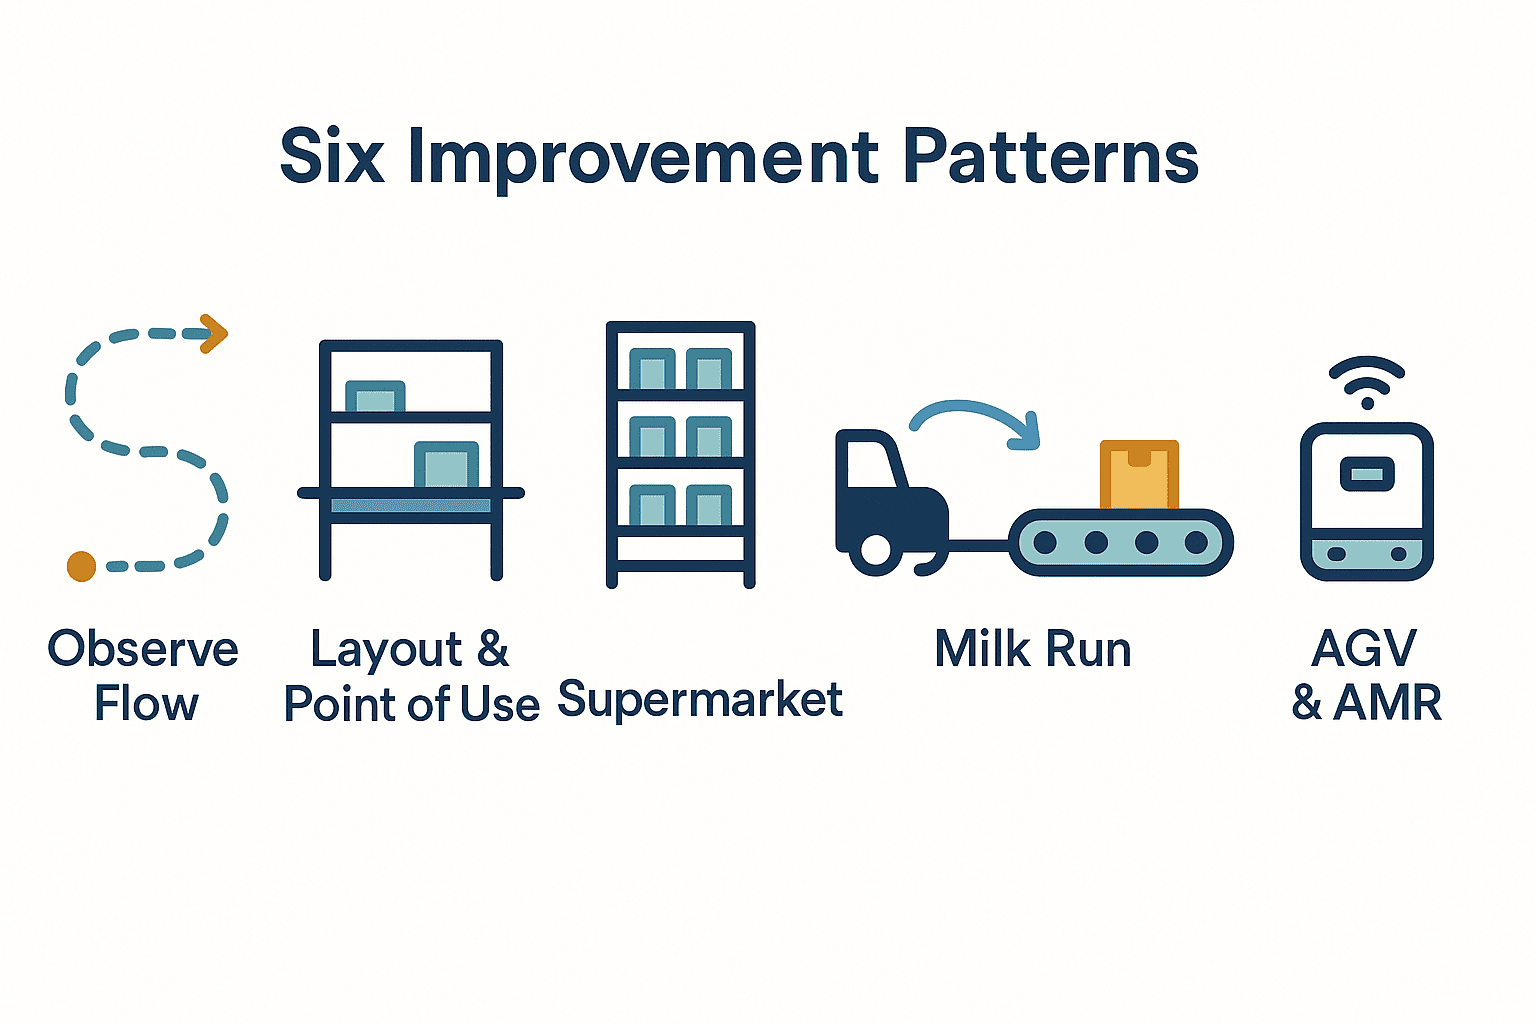
Six factory logistics improvement case patterns
These patterns are not mutually exclusive. A plant will often use pattern 1 to expose the problem, patterns 2 and 3 to simplify the flow, and then combine patterns 4 to 6 where mechanized transport is justified. The selection starts with the nature of the constraint rather than a product catalogue.
Pattern 1: Observe the flow and eliminate trips that should not exist
The first model case reduces transport without purchasing a vehicle. Imagine parts move from molding to assembly 60 times per day and each delivery waits an average of four minutes. Observation may split that waiting into “no assigned drop position,” “receiver unavailable” and “empty container not returned.” A faster vehicle cannot remove those handover conditions.
Countermeasures include a fixed location, a maximum queue, an empty-return point and a clear transfer-complete signal. Barcode, RFID or digital kanban can be added when they solve a defined information gap. GS1 EPCIS 2.0 provides a framework for visibility events around what, when, where and why, and supports sensor data as well as modern exchange through REST and JSON/JSON-LD. EPCIS is not itself a route optimizer or a vehicle-control system. Identification and event sharing should remain distinct from WMS, MES and control responsibilities.
Useful KPIs are total travel distance, waiting share, unknown handover count and touches per load. This pattern normally comes first because it needs little capital and produces the data required for later automation.
Pattern 2: Redesign layout and point-of-use storage
The second model case moves high-frequency materials closer to their point of use and reduces crossings and return travel. Rank parts by actual delivery frequency: A items receive the shortest safe route, B items can use shared replenishment shelves, and C items may remain in a lower-frequency zone. Weight, hazardous-material rules, FIFO, temperature and quarantine conditions mean that “put everything next to the line” is not a valid design rule.
At the point of use, specify container orientation, presentation height, minimum and maximum quantity, part identification and the empty-container path. A shelf placed closer to an operator can still reduce safety and productivity if replenishment and production share a narrow aisle. Reduce crossings between pedestrians, forklifts, carts and automated vehicles, and use one-way or time-separated traffic where appropriate.
KPIs include transport metres per container, crossing count, line-side inventory hours and operator interruptions caused by replenishment. Removing distance and variation before automating can reduce fleet size and integration complexity. For a wider equipment comparison, see Material handling equipment selection for factories in Thailand.
Pattern 3: Use a supermarket and pull replenishment to reduce shortage and excess
The third model case decouples warehouse picking variation from line consumption through a supermarket. Standard containers are positioned by part number, and consumption triggers replenishment. The value does not come from installing a shelf; it comes from defining the container count, signal and replenishment responsibility.
An initial reorder hypothesis can combine demand during replenishment lead time, variation and a safety allowance. If a line consumes an assumed four boxes per hour, replenishment lead time is 30 minutes, and one extra box covers variation and delay, the initial trigger is three boxes. This is only an explanatory assumption. Actual settings require consumption history by part, quality holds, changeovers and production-plan changes.
The signal may be a paper kanban, a scan or a weight sensor. Before choosing the technology, decide who creates the signal, who replenishes within what time, and how a missing replenishment is detected. Measure shortage count, emergency deliveries, line-side inventory, replenishment compliance and container turns.
Pattern 4: Turn line supply into a disciplined milk run
The fourth model case consolidates frequent small deliveries into a fixed route and takt. When the warehouse reacts to every call individually, trips overlap and priorities compete. A 15- or 30-minute milk run makes capacity, required containers, cut-off time and route ownership more visible.
A fixed schedule does not mean ignoring variability. Urgent material, quality quarantine, process stops and blocked routes should be managed as explicit exceptions rather than mixed invisibly into the normal run. A cycle that is too short travels with poor utilization; one that is too long increases line-side inventory and shortage risk. For each route, compare boxes required per hour, loop time, loading capacity and loading/unloading time, including the peak period.
Line supply automation becomes easier when the service design is stable before a tugger, AGV or AMR is introduced. Measure on-time arrival, load utilization, emergency-run ratio, variation in loop time and line-stoppage minutes.
Pattern 5: Reserve conveyors for stable corridors
The fifth model case connects a stable route with a conveyor. It is a strong candidate when totes, trays or pallets repeatedly move between the same origin and destination and fixed floor equipment will not block foreseeable changes. A conveyor can separate transport from pedestrian traffic and use sensors to control accumulation between processes.
It becomes a constraint when product mix and layout change frequently, load presentation is unstable, or no bypass exists during a stop. Design for peak flow, accumulation length, merge priority, jam detection, emergency stop, manual recovery and bypass—not average capacity alone. A line rated at ten boxes per minute can still propagate a stop upstream if it cannot safely accumulate twenty boxes when the downstream process stops.
KPIs include actual throughput per hour, jam rate, mean recovery time and remaining accumulation capacity during a downstream stop. Conveyor system design for factories in Thailand provides a deeper checklist for capacity, merging, buffering and safety.
Pattern 6: Automate inter-process transport with AGV or AMR
The sixth model case applies an AGV or AMR to repeatable inter-process transport. In broad terms, an AGV designed around guided or fixed routes suits stable repetition, while an AMR capable of perceiving the environment and selecting routes can suit more dynamic conditions. Product capabilities vary widely, so the label is not a specification. Validate load, transfer height, floor, slope, doors, elevators, Wi-Fi, crossings, pedestrian and forklift traffic, charging, cleaning and ambient conditions.
For fleets from different manufacturers, VDA 5050 version 3.0 was announced in April 2026 with features relevant to heterogeneous fleets, shared zones and paths, error messages displayed in languages stored locally on each vehicle, and power-saving behavior. A common interface can help align communication between master control and vehicles, but it does not automatically unify maps, traffic policy, load-handling equipment, emergency behavior, safety acceptance or vendor responsibility. State the version and implementation scope in the RFP, then test real messages and abnormal recovery in FAT and SAT.
For safety, the edition currently published on the ISO page is ISO 3691-4:2023. A revision draft is under development, but a draft must not be presented as a newly effective standard. Combine the published standard with applicable Thai requirements, site risk assessment and manufacturer instructions. Evaluate stopping distance, speed zones, visibility, warnings, protective devices, manual intervention and emergency scenarios.
Select a pattern by problem, variability and required flexibility
| Primary problem | First candidate | Conditions that fit | Common blind spot |
|---|---|---|---|
| Waiting, double handling, unknown location | Observation and visibility | Cause is not yet isolated | Stopping after data collection |
| Long travel for high-frequency parts | Layout and point of use | Locations can be changed | Safety, quality and FIFO |
| Shortages and excess stock coexist | Supermarket | Standard containers and signals are possible | Exceptions and ownership |
| Many small, frequent deliveries | Milk run | Route and takt can stabilize | Separating urgent runs |
| High volume on a fixed corridor | Conveyor | Origin, destination and load are stable | Jams, bypass and future change |
| Repeat transport on changeable routes | AGV/AMR | Traffic can be designed and volume justifies it | Congestion, charge, recovery and safety |
Combinations are common: supermarket plus milk run, or a fixed conveyor trunk with AMR at variable endpoints. Integrate handover position, container ID, takt, priority and stop responsibility across the system instead of optimizing each machine separately. A staged investment approach is discussed in Phased factory automation roadmap for Thailand.
KPIs and a transparent model for transport cost reduction
A logistics improvement should not be judged only by the number of people removed. A plant may keep headcount and use released capacity for higher production. Balance productivity with supply reliability, inventory, quality, safety and flexibility.
Recommended KPIs
| Perspective | Example KPI | Definition note |
|---|---|---|
| Productivity | Labor minutes per box; moves per hour | Include waiting and transfer |
| Reliability | On-time supply; shortages; line-stop minutes | Separate planned stops |
| Inventory | Line-side inventory hours; WIP containers | Do not mix quantity and value |
| Quality | Wrong supply; damage; untraceable events | Include rework |
| Safety | Crossings; hard stops; near misses | More reports can reflect better reporting culture |
| Flexibility | Model-change time; route-change time | Separate software and physical changes |
| Equipment | Availability; MTTR; charging wait | Freeze the denominator for availability |
A recalculable ROI example
The following numbers are declared assumptions, not reported results. Assume the current movement uses three operators per shift, a monthly salary of THB 22,000, a loaded-cost factor of 1.35 and two shifts. Equivalent labor cost is 3 × 22,000 × 1.35 × 2 = THB 178,200 per month. Add an assumed THB 45,000 per month of route-attributable overtime and forklift operation, giving THB 223,200 per month of addressable baseline cost.
Assume the improved flow releases 1.2 full-time equivalents per shift for reassignment while keeping exception coverage. Capacity value is 1.2 × 22,000 × 1.35 × 2 = THB 71,280 per month. If overtime and forklift cost fall by THB 30,000 per month, gross monthly benefit is THB 101,280. Subtract THB 18,000 per month of new maintenance, software and energy cost: net benefit is THB 83,280 per month, or THB 999,360 annualized.
With an assumed initial project cost of THB 2,400,000, simple payback is 2,400,000 ÷ 83,280 = 28.82 months. A three-year simple net value excluding discounting, tax, residual value and avoided production loss is 999,360 × 3 − 2,400,000 = THB 598,080.
At 70% benefit realization, monthly net becomes 101,280 × 0.70 − 18,000 = THB 52,896, and payback extends to 2,400,000 ÷ 52,896 = 45.37 months. The gap between 28.82 and 45.37 months is why the proof must test real peak demand, availability and exception handling rather than rely only on rated capacity.
If safety or avoided stoppage is monetized, use actual history and finance-approved valuation rules rather than an arbitrary probability. For labor, distinguish among avoided hiring, overtime reduction and reassignment to higher output; do not assume layoffs.
A 90-day proof for intralogistics improvement
A proof is not a demonstration lap. It is a period for testing whether defined operating conditions, KPIs and abnormal scenarios are met with evidence. Constrain the first proof to one route, load type and operating window, while assessing expansion separately.
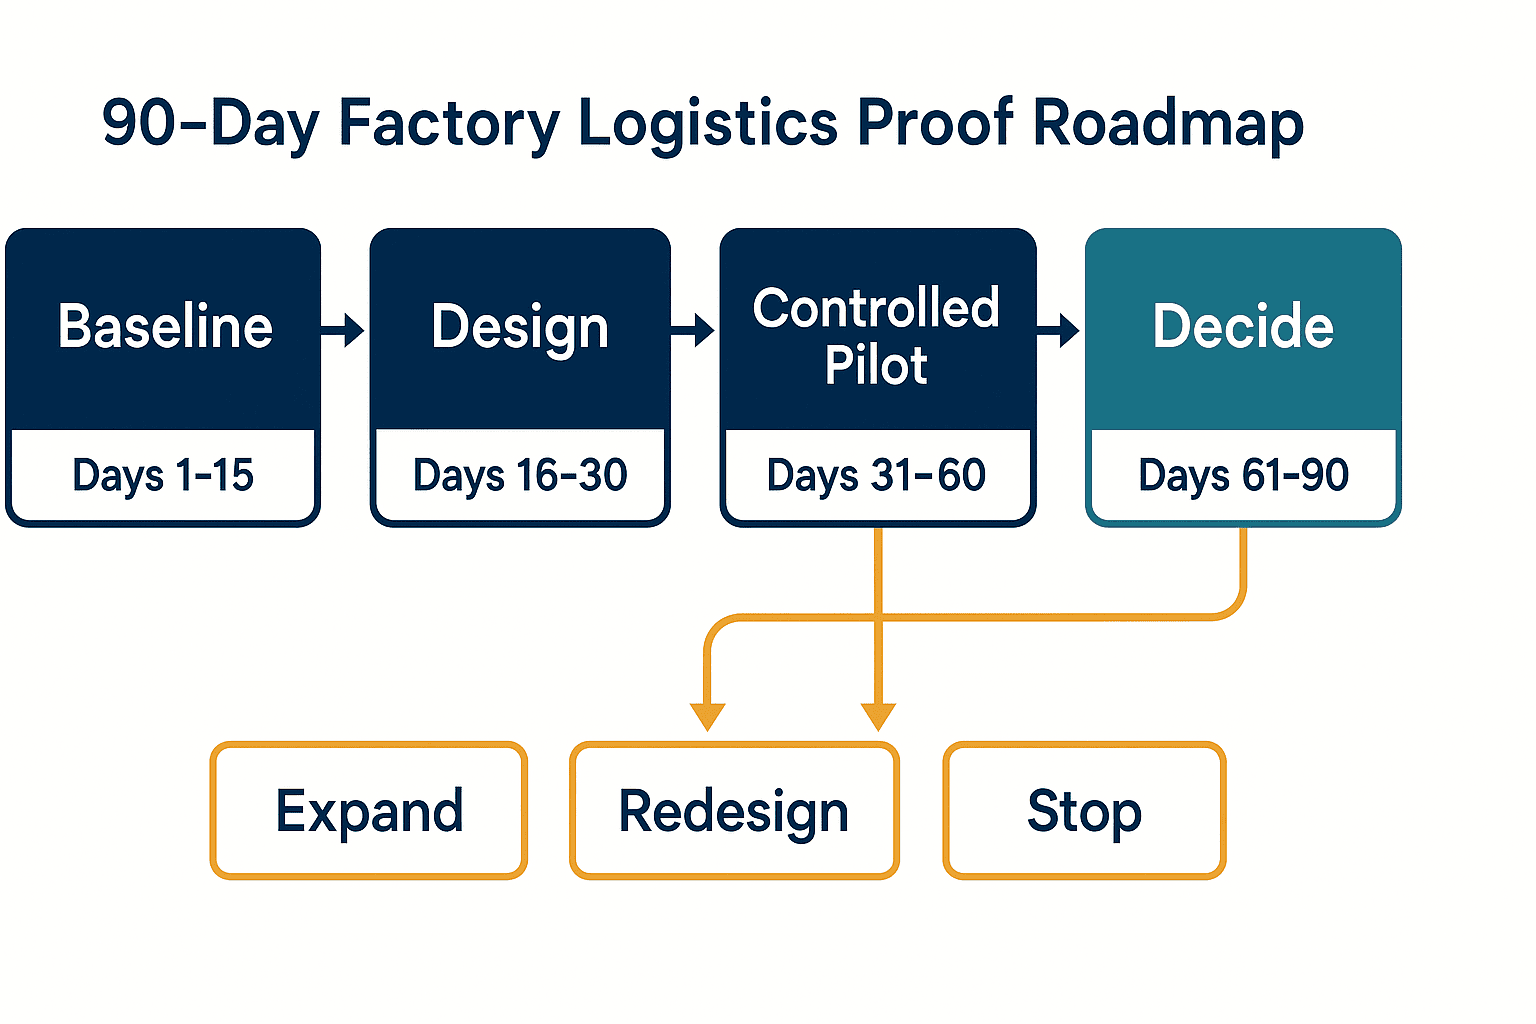
Days 1–15: Fix the baseline, definitions and owners
Measure distance, frequency, waiting, stoppage, WIP and exceptions. Define every numerator and denominator, data source and approver. Involve operators, logistics, production, maintenance, safety, IT/OT, procurement and finance. Keep evidence from non-standard days as well as normal operations.
Days 16–30: Design the target flow and alternatives
Compare the six patterns and create at least three options, including one that does not require major equipment. Option A might combine layout and supermarket, option B a milk run, and option C an AMR. Compare safety concept, handover, signals, exceptions, IT/OT integration and estimated cost on one sheet. Freeze scope and success criteria at the end of the phase.
Days 31–60: Test normal and abnormal operation under control
Use the real load and near-peak frequency in representative crossing traffic. Test normal delivery and blocked routes, unreadable IDs, misaligned loads, low charge, network interruption, full downstream buffer, emergency stop and manual recovery. When a person must intervene, measure alert destination, response time and recovery procedure.
Days 61–90: Collect evidence and choose expand, redesign or stop
Calculate KPIs with the baseline definitions and update actual costs. Review variation by shift, part family and peak, not the average alone. Run sensitivity at 70%, 85% and 100% benefit realization and estimate fleet size, chargers, buffers and service support for expansion. “Redesign layout,” “stabilize milk run first” and “stop” are legitimate decisions alongside “expand.”
Reduce procurement ambiguity through RFP, FAT and SAT
Projects often underperform because requirements are reduced to equipment quantities such as “three AGVs” or a nominal “30 pallets per hour.” The RFP must state what must move, between which points, by what deadline and under which abnormal conditions.
RFP content checklist
- Load type, dimensions, weight, centre of gravity, orientation and environmental or quality constraints
- Routes, intersections, doors, gradients, floor, aisle width and pedestrian/vehicle traffic
- Average and peak volume, deadline, priority, maximum wait and buffer
- Messages to WMS, MES, PLC or EPCIS, including timestamp, ID, retry and audit log
- Normal handover plus behavior when full, empty, unreadable, disconnected or blocked
- Safety ownership, risk assessment, stopping zones, manual mode and training
- Operating hours, availability definition, planned stops, MTTR, spares and service response
- Software, licenses, cyber controls, backup and change authority
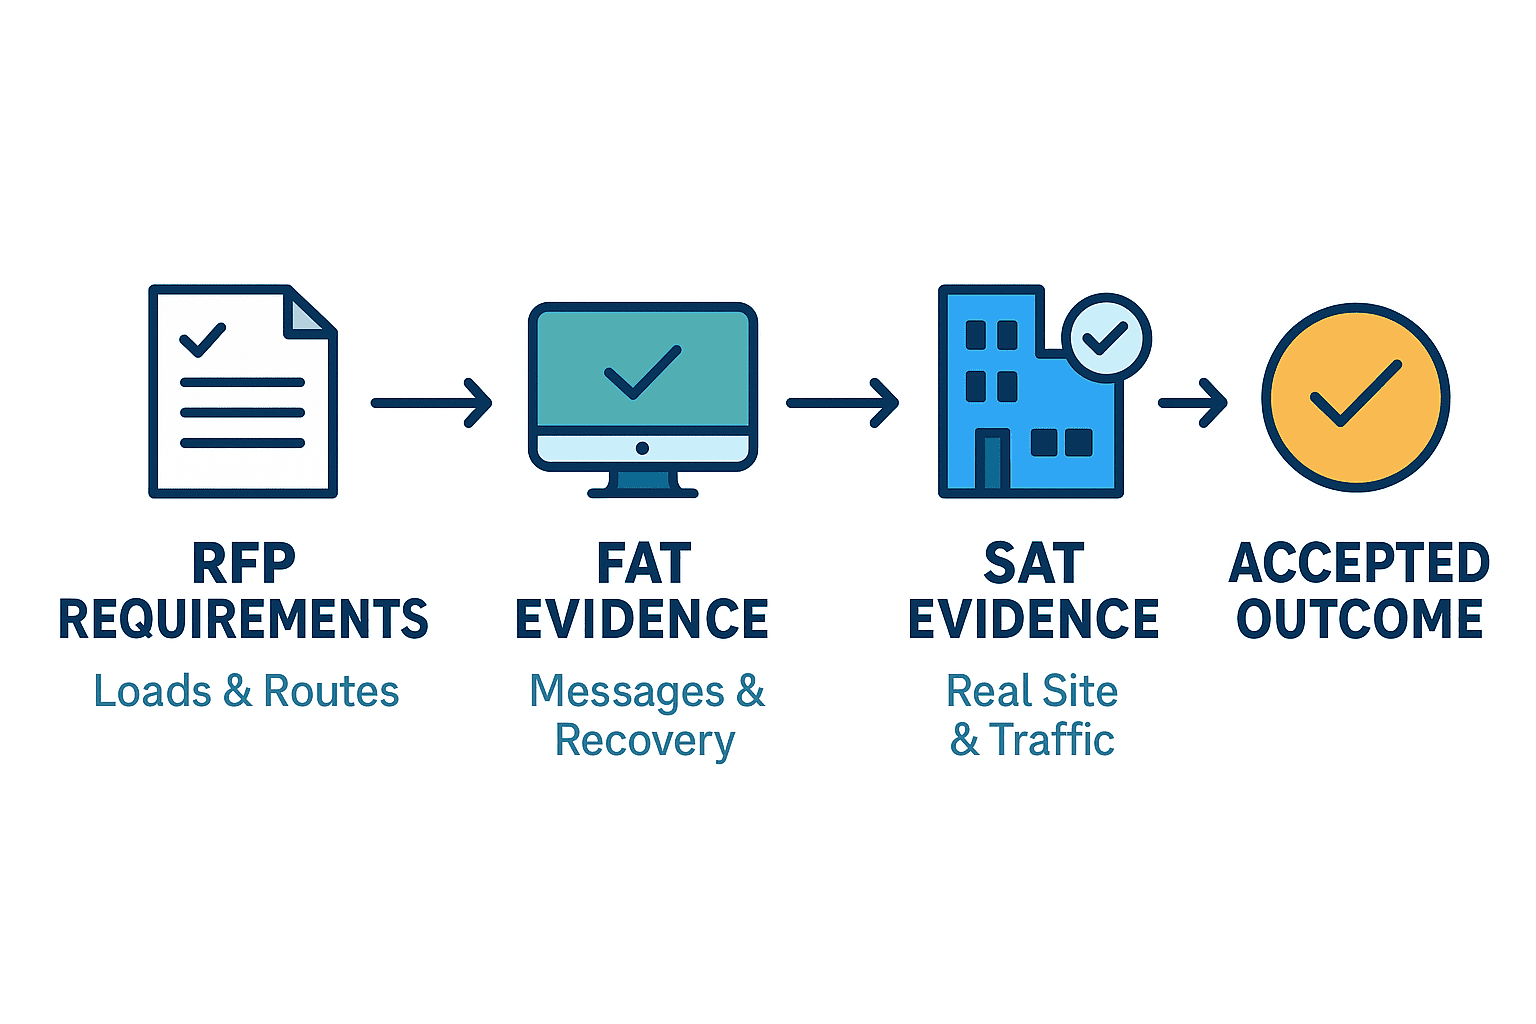
- FAT/SAT cases, sample size, pass criteria, evidence and action after failure
Factory Acceptance Test checks equipment, controls, messages, recovery and documents in the supplier environment. Because the customer factory is different, FAT is not final production acceptance. If a simulator or test PLC is used, record its limits.
Site Acceptance Test repeats agreed evidence on the real floor with actual network, traffic, operators, shifts and upstream/downstream equipment. Include peak and endurance tests, abnormal recovery, safety functions, logs and training. Reusing test IDs between FAT and SAT makes environmental differences traceable.
Keep VDA 5050, EPCIS and equipment control in their proper roles
VDA 5050 structures communication between fleet control and vehicles. EPCIS structures visibility events for logistics objects. PLC and safety controls operate equipment and protective functions; MES and WMS carry production, inventory and task context. Do not ask one standard to replace all layers. An interface matrix should identify system boundaries, system of record, time synchronization, IDs and error ownership.
FAQ on factory logistics automation in Thailand
Where should a factory intralogistics improvement start?
Select one representative route and record distance, time, waiting, frequency, load, WIP, shortages and exceptions for roughly seven days. Find trips that should not exist and causes of waiting before requesting equipment. Then compare layout, supermarket, milk run, fixed transport and AGV/AMR against the same KPIs.
Can a published logistics automation case study be copied to another plant?
Not by copying its improvement percentage. Match load, frequency, route, crossing traffic, exception rate, shifts and the cost denominator. The six patterns in this article are model cases based on published principles, not claimed TOMAS TECH customer achievements. A 90-day proof with local data is the appropriate test of transferability.
Should line supply automation use a milk run or an AMR?
When demand and routes are regular, first stabilizing service frequency, containers and exceptions as a milk run often creates a better specification. A manually driven tugger can validate operations before automated towing or AMR. When call variation and route change are high, AMR may be a candidate, but traffic, safety, charge and abnormal recovery still decide viability.
How do we choose between conveyor and AGV/AMR for inter-process transport?
A conveyor suits a long-term stable origin, destination, load and high continuous volume. AGV or AMR may suit changing paths where fixed floor equipment is undesirable. A conveyor trunk with AMR at variable endpoints is also possible. Compare bypass and recovery during a stop as carefully as average capacity.
What belongs in ROI for transport cost reduction?
Include labor, overtime, forklift, energy, maintenance, software, consumables and training. Use operating history and finance approval for avoided production or quality loss. Show 100% and downside realization, and publish initial cost, monthly net benefit and the simple-payback formula so reviewers can recalculate it.
Does VDA 5050 compliance make a mixed AMR fleet immediately interoperable?
No. A common interface helps, but version, implementation scope, maps, traffic policy, chargers, load-handling equipment, safety and abnormal recovery still require real testing. Specify scope in the RFP and verify messages and behavior during FAT and SAT.
Is the draft revision of ISO 3691-4 already effective?
The edition shown as published on the ISO page is ISO 3691-4:2023. A revision draft under development should not be described as an effective new edition. Confirm the published standard, applicable law, site risk assessment, manufacturer instructions and customer rules with the safety team.
Conclusion: Make the improvement repeatable before selecting equipment
Successful intralogistics improvement in a Thailand factory begins by defining distance, waiting, frequency, WIP, shortage and exception. Layout, point of use, supermarket, milk run, conveyor and AGV/AMR can then be combined according to the actual constraint and variability. Transparent assumptions make ROI auditable, while a 90-day proof tests normal, peak and abnormal operation. Carrying the same KPIs and test IDs through RFP, FAT and SAT shifts acceptance from “equipment delivered” to “operating outcome demonstrated.”
TOMAS TECH can support an early-stage review of current material flow, option comparison, a 90-day proof plan or RFP acceptance criteria. If you want to narrow the first route using an existing layout and movement records, contact TOMAS TECH.
Sources
- NESDC, *Thailand Logistics Report 2024*: https://www.nesdc.go.th/wordpress/wp-content/uploads/2025/09/logistics-2567-Full-Report-ENG-F.pdf
- Thailand BOI / OSOS, first-half 2026 investment announcement: https://osos.boi.go.th/EN/news/2430/Thailand-Secures-43-6bn-1H-2026-Investment-Surge-as-Big-Tec/
- Toyota Production System: https://global.toyota/en/company/vision-and-philosophy/production-system/
- VDA, VDA 5050 version 3.0 press release: https://www.vda.de/en/press/press-releases/2026/260421_PM_VDA_5050_EN
- ISO 3691-4 official page: https://www.iso.org/standard/83545.html
- GS1 EPCIS: https://www.gs1.org/standards/epcis
- GS1 standards reference: https://ref.gs1.org/standards/


