


When people search for how to start factory DX, they often find lists of IoT platforms, MES, ERP, AI, and automation products. The difficult part in a Thai factory, however, is rarely choosing a technology. It is deciding which constraint to address, who owns the operating change, which data can be trusted, and in what order management should approve investment. If a system is selected before these questions are answered, a factory may collect data that no meeting uses, rely on one specialist, or remain stuck in a proof of concept.
This guide turns the four areas highlighted by NSTDA’s August 2026 DX Strategy initiative—Organization, Smart Operation, IT System & Data Transaction, and Workforce Learning—into a practical first-90-days plan. The 90-day roadmap below is a TOMAS TECH planning model based on those published principles. It is not an official NSTDA, ETDA, or BOI program, certification, or guaranteed implementation schedule. Its purpose is not to complete transformation in three months, but to create enough evidence to decide whether to scale, redesign, pause, or stop.
Factory DX begins with the order of decisions, not the technology list
Factory DX is more than adding sensors or replacing a paper form with a tablet. It reconnects business outcomes and daily shop-floor decisions through reliable data. Before naming software, management should agree on five points:
- Which business problem is in scope?
- Which workflow and bottleneck must change?
- What baseline and metrics will show a result?
- Who owns the process and the data?
- What evidence will trigger scale, redesign, or stop?
This sequence works for maintenance, quality, inventory, schedule attainment, and traceability. Starting with “we have a budget for AI” or “another company installed MES” usually expands scope while postponing data definitions. A pilot may cover one process, but its value hypothesis should still connect to delivery, quality, cost, or resilience at factory level.
For examples of the patterns companies have used, see our manufacturing DX case studies. This article instead concentrates on the decisions around a pilot. Guidance on narrowing the test area is available in small-start system implementation.
Diagnose readiness through NSTDA’s four DX areas
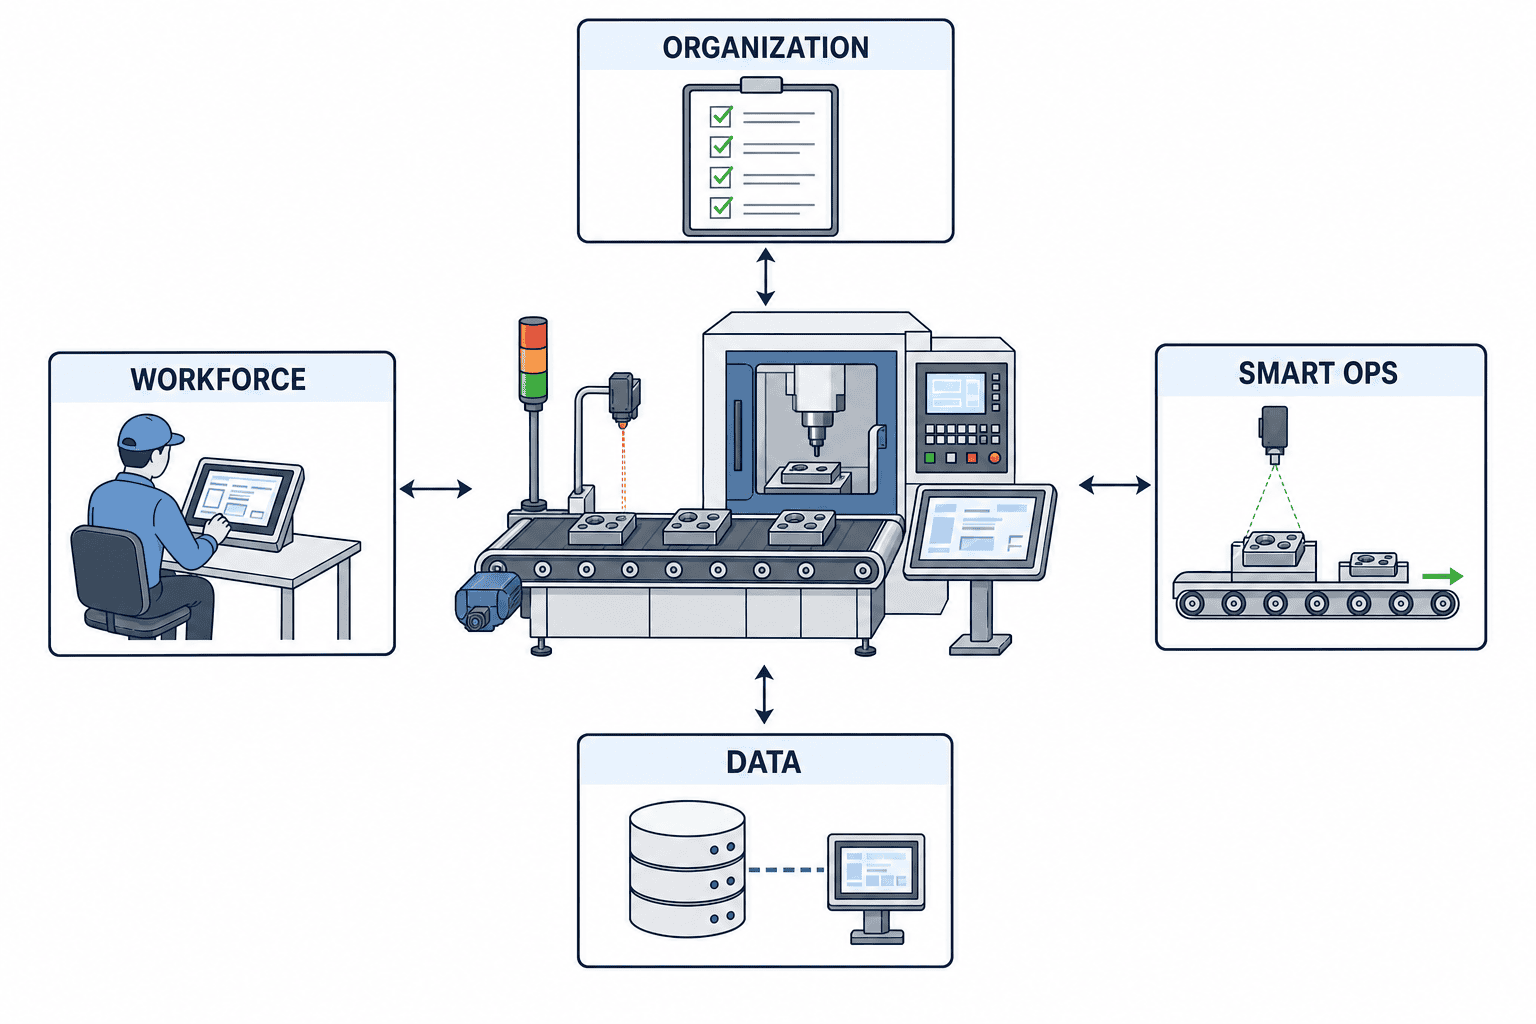
NSTDA’s Sustainable Manufacturing Center brought 61 industrial companies into its 2026 pilot DX Strategy workshop. The public explanation does not treat transformation as technology acquisition alone. It brings together four areas.
| Area | First question | Deliverable by day 90 |
|---|---|---|
| Organization | Are the objective, sponsor, decision rights, and change rules clear? | Sponsor, problem statement, approval gates, governance rhythm |
| Smart Operation | Where do material, work, people, and decisions actually stop? | Current workflow, target process, standard response |
| IT System & Data Transaction | What are the sources, master IDs, timestamps, granularity, interfaces, and access rules? | Data dictionary, collection specification, owners, integration boundary |
| Workforce Learning | Can each role use the new process and respond to exceptions? | Role-based learning, observed use, feedback procedure |
The four areas do not need identical maturity scores. The practical question is whether the weakest area can break the pilot. A machine signal may be available, but improvement cannot be compared if each shift applies a different downtime reason. A dashboard may be attractive, but behavior will not change unless someone is expected to decide within a defined time. Training attendance does not solve a process whose authority and work standard remain unchanged.
Use the six-dimensional Thailand i4.0 Index to find blind spots
NSTDA’s 2023 overview describes the Thailand i4.0 Index across Technology, Smart operation, IT system & data transaction, Market & customers, Strategy & organization, and Human capital. The labels are not identical to the four areas above, but they are useful lenses for finding omissions.
A maturity assessment should not end with a score. If IT system & data transaction is weak, translate it into operational questions: where are machine and product IDs normalized, how is data buffered during a connection loss, and who confirms a replay? If Human capital is weak, observe shift-level use, repeated input errors, and supervisor review—not training hours alone. Under Market & customers, verify how the operational change supports delivery, quality requirements, and customer response.
A three-phase factory DX roadmap for the first 90 days
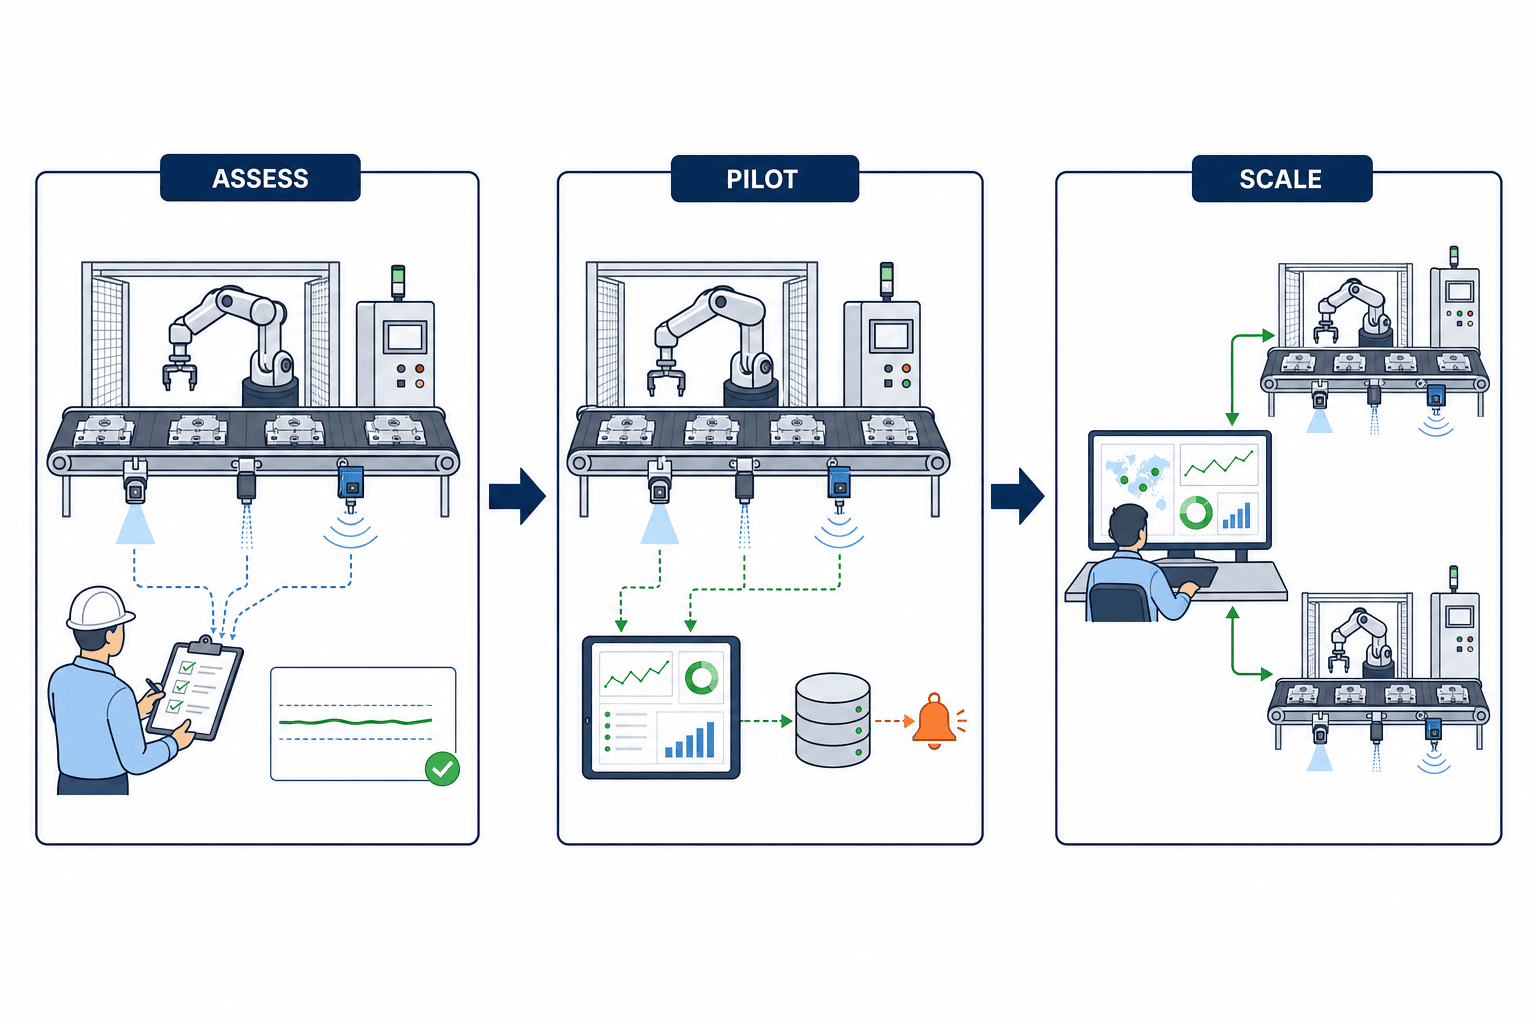
The following is a proposed operating model, not a government timetable. Adapt it to production calendars, permitted downtime, cyber reviews, and capital approvals. The goal is evidence for a scale decision, not a factory-wide rollout.
| Period | Phase | Main question | Completion criterion |
|---|---|---|---|
| Days 1–30 | ASSESS | Which bottleneck should change, and for what value? | Baseline, target workflow, owners, and data definitions approved |
| Days 31–60 | PILOT | Does the new data-to-decision cycle work on the floor? | Collection, display, response, and record complete one closed loop |
| Days 61–90 | SCALE | Should management continue, redesign, pause, or expand? | Effect, total cost, risk, and learning burden can be judged together |
Days 1–30: ASSESS the bottleneck before evaluating vendors
During roughly the first ten days, bring together the executive sponsor, plant manager, production control, manufacturing, quality, maintenance, and IT. Write the problem in one sentence. “Improve productivity” is too broad. “The molding team sees the plan-versus-actual gap only the next morning, so it cannot reassign operators within the shift” identifies the place, delay, and affected decision.
Observe the real process next. Map material, workpieces, machine signals, checks, spreadsheets, calls, and approvals in time order. When formal procedures differ from workarounds, record the real flow. Otherwise, digitalization merely fixes existing rework into software.
During days 11–20, freeze the baseline. Select one primary metric directly related to the problem and a small number of guardrail metrics. Examples include downtime, defect rate, work in process, plan attainment, or recording effort, but this article deliberately supplies no fictional target. Confirm how each factory can measure consistently. A metric with the same name can change when planned stops are included or when only good units form the denominator.
During days 21–30, approve a pilot charter. Specify the line, equipment, products, shifts, users, dates, collected events, response rules, and exit conditions. State what is out of scope. Cost estimates should include integration, network work, master-data preparation, training, parallel operation, maintenance, security, and production downtime—not only licenses and devices.
Days 31–60: PILOT the decision cycle, not just connectivity
A connected sensor or finished screen is not the start of a valid pilot. A complete cycle occurs when a deviation happens, data is recorded, an owner receives it, that person decides, and the response is stored.
In days 31–40, reconcile data. Where cycle signals, PLCs, inspection equipment, barcodes, and operator input coexist, check clock synchronization, gaps, duplicates, units, and equipment IDs. Compare screen counts with physical output, paper records, and current systems. Record mismatch causes instead of assuming the new source is correct.
In days 41–50, embed the data into existing routines: morning meetings, shift handovers, escalation, and maintenance requests. Adding a separate dashboard meeting often increases work. Replacing an existing decision is more likely to persist. Collect use logs, wait time, entry errors, and questions. Change the work standard as well as the screen.
In days 51–60, test exceptions: network failure, product change, absent staff, night shift, manual mode, rework, and master-data changes. Factory systems often lose trust during exceptions rather than normal runs. If exception design is postponed, users return to spreadsheets or messaging apps and create competing sources of truth.
Days 61–90: SCALE only after testing repeatability
During days 61–75, compare the result against the ASSESS baseline using the same definitions and scope. Note changes in product mix, output, overtime, and maintenance. Do not attribute every movement to software; separate changes in work standards, staffing, machine tuning, and learning.
During days 76–85, review total cost and operating capability. Include subscriptions, replacement devices, connectivity, master maintenance, first-line support, vendor support, recurring training, and audits. Distinguish settings the floor can maintain, changes IT must control, and work that needs external support. A pilot that only one vendor engineer can operate is not ready to scale.
During days 86–90, hold the management gate. The decision is not limited to “roll out” or “failure.” Options should include continue, continue with conditions, redesign, narrow scope, pause, and stop. Document the reasons and re-entry conditions so that even a stopped pilot becomes useful evidence.
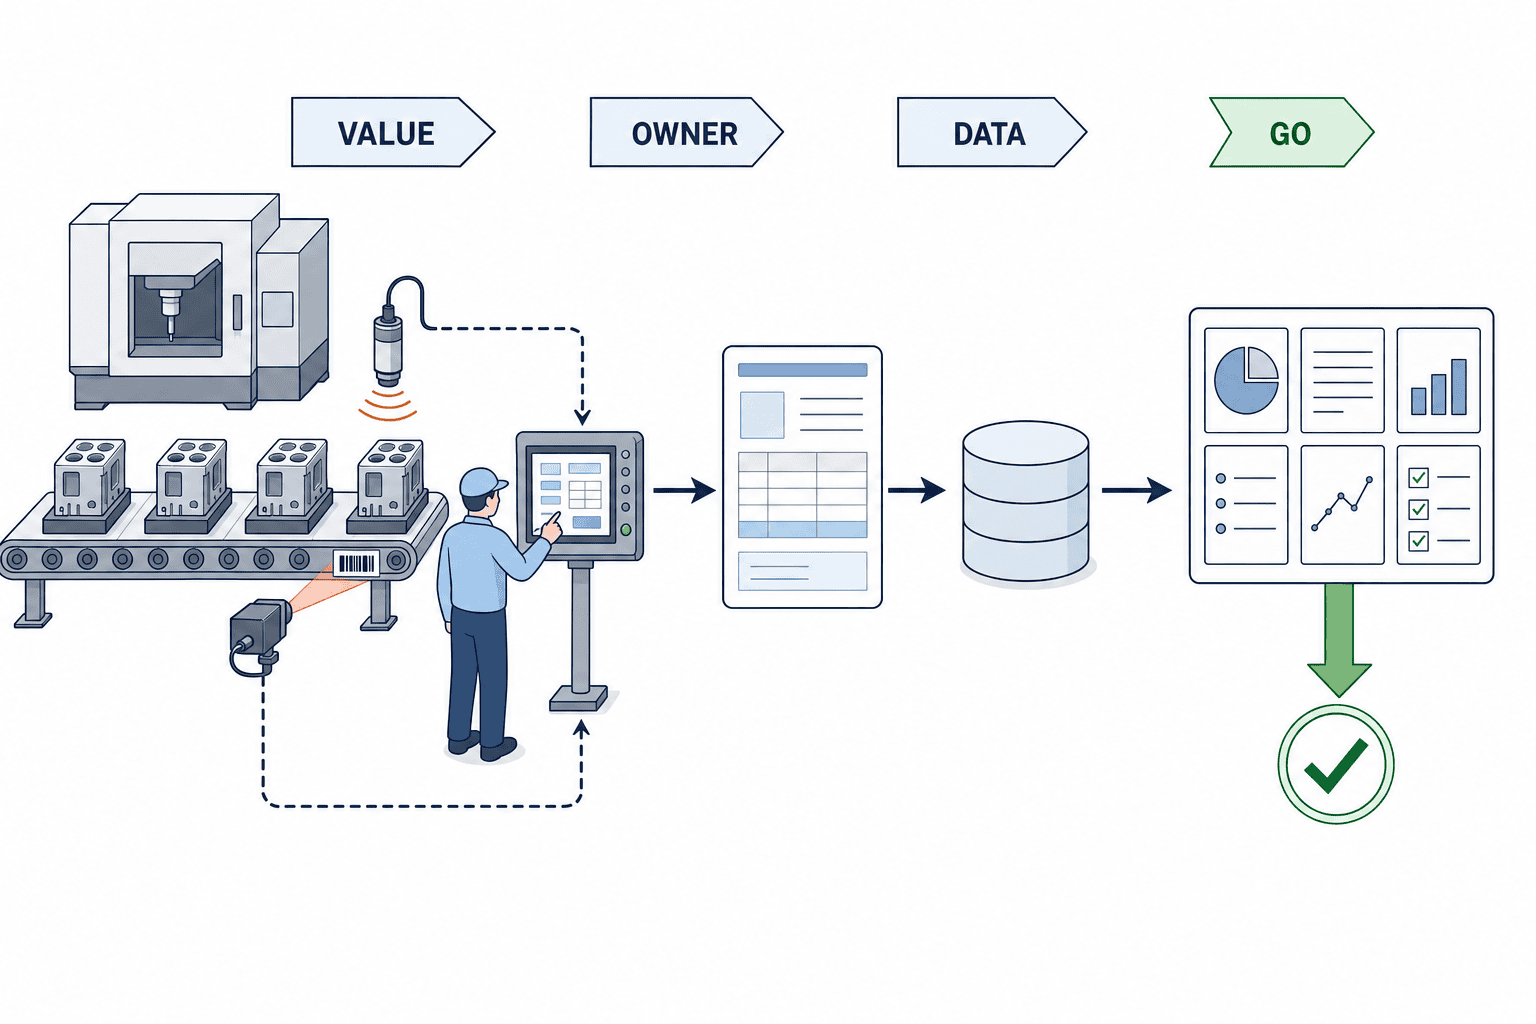
Three decision gates keep investment tied to evidence
Gate 1 — VALUE: Can the problem and value be explained in one sentence?
The VALUE gate confirms the problem, target, baseline, desired change, and business relevance. ROI is not a calculation added at the end; it determines what evidence must be collected at the beginning. NSTDA’s 2026 explanation emphasizes roadmaps based on business priorities, investment needs, and expected returns, together with ROI-informed prioritization. It does not prescribe a universal return target or payback period.
“Visualize downtime” is incomplete. “Confirm downtime reasons early enough to choose a countermeasure within the same shift” connects data to action and determines timestamp granularity, input roles, notifications, and meeting cadence.
Gate 2 — OWNER and DATA: Who runs it, and what remains the source of truth?
Separate the executive sponsor, process owner, data owner, technical owner, and shop-floor champion. The process owner controls the KPI and standard work. The data owner controls meaning and quality. The technical owner controls interfaces, permissions, and incident handling.
The DATA gate asks whether information can retain the same meaning, not merely whether it can be collected. At minimum, agree on sources of truth for equipment, items, operations, work orders, lots, timestamps, states, and reason codes. A data lake is not mandatory. Existing databases may be enough for a narrow pilot, provided identifiers, history, access, retention, and corrections are controlled.
Gate 3 — GO: Are scale and stop criteria equally explicit?
Judge value together with data quality, adoption, exception handling, maintainability, cybersecurity, and training load. If a charter only says “scale when benefits appear,” teams continue by inertia when hidden problems emerge. Write scale and hold/redesign criteria in parallel.
| Dimension | GO evidence | HOLD / REDESIGN evidence |
|---|---|---|
| Value | Comparable result under the same definition | Changed conditions make comparison invalid |
| Data | Causes and correction of gaps/duplicates are controlled | Manual correction is routine; source of truth unclear |
| Operation | Standard response works across shifts | Process stops when one expert is absent |
| People | Users and first-line support demonstrate their roles | Attendance recorded, practical ability unverified |
| Risk | Access, backup, and incident responsibilities confirmed | Production connection boundary remains disputed |
Define the data container before MES–ERP integration
The “data container” is not a brand or necessarily a large platform. It is the agreed structure that records factory events, identifies the source of truth, and preserves traceability.
Production plans may live in ERP, execution in MES, equipment states in PLC/IoT, quality in an inspection system, and maintenance in CMMS. Cross-process analysis still fails if work order, item, operation, equipment, lot, and time do not align. Conversely, there is no need to move everything into one database on day one. Define the minimum events needed for the decision and list their source, steward, and consumers.
| Data | Possible source of truth | Event | Quality check | Decision supported |
|---|---|---|---|---|
| Work order | ERP / production control | Release or revision | Version, quantity, due date | Dispatching and delay action |
| Production result | MES / floor entry | Complete or interrupt | Duplicate, time, disposition | Progress, capacity, overtime |
| Equipment state | PLC / IoT | State transition | Gap, signal bounce | Downtime response, maintenance |
| Quality result | Inspection / QMS | Inspection | Specification version, gauge | Hold, retest, cause analysis |
| Reason code | MES / terminal | Cause confirmation | Selection rule, unresolved state | Improvement priority |
For overseas factories, include headquarters codes versus local terminology, Thai/English displays, time zones, and approval authority. See our overseas plant system rollout guide for multi-site considerations.
ROI is an evidence design, not a number-making exercise
Benefits and costs must share the same scope and period. Annualizing an expected saving while excluding support, updates, training, and operating labor produces a distorted view. Monetizing every possible benefit also adds assumptions. In the first 90 days, build an evidence pack containing:
- baseline period and scope;
- metric definition and data source;
- investment, implementation, operation, training, and downtime cost boundaries;
- non-system improvements and external factors;
- operating conditions needed to sustain the result;
- review date and continue, change, or stop criteria.
ETDA’s 9 September 2026 release on SMEs GROWTH 2026 describes an assessment-first approach using DMI. It reports 1,697 SMEs, 138 digital service providers, and 108 matches. It also reports total socioeconomic impact of THB 689.5 million, allocated as THB 530.6 million (77%) to SMEs and THB 158.9 million (23%) to providers. This is program-level socioeconomic impact. It is not the ROI of an individual company and does not guarantee savings. Dividing that total by the number of participants would not produce a valid factory business case.
Check Thai support and incentives only after the value hypothesis
NSTDA and BOI reported on 31 July 2026 that more than 2,200 industrial companies had expressed interest, more than 500 companies had received expert support, and resulting investment plans exceeded THB 3 billion. The same release separately cites 2,062 applications worth THB 206.054 billion for 2021–May 2026 and 17 projects worth THB 1.033 billion in a specified measure/context. These figures have distinct populations and periods. They must not be added together or presented as if every expression of interest became an approved investment.
A separate BOI release covers 2023–H1 2026 and reports 1,397 projects worth THB 146 billion, including examples such as MES–ERP integration. Its period and scope differ from the preceding statistics, so the totals should not be compared as a trend.
BOI’s current Smart and Sustainable Industry page lists, for the relevant measure, a minimum investment of THB 1 million and a three-year corporate income tax exemption, generally capped at 50% of investment. It also describes a possible 100% ceiling when machinery used by the project that is linked to the domestic automation industry, or machinery used by the project that supports that industry, accounts for at least 30% of the total value of machinery, automation systems, or robots used or upgraded in the project, and the other requirements are met. These are conditional incentives, not automatic grants. Eligibility depends on each project’s business, equipment, expenditure, technology, and application timing. Confirm current conditions with BOI or a qualified adviser before investment approval. Current BOI guidance takes precedence over incentive wording on older pages.
Connect production-management workflow improvement to DX
Production control crosses planning, material issue, start, completion, inspection, and receipt. Digitalizing only one handoff can increase the number of screens. Aim to record information once at its source so that downstream work can reuse it without re-entry.
If plan variance is the problem, automating a next-morning spreadsheet does little when production confirmation remains late. Machine counts alone may omit defects, setup, split lots, and rework. The design must connect shop-floor events and business approval.
Mark waiting, transcription, checking, decisions, approvals, and corrections on the current workflow. Look for long delays, repeated entry, and classifications based only on personal experience. Then draw the future flow, including new duties for data-quality review, alert response, and master maintenance—not only tasks that disappear.
Make Workforce Learning observable in daily work
Do not give every role the same system course. Define the decisions each role must be able to make.
| Role | Capability required by day 90 | Evidence |
|---|---|---|
| Executive sponsor | Explain value, investment, and stop conditions | Recorded gate decision |
| Plant/process owner | Connect KPI to standard work and prioritize exceptions | Daily action log |
| Supervisor | Detect gaps and assign response | Shift-based scenario exercise |
| Operator | Enter, check, and escalate according to standard | Direct work observation |
| IT/maintenance | Diagnose, recover, document, and coordinate vendors | Incident drill and recovery log |
Attendance is activity, not proof of capability. Test actual work on all relevant shifts. If adoption is low, examine terminal location, latency, gloves, language, permissions, and performance incentives before labeling the problem “resistance.” Treat shop-floor feedback as input to the next specification.
Five common factory DX failures and controls within 90 days
1. Expanding scope around a preferred solution
Fix the problem statement, baseline, target process, and decision owner before requesting proposals. Compare vendors by whether they can reproduce the target events and controls, not by feature count.
2. Calling a PoC successful when data becomes visible
Visibility is not an operating result. Run the loop from deviation through assignment, action, and outcome record, and verify that it replaces an old routine.
3. Leaving core data definitions to each vendor
Product-specific equipment IDs and reason codes multiply conversion work. The business should own meaning and source of truth; technical teams implement it. Manage change history and retired codes.
4. Concentrating knowledge in one expert
Separate process, data, and technical ownership. Keep the decision log, dictionary, and incident procedure. Test whether a backup person on another shift can operate the process.
5. Making incentives necessary for the ROI to work
Support measures may improve economics, but eligibility and timing are project-specific. Validate operating value without the incentive first, then model confirmed benefits as a conditional scenario.
Checklist before launching the 90-day roadmap
Management and organization
- Is the problem stated with location, delay/loss, and affected decision?
- Are executive sponsor and process owner distinct and accountable?
- Are GO, HOLD, REDESIGN, and STOP criteria written?
- Is the final decision maker known when departments disagree?
Floor and data
- Has the real workflow, including exceptions, been observed?
- Are baseline definition, period, scope, and source fixed?
- Are sources of truth known for equipment, item, operation, lot, work order, and reason?
- Does data survive network loss, manual mode, rework, and night shift?
People and operation
- Is required decision capability defined by role?
- Will capability be observed after training?
- Are first-line support, master maintenance, and change approval assigned?
- Is there a route from floor feedback to specification change?
Investment and risk
- Do costs include operation, training, downtime, and renewal?
- Do benefit and cost scopes and periods match?
- Have cybersecurity, backup, and access been reviewed?
- Will current BOI or other conditions be checked per project?
Frequently asked questions
What is the first step in factory DX?
Define one operational bottleneck that affects a business decision and measure its current state consistently. Then agree on workflow, owners, required data, and decision gates. Technology comparison comes after these conditions.
Can a factory DX roadmap finish in 90 days?
No. This 90-day model tests a limited value hypothesis and operating method so management can decide whether to scale, change, or stop. A full rollout depends on production access, sites, interfaces, cybersecurity, and approvals.
Does a small-start system implementation only target small benefits?
No. The test scope can be one process while the value hypothesis still connects to delivery, quality, inventory, or downtime. Narrow the proof, not the business perspective.
Can manufacturing DX case studies prove our ROI?
They can inform problem framing and design, but they do not prove your return. Equipment, product mix, utilization, labor, quality rules, and current systems differ. Use your baseline and total cost.
Are BOI incentives guaranteed for factory DX in Thailand?
No. Current guidance includes minimum investment and tax-exemption ceilings, as well as conditions on the share of project machinery linked to or supporting the domestic automation industry within the total value of machinery, automation systems, or robots used or upgraded. Eligibility must be confirmed for each business, expenditure, machinery structure, and timing.
Should MES or ERP come first?
There is no universal answer. ERP or production control may lead when planning, inventory, or cost consistency is the constraint. MES may lead when immediate execution, downtime, or quality data is the constraint. First define the data contract linking work order, item, operation, and result.
Conclusion: Use the first 90 days to become ready to decide
A sound approach to factory DX looks at Organization, Smart Operation, IT System & Data Transaction, and Workforce Learning together, while progressing through ASSESS, PILOT, and SCALE. VALUE, OWNER, DATA, and GO gates prevent the project from becoming an endless PoC or an isolated data project.
The target is not “DX complete.” It is a decision-ready evidence pack that puts value, data, behavior, cost, and risk on the same page. Support programs and tax measures can then be checked under current, project-specific conditions.
If your Thai plant is still defining its bottleneck, 90-day roadmap, or the boundary among MES, ERP, and IoT, you can contact TOMAS TECH even before a system has been selected. We can help structure the shop-floor observation, decision gates, and data container.
References
- NSTDA: Driving Industry 4.0 Readiness Through Practical DX Strategy, 27 Aug 2026
- NSTDA i4platform: DX Strategy Workshop, 10 Aug 2026
- NSTDA and BOI: Industry 4.0 drive with incentives, 31 Jul 2026
- ETDA: SMEs GROWTH 2026, 9 Sep 2026
- BOI: current Smart and Sustainable Industry conditions
- BOI press release topic 139138
- NSTDA: Industry 4.0 Platform and Thailand i4.0 Index, 2023
*Published figures and incentive conditions reflect their cited dates or access date. Verify current conditions for each project before making an investment decision.*


