


Compressed-Air Leak Control in Thailand: A 30/60/90-Day Factory Guide
The compressor room appears normal and production is still running, yet electricity use remains high and pressure margin at the far end of the plant is shrinking. In this situation, leaks may be silently consuming both energy and production capacity. Effective compressed-air leak control is not a one-time ultrasonic survey. A brownfield factory needs defined supply, transmission and demand boundaries; synchronized power, flow and pressure data; repair verification under comparable operating conditions; and continuous monitoring that detects recurrence.
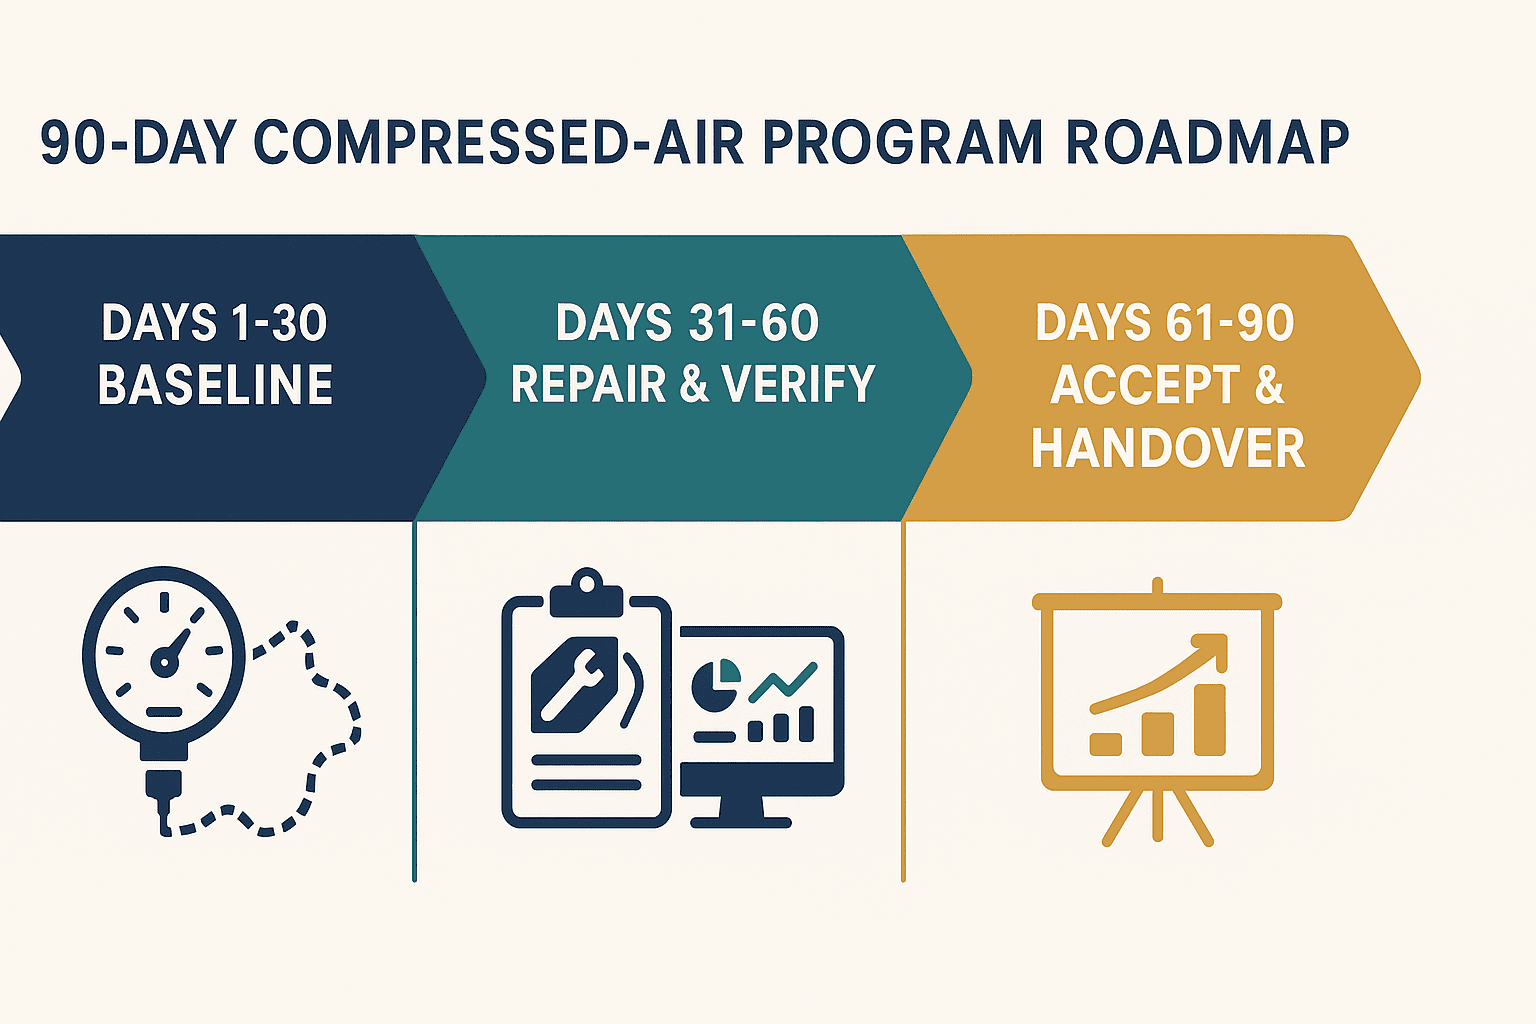
This guide gives Thailand factory managers, maintenance teams and regional IT/OT leaders a practical 30/60/90-day plan. It also provides an RFP and PoC specification, clearly labelled calculation assumptions, a measurement and verification (M&V) approach, and requirements for data ownership, cybersecurity and handover.
Executive answer: manage a closed loop, not a leak count
Five principles should govern the program.
- Compressor nameplate kW is capacity information, not measured consumption or leakage loss. Actual power changes with load/unload behavior, VSD operating point, sequencing, intake conditions and pressure settings.
- Ultrasonic inspection is valuable for locating suspected leaks, but by itself it does not prove a plant-wide leakage percentage, the electricity saved after repair or the effect on pressure margin.
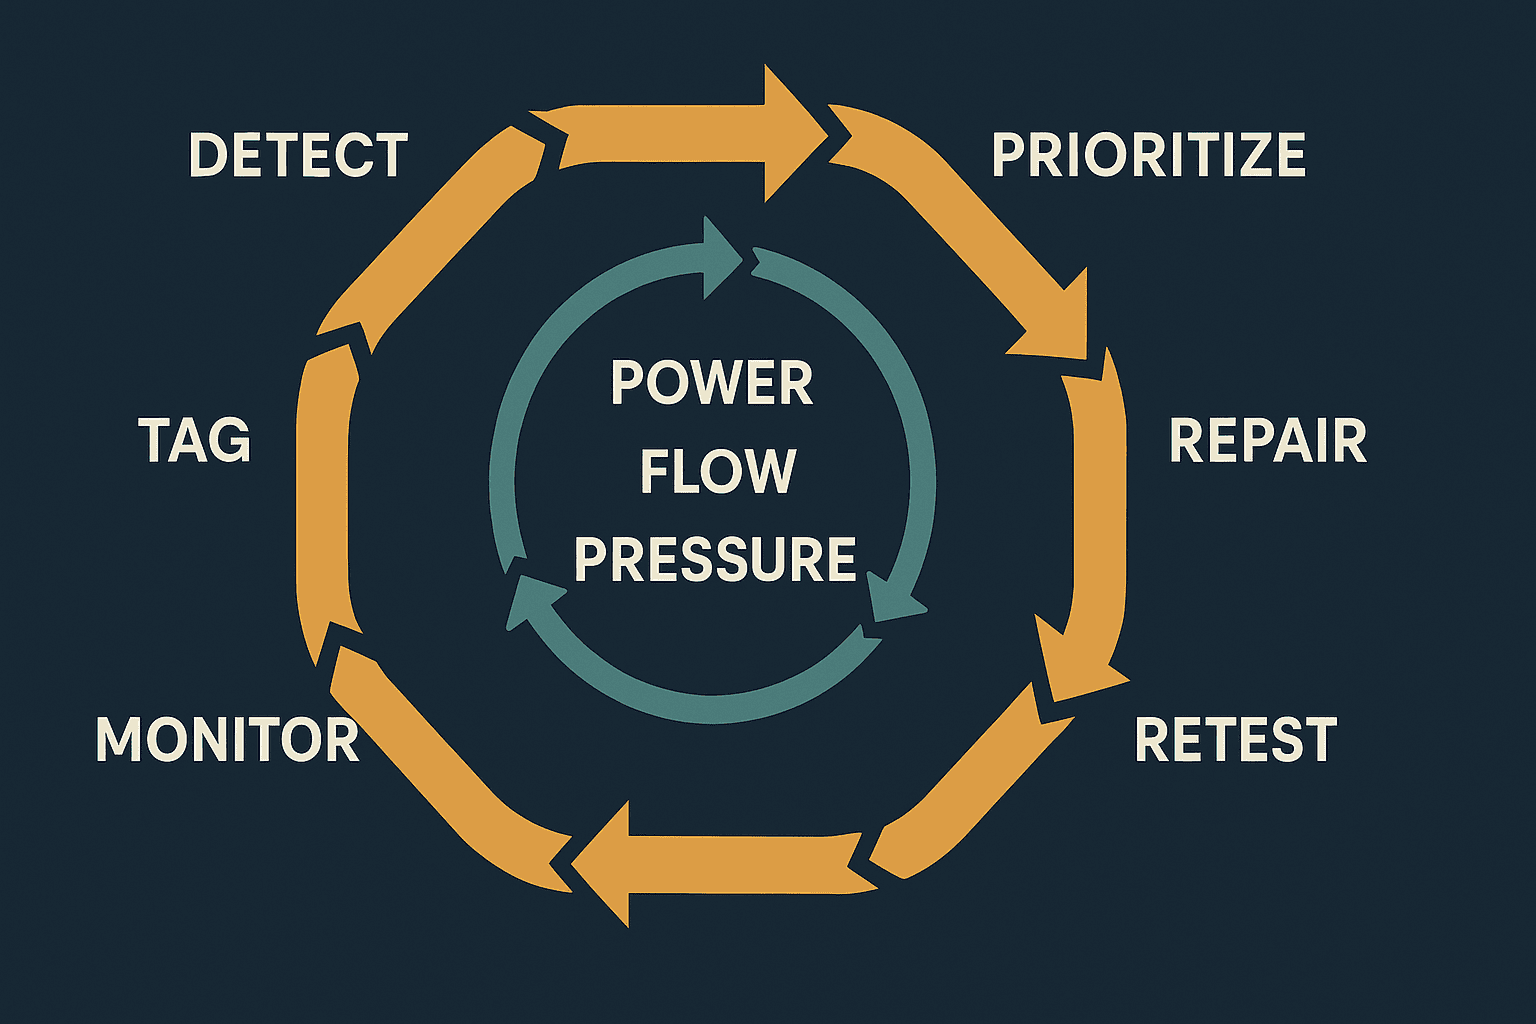
- Use a closed loop: detect, tag, prioritize, repair, retest, approve closure and monitor recurrence. Keep deferred, inaccessible, repair-failed and reopened tags distinct.
- Record power, flow corrected to a stated reference condition, header and critical end-use pressure, production volume and machine state on a common time base.
- ISO 11011 helps frame whole-system assessment, while ISO 50001 helps structure baselines, EnPIs, measurement and continual improvement. This article does not imply that certification to either standard is mandatory.
The U.S. Department of Energy compressed-air sourcebook states that leaks can waste 20–30% of compressor output in poorly maintained systems and that a proactive program may reduce leakage to below 10%. These are general benchmarks, not a diagnosis or guarantee for any specific factory. The factory’s own value must be measured.
Why nameplate kW and the electricity bill are not enough
A 75 kW nameplate does not mean the compressor continuously consumes 75 kW. A load/unload unit can draw material power while unloaded. A VSD compressor does not have uniform efficiency across its entire speed range. With several machines, poor sequencing may keep multiple units at inefficient part load when one could be stopped. Intake temperature, cooling, filter differential pressure, dryers, drains and pipe resistance also affect system energy.
The monthly utility bill combines compressed air with every other electrical load and varies with production, weather, shifts and holidays. At minimum, meter the compressor bank or each compressor and measure flow at the treated-air main header. If possible, separate dryers and auxiliaries so the boundary “compressors only” is not confused with “complete compressed-air system.”
Pressure alone can also conceal waste. If controls maintain header pressure while leakage increases, pressure may look normal while flow and power rise. Flow alone can mislead when pressure, meter correction or pipe restrictions change. Power, flow, pressure and operating state must therefore be reviewed together.
Why a one-off ultrasonic leak survey is insufficient
Ultrasonic scanning can locate leaks around couplings, hoses, valves, FRLs, cylinders, quick connectors and drains in a noisy operating factory. However, an instrument’s estimated leak rate depends on distance, angle, background sound, pressure, settings, calibration and hole geometry. It should not automatically become an accounting-grade savings figure.
The survey may also miss idle machines, isolated branches, inaccessible high points, insulated or buried pipework. Leaks can recur after the visit. A report containing only photographs and locations soon becomes stale unless it records who repaired each item, when it was retested, who approved closure and whether it reopened.
Define ultrasound as the tool for locating and prioritizing suspected leaks. Verify plant-level performance through non-production base demand, specific energy, air per unit of output, pressure stability, load/unload behavior and the number of compressors operating.
Using ISO 11011 and ISO 50001 in practice
ISO 11011:2013 addresses compressed-air assessment as a complete system comprising supply, transmission and demand, with analysis, reporting and estimates of savings. The full normative requirements should be checked in the official standard. In an RFP, however, it is practical to request a supply/transmission/demand boundary diagram, measurement method, uncertainty statement and documented basis for each improvement estimate.
ISO 50001:2018, confirmed as current in 2024, provides a framework for energy baselines, energy performance indicators (EnPIs), measurement, operational control and continual improvement. A factory can apply these ideas without pursuing certification: select a baseline period, define adjustment variables, review results and trigger corrective action when performance deteriorates. Certification status alone does not prove that a leak program works.
In simple terms, ISO 11011 helps answer “what and how should we assess?” while ISO 50001 helps answer “how do we sustain performance after the assessment?”
| Management topic | ISO 11011 application | ISO 50001 application | Example deliverable |
|---|---|---|---|
| Boundary | Supply, transmission and demand | Significant energy use and responsibility | P&ID, meter map, exclusions |
| Measurement | Power, flow and pressure methods | Baseline, EnPI and data quality | Measurement plan, tag list, missing-data rules |
| Improvement | Leaks, pressure loss, controls and demand | Objectives, action plans and review | Opportunity register, owner, due date |
| Verification | Analysis and reporting of savings | Normalization and corrective action | M&V report, monthly dashboard |
Define the measurement boundary first
Mark the boundary on a single-line diagram or P&ID. Supply includes compressors, intake, aftercoolers, receivers, dryers, filters, drains and sequencing controls. Transmission includes main headers, ring mains, branches, valves and joints. Demand includes production machines, blow-offs, cylinders, vacuum ejectors, tools, purges, cooling and cleaning.
For each boundary, record:
- Power: compressor or bank kW, kWh and power factor, explicitly stating whether auxiliaries are included.
- Flow: reference condition such as Nm³/h or Sm³/h, pressure/temperature compensation, direction, range and accuracy.
- Pressure: compressor discharge, before/after treatment, main header, remote ends and critical machine inlets.
- State: load/unload, VSD speed, run/stop, setpoint, alarm and valve state.
- Operations: shift, product mix, quantity, line status, planned shutdown, cleaning and startup.
Confirm whether a flow meter reports actual or standard-condition volume. Synchronize temporary instruments, PLCs and historians. Preserve raw data before aggregation; otherwise a one-minute mean may hide a short pressure dip that stops a machine.
Six indicators for flow-meter monitoring
1. Non-production base flow
Measure flow during holidays, breaks or between shifts. Instrument air, safety purges and other legitimate continuous demands must be inventoried rather than labelled as leakage. Investigate the residual.
2. Specific energy
Use kW/(m³/min), kWh/Nm³ or another consistently defined indicator. Compare similar load bands and fixed meter boundaries. Deterioration may come from leaks, but also from intake conditions, filtration, dryers, controls or compressor combination.
3. Air per unit of production
Normalize flow by good units, good mass or operating time. If product mix materially changes demand, use product families or standard hours as adjustment variables.
4. Average, minimum and pressure range
Track the minimum and variability, not only the average. Acceptance should confirm that reduced flow did not create unacceptable pressure at the most demanding end use.
5. Unloaded hours and running units
After leaks are repaired, unchanged sequencing can leave machines rotating unloaded. Treat repair and control recommissioning as separate actions.
6. Tag closure and recurrence
Measure repair within due date, verified closure, 30/90-day recurrence and reasons for open items. Prioritize safe, high-impact and readily repairable leaks rather than maximizing the number of tags.
Worked leak-cost example with explicit assumptions
The following figures are illustrative, not a case-study result. Use the factory’s current invoice, operating schedule, measured flow, measured power and compressor performance for an investment decision.
Assume:
- Pre-repair non-production flow: 1,000 Nm³/h
- Necessary continuous demand: 300 Nm³/h
- Suspected leakage flow: 700 Nm³/h
- Measured specific energy: 0.11 kWh/Nm³
- Applicable operation: 6,000 h/year
- Assumed all-in energy rate: THB 4.20/kWh
Leak-equivalent power (kW) = leakage flow (Nm³/h) × specific energy (kWh/Nm³)
Annual loss (kWh/year) = leak-equivalent power × applicable hours
Annual cost equivalent (THB/year) = annual loss × all-in energy rate
Under these assumptions, leak-equivalent power is 700 × 0.11 = 77 kW, annual energy is 77 × 6,000 = 462,000 kWh, and the cost equivalent is 462,000 × 4.20 = THB 1,940,400 per year. This is not necessarily the utility-bill reduction. If compressor sequencing is unchanged, unloaded power may remain; some base demand may also be necessary or not repairable.
A stronger alternative is to compare measured power before and after repair under similar production, pressure, shift and weather conditions:
Adjusted saved power = pre-repair average kW − post-repair average kW ± operating-condition adjustments
Annual savings = adjusted saved power × applicable annual hours × effective tariff
Thailand’s Energy Regulatory Commission lists the September–December 2026 Ft charge as 16.23 satang/kWh, or THB 0.1623/kWh. Ft is only one component of the electricity tariff, not the total rate. Do not use THB 0.1623/kWh as the all-in energy price. Use the current invoice and determine whether energy, demand, Ft and tax components are affected.
Days 1–30: build a trustworthy baseline without disrupting production
During the first 30 days, establish boundaries and data quality before rushing to claim savings. Safety-critical leaks should, of course, be addressed immediately under plant procedures.
Days 1–10: scope and mobilize
Bring together plant management, maintenance, production, energy, IT/OT, EHS and procurement. Define compressors, headers, buildings and lines in scope. Collect P&IDs, equipment lists, 12 months of bills, run hours, maintenance history and pressure complaints. Record shutdown restrictions, hazardous areas, work-at-height and access requirements.
Days 11–20: align permanent and temporary meters
Confirm tags, units, sample rates, clocks and storage. A practical PoC starting point is 1–5-second collection for power, flow and header pressure, with one-minute analytical values while retaining raw data; remote pressure may be 1–10 seconds and operating events event-based. These are not mandatory standard values. Require the bidder to justify the proposed rates.
Days 21–30: baseline and first scan
Capture normal production, low load and non-production periods. Perform the first ultrasonic survey. Each tag should include a unique ID, equipment/location, photograph, time, operating pressure, estimated magnitude, proposed repair, shutdown need, safety class, priority, owner and due date. Start the dashboard with total flow, kW, specific energy, key pressures, non-production base and alarms rather than excessive graphics.
Days 31–60: close priority repairs and verify them
Repair high-priority items first and retest using the same method. Rank by safety, production quality, loss estimate, shutdown opportunity, repair duration, spares and recurrence. A high-flow leak that needs a shutdown may enter the next planned outage, while an easy coupling repair can be completed in routine maintenance.
Do not close a tag merely because work was attempted. Record the post-repair ultrasonic check, local pressure, photograph, parts, technician and time. Separate non-leak demand improvements such as unnecessary blow-off, vacuum ejectors, open drains, pressure setpoints and sequencing. Any pressure reduction must be proven at the most remote and pressure-sensitive equipment.
At the 60-day gate, review closure of critical tags, retest rate, missing data, clock drift, pressure-limit violations and change in non-production base flow. Keep savings provisional until there is a representative comparison period.
Days 61–90: acceptance, M&V and operational handover
Reinspect repaired points after about 30 days and complete a second survey for new leaks. Normalize pre/post data for production, hours, product mix, pressure setpoints and compressor combination.
Agree observable acceptance criteria before implementation, including:
- Data availability at or above the agreed threshold.
- Clock alignment within tolerance and documented treatment of gaps and outliers.
- Documented meter boundaries, units and correction conditions.
- Traceability from detection through repair, retest and approval.
- Reports of open/deferred tags with owner and date.
- Tested alarms for pressure, base flow and specific energy.
- Buffering or explicit missing-data indication during outage, without duplicates after recovery.
- Role-based access, audit log, backup and restore test.
- Customer export of raw data, configuration, tag register and formulas in an agreed format.
Avoid an acceptance statement that only says “reduce leakage by 30%.” The repairable scope, legitimate base demand, operating variation and baseline may still be unknown. A better clause compares adjusted non-production flow or measured average power within the agreed boundary and period, while reporting uncertainty and open items. A two-stage target, confirmed after the baseline, can be more defensible.
Twelve requirements for the RFP and PoC
1. Objective and business outcomes
Rank electricity cost, remote pressure stability, capacity, reliability, maintenance labor and ISO 50001 support. Do not use one metric as a substitute for all objectives.
2. Scope and exclusions
Show compressors, treatment, receivers, headers, buildings, lines and end uses. Identify emergency machines, rental compressors and instrument air that are excluded.
3. Meters and installation
Specify range, accuracy, calibration, straight-run needs, correction, IP rating, power supply, shutdown work and installation responsibility for power, flow and pressure instruments.
4. Sampling and retention
Define acquisition and storage intervals, time zone, NTP, raw-data retention, aggregation and missing-data flags. Do not retain only one-minute averages if transient pressure matters.
5. Leak-tag workflow
Require unique ID, photograph, equipment hierarchy, location, pressure, estimate type, priority, repair, parts, shutdown, safety, owner, due date, state, retest, approval and recurrence.
6. Repair closeout
State who repairs, who verifies and what evidence constitutes pass. Preserve an audit history even if one team performs both roles.
7. M&V baseline
Define baseline and reporting periods, hours, production, product mix, weather, setpoint, running units, adjustment variables, outliers, missing data and uncertainty. Hand over formulas and input data.
8. Acceptance criteria
Make data availability, meter behavior, dashboard refresh, alarms, tag closure, export, recovery and training objectively testable. A screen demonstration is not an acceptance test.
9. Data ownership
Define ownership and location of raw and aggregated data, photographs, tags, formulas, configuration and accounts; API/CSV export; and return/deletion at contract end. Review data location and cross-border transfer for cloud services.
10. OT cybersecurity
Include segmentation, least privilege, named accounts, MFA, approved remote-access windows, audit logs, encryption, vulnerability response, backups, restore testing and incident notification. IoT sensing does not justify unrestricted access to control networks.
11. Training and handover
Require the needed Thai and English materials for maintenance, energy, IT/OT and administrators. Practise tag handling, meter replacement, user administration, alarm changes, export and fault isolation on the installed system.
12. Commercial and expansion terms
Separate PoC, hardware, installation, shutdown work, licenses, connectivity, cloud, support, calibration, spares, extra tags and additional sites. For budgeting, see our Factory IoT cost guide for Thailand and Thailand factory energy-monitoring RFP guide.
PoC architecture and OT cybersecurity
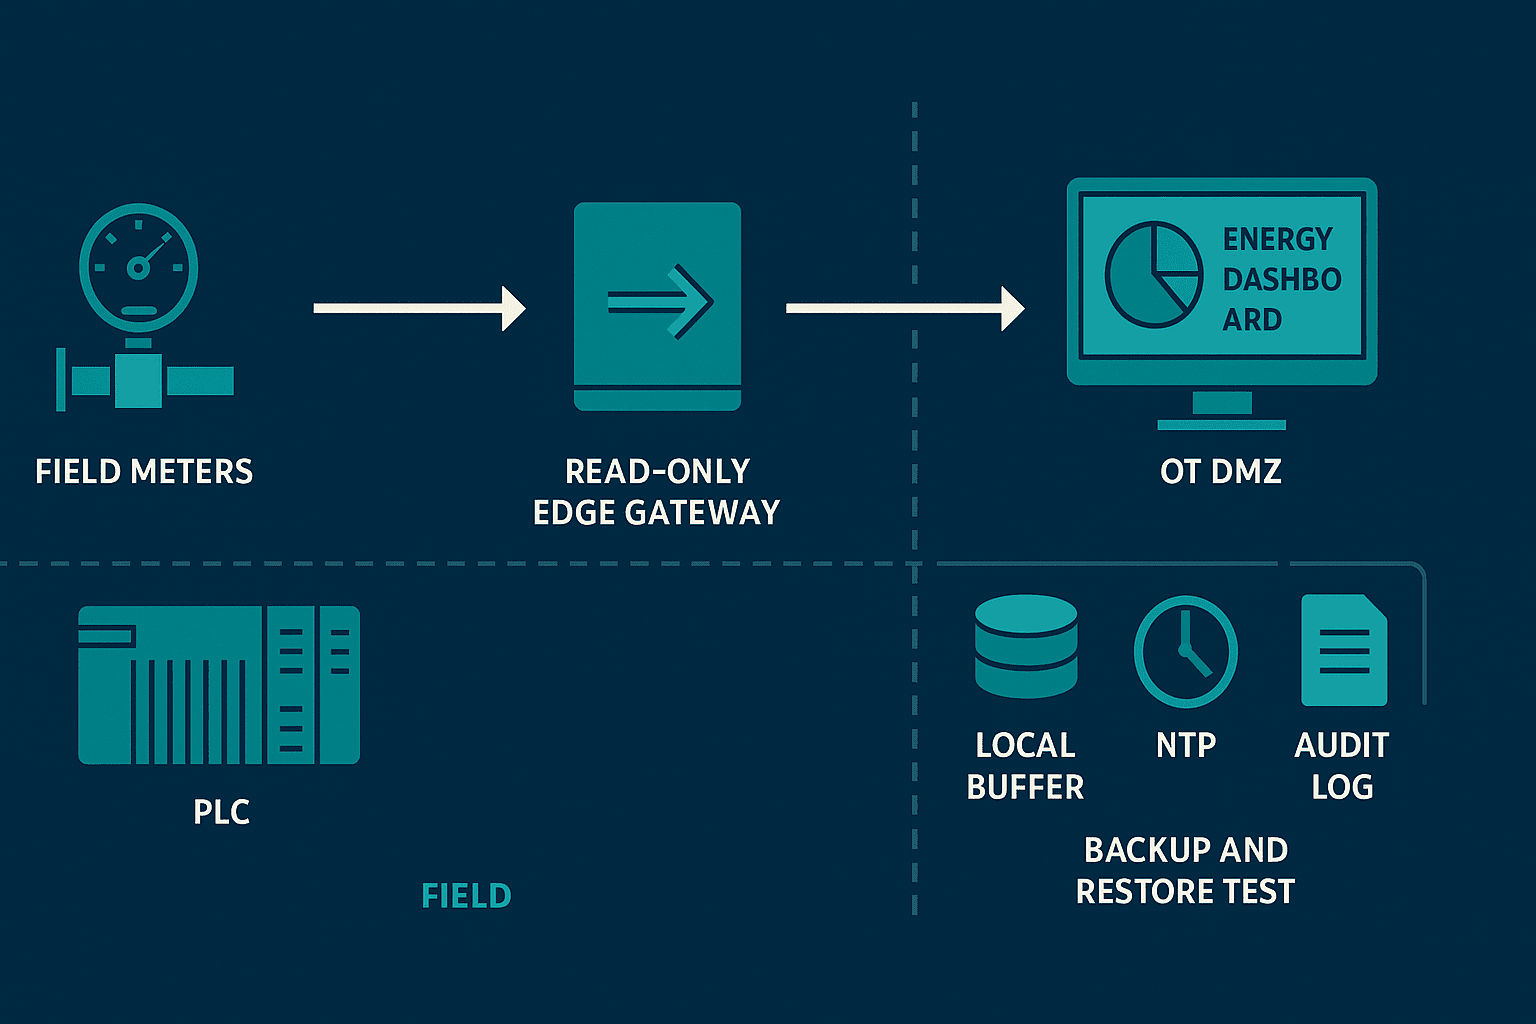
In a brownfield site, do not connect field sensors straight to a dashboard without documented boundaries. Collect data through a read-only gateway or approved acquisition layer and pass it through an OT DMZ or other controlled interface to analytics. If no control write-back is needed, keep the solution read-only; future closed-loop control should undergo separate risk assessment and change management.
Use individually identifiable accounts rather than shared credentials. Vendor remote access should require MFA, approval, time limits and logging. Plant control must remain safe during cloud or WAN outage. Test local buffering, replay, deduplication, time synchronization, certificate renewal, patching, backup and restoration during the PoC.
Turn cybersecurity into observable tests: disconnect the WAN without affecting control, restore communications without duplicates, disable a departed user and restore dashboard configuration from backup within the agreed time.
BOI Smart and Sustainable Industry: screen eligibility, do not assume it
Thailand BOI’s current Smart and Sustainable Industry page states a minimum efficiency-enhancement investment of THB 1 million, excluding land and working capital. Eligible projects may receive machinery import-duty exemption and a three-year corporate income tax exemption capped at specified percentages.
This does not mean that purchasing leak detectors, meters, gateways or dashboards automatically qualifies. Business activity, application timing, purchase commitments, system configuration, technical criteria, local linkage and accounting treatment require project-specific confirmation. Rules may change; consult current BOI guidance, the responsible office and qualified tax/legal advisers. This article does not guarantee eligibility or tax results.
Rather than asking a vendor to guarantee BOI approval, require itemized quotations, origin, model numbers, import classification, technical specifications, schedule and acceptance evidence that support the factory’s eligibility review.
Common failure modes and controls
- Treating all base flow as leakage: inventory instrument air and safety purges; distinguish necessary, improvable and leaking demand.
- Ignoring compressor sequencing after repair: recommission running units, setpoints and pressure bands so reduced demand becomes measured power reduction.
- Sizing a flow meter only for peak flow: verify low-flow turndown, bidirectional behavior, moisture/oil, straight run, calibration and maintainability.
- Using an estimated ultrasonic value as a guarantee: distinguish survey estimates, theoretical orifice calculations, measured flow and measured power. Contractual savings need agreed M&V.
- Building a dashboard without ownership: assign alarm recipients, response times, escalation, monthly review, calibration and tag-review responsibilities.
FAQ: practical compressed-air leak questions
Is ultrasonic leak detection alone sufficient?
No. It is effective for locating suspected leaks, but plant-level loss and verified savings require synchronized power, flow, pressure and operations data. A pressure-decay test may help when a system can be safely isolated and its volume and temperature effects are understood.
Where should a flow meter be installed?
At minimum, measure total treated-air supply at the main header. Add building or line submetering where accountability is needed. Confirm range, straight-run requirement, moisture, pressure and maintenance access on site, and mark whether the meter represents supply, transmission or demand.
How should a manufacturing energy-cost reduction be calculated?
Prefer adjusted measured power reduction multiplied by applicable annual hours and the effective invoice rate. If using flow, apply measured specific energy. Do not use the Ft component as the total tariff, and account for unloaded power and changes in production.
Is ISO 50001 certification required?
No. Its baseline, EnPI, measurement and continual-improvement concepts are useful even without certification. Whether to certify depends on corporate policy and customer requirements. Formal application of ISO 11011 or ISO 50001 should refer to the official standards and qualified advisers.
How quickly can results be judged?
Some repairs take days, but defensible verification needs representative production, low-load and non-production data. The 30/60/90-day schedule is a practical model and should be adjusted for outages, meter lead time, seasonal conditions and production plans.
What are the minimum RFP acceptance criteria?
Include data availability, time synchronization, units and correction, leak-tag closeout, pre/post M&V, minimum pressure, outage/recovery, access control, export and training. Any savings target must include the baseline and adjustment method.
Conclusion: build the capability to sustain savings
The lasting output is not a declaration of “zero leaks.” It is a documented boundary, trustworthy power/flow/pressure data, traceable tags, verified repairs, normalized M&V, recurrence alarms and a standard workflow with owners and dates.
DOE’s 20–30% benchmark indicates why leaks deserve attention, but it is not a factory-specific savings claim. Thailand’s Ft is not the total electricity rate. ISO frameworks and BOI measures do not guarantee performance or incentives. A measured, bounded PoC with explicit assumptions and acceptance criteria is therefore the safest way to scale.
TOMAS TECH can support early-stage scope definition, leak surveys, flow monitoring, a 30/60/90-day PoC and an RFP suited to brownfield shutdown constraints. You may contact TOMAS TECH even while meter locations and system boundaries are still being discussed.
Sources
- U.S. Department of Energy, *Improving Compressed Air System Performance*: https://www1.eere.energy.gov/manufacturing/tech_assistance/pdfs/compressed_air_sourcebook.pdf
- U.S. Department of Energy, Compressed Air Systems: https://www.energy.gov/cmei/ito/compressed-air-systems
- ISO 11011:2013: https://www.iso.org/standard/46580.html
- ISO 50001:2018: https://www.iso.org/standard/69426.html
- Energy Regulatory Commission Thailand, Ft: https://erc.or.th/th/automatic/
- Thailand BOI, Smart and Sustainable Industry: https://www.boi.go.th/index.php?language=en&page=smart_sustainable


