


Conversations about automation almost always start with equipment. We want to bring in a robot. We want to automate inspection. But the point where plants actually get stuck comes earlier than that, and it is a single question: which process should we automate first? A factory automation assessment is the self-evaluation that answers that question in-house. This article lays out the evaluation axes, the maturity levels, a checklist you can use as it stands, and how to carry the result through to a payback decision and a concrete next step.
What a factory automation assessment actually is
An automation assessment is the work of scoring your own current state across several axes before you select any equipment, so that you can set the order in which processes are tackled. It is usually called a readiness assessment, and the word readiness is the important part. What is being measured is not the equipment. It is the surrounding conditions that keep equipment running.
This is where the misunderstanding starts. People hear “automation assessment” and picture a physical fit check, along the lines of “come and tell us whether a robot fits on our line.” The real scope is far wider. Is the work procedure for the target process documented? Can signals be pulled out of the equipment? Is there a mechanism to measure the effect after installation? Is there anyone on site who can maintain it? Install high-performance equipment into a process where those conditions are missing and you are left with an asset that never reaches the utilisation you assumed.
The four ways plants fail when they skip the assessment
The failures we have seen on the ground in Thailand fall into roughly four patterns.
- Automating a process that is not the bottleneck. A labour-heavy process is visually obvious, but if it is not the constraint on the line, automating it does not raise total output. It simply builds up queues upstream or downstream.
- Automating a process whose procedure is not fixed. Operators absorb variation through judgement. Equipment does not. Automate a process that has not been standardised and it will halt every time an exception appears, until someone ends up standing next to it permanently.
- Having no basis on which to measure the effect. If you never recorded the operating performance before installation, the strongest thing you can say afterwards is that it feels better. That leaves nothing to put in front of the next approval request, and horizontal rollout stops there.
- Having no owner for maintenance. This one bites especially hard at Thai sites. Who does the first response when there is a fault? Where do the parts come from, and in how many days? Is there anyone local who can touch the program? Without those answers, a small defect keeps the line down for a long time.
None of these four has anything to do with the performance of the equipment. Which also means all four are things a prior assessment can catch.
An assessment also exists to produce a “not yet” decision
The purpose of an automation assessment is not to push automation forward. It is to separate, with evidence, which processes you automate now and which ones you deliberately leave alone for the time being.
It is not unusual for an assessment to conclude that a given process has no settled procedure, so the first investment should be in writing and enforcing the work standard. That is not a failed assessment. It is the highest-return conclusion available, because it clears a problem that a few hundred thousand yen of groundwork can fix, before you commit to capital spending in the tens of millions.
The evaluation axes of an automation assessment
Smart manufacturing maturity is generally measured on multiple levels running from 0 to 5, or from 1 to 5. How the axes are drawn varies between frameworks, but two families are widely known.
The first is a six-axis model covering strategy and leadership, smart factory infrastructure, operations and processes, products and services, data and connectivity, and people and culture. The second is a finer ten-axis model that scores network connectivity, equipment instrumentation, data collection infrastructure, CMMS maturity, analytics capability, integration architecture, cyber security, workforce digital skills, process standardisation, and change management as separate items.

The six-axis model suits management-level discussion; the ten-axis model is better at surfacing implementation problems on the floor. Neither transfers cleanly to a Japanese manufacturer’s Thai site, though. The products and services axis sits outside the site’s authority when product specifications are decided at head office in Japan, and the CMMS maturity item in the ten-axis model just produces a row of zeros at a plant that has no maintenance system yet, which tells you nothing you can act on.
So at TOMAS TECH we recommend assessing against six axes that re-cut those two families for practical use. We refer to them below as the six practical axes. Some of the names overlap with the six-axis model above, but the contents have been rebuilt around what actually needs checking at a local site.
Axis 1 — Strategy and governance
Is the objective of automation documented as a numerical target, and are the responsible owner and the approval route defined?
“Responding to the labour shortage” is background, not an objective. Which process, which task, how many labour hours removed, by when. If you can write that down, the options narrow later on. If you cannot, the requirement specification diverges at the equipment selection stage and you end up with quotations from several vendors that cannot be compared with each other.
The other thing that matters here is whether the person driving automation changes from project to project. When ownership rotates by project, the lessons from last time are never handed on. Plants that repeat the same mistake on a different line usually score low on this axis.
Axis 2 — Process standardisation on the floor
Is the work procedure for the target process documented, and is it actually followed? Are changeover times and steps measured?
This is the axis that most determines whether automation succeeds. Equipment only ever runs to the procedure. Automate a process where the written procedure and the real work have drifted apart and that gap resurfaces, in full, as exception handling.
Score this one strictly. Full marks is not “we have a procedure document.” Full marks is “the procedure document matches the actual work, and the revision history is traceable.”
Axis 3 — Equipment and instrumentation
Can signals be taken out of the target equipment? Are running, stopped, and changeover states recorded automatically?
There are several ways to retrofit signal extraction onto existing machines. Borrow a contact from the control panel, read from a communication port, add an external sensor, infer running state from current draw. Which of these works differs machine by machine, and if you do not survey that in advance, the project stalls halfway through with “we can’t get data out of this machine.”
Recording production on a handwritten daily sheet is a zero. Handwritten records are too coarse in time resolution, and the reasons for stoppages get written from memory after the fact, so they cannot serve as a starting point for improvement.
Axis 4 — Data and connectivity
Is there a shop-floor network, and do you know how far it reaches? Can the collected data be viewed in one place?
Plenty of plants have a well-built office LAN and nothing on the production side. With no network diagram, and no idea which switch has a free port, the cabling cost balloons unexpectedly later.
Managing each machine from its own separate PC and moving data around on USB sticks is also a zero. When data is scattered, cross-process analysis is impossible, and it cannot be used to verify the effect of automation either.
Axis 5 — People and organisational capability
Is there anyone in-house who can carry out maintenance or simple modifications? Is there a mechanism that makes changes stick on the floor?
At a Thai site, this axis sets the practical ceiling. If everything is left to the vendor, even a small defect means waiting for a visit, and utilisation never climbs. Conversely, sites where local engineers handle first response and minor program adjustments run noticeably higher utilisation on identical equipment.
The sticking mechanism is worth checking too. A plant whose staff can recall an installation that quietly reverted to the old manual method after a while has not built training and adoption checks into its project process.
Axis 6 — Investment and payback management
Are the effects of automation projects measured after installation? Does the cost view include maintenance, consumables, and the loss from downtime?
The most common pattern by far is an estimate produced for the approval request and then never revisited. Break that habit, compare measured before-and-after figures, and feed the result into the assumptions for the next project. Whether that loop exists changes the accuracy of the second and subsequent projects completely.
The same applies to how you view cost. Compare on initial price alone and you will systematically underrate the true cost of machines that consume a lot of consumables, or that require a maintenance contract. Lining candidates up on a total cost of ownership over about five years is the practical approach.
Locating yourself on the maturity levels
Once you have scored the current state on the axes, the next step is to translate that into a stage. A report on a webinar held by THAIBIZ and Lib Consulting on 10 July 2024 organises the smart factory journey into the following five levels.
- Level 1 — Data collection. Numbers can be obtained from equipment and processes.
- Level 2 — Visualisation. Those numbers can be seen by the people who need them, at the time they need them.
- Level 3 — Analysis and control. Causes can be identified from the numbers, and conditions adjusted to change the result.
- Level 4 — Optimisation. The best overall conditions can be selected across multiple processes or lines.
- Level 5 — Automation. The system selects and executes conditions without human judgement in the loop.
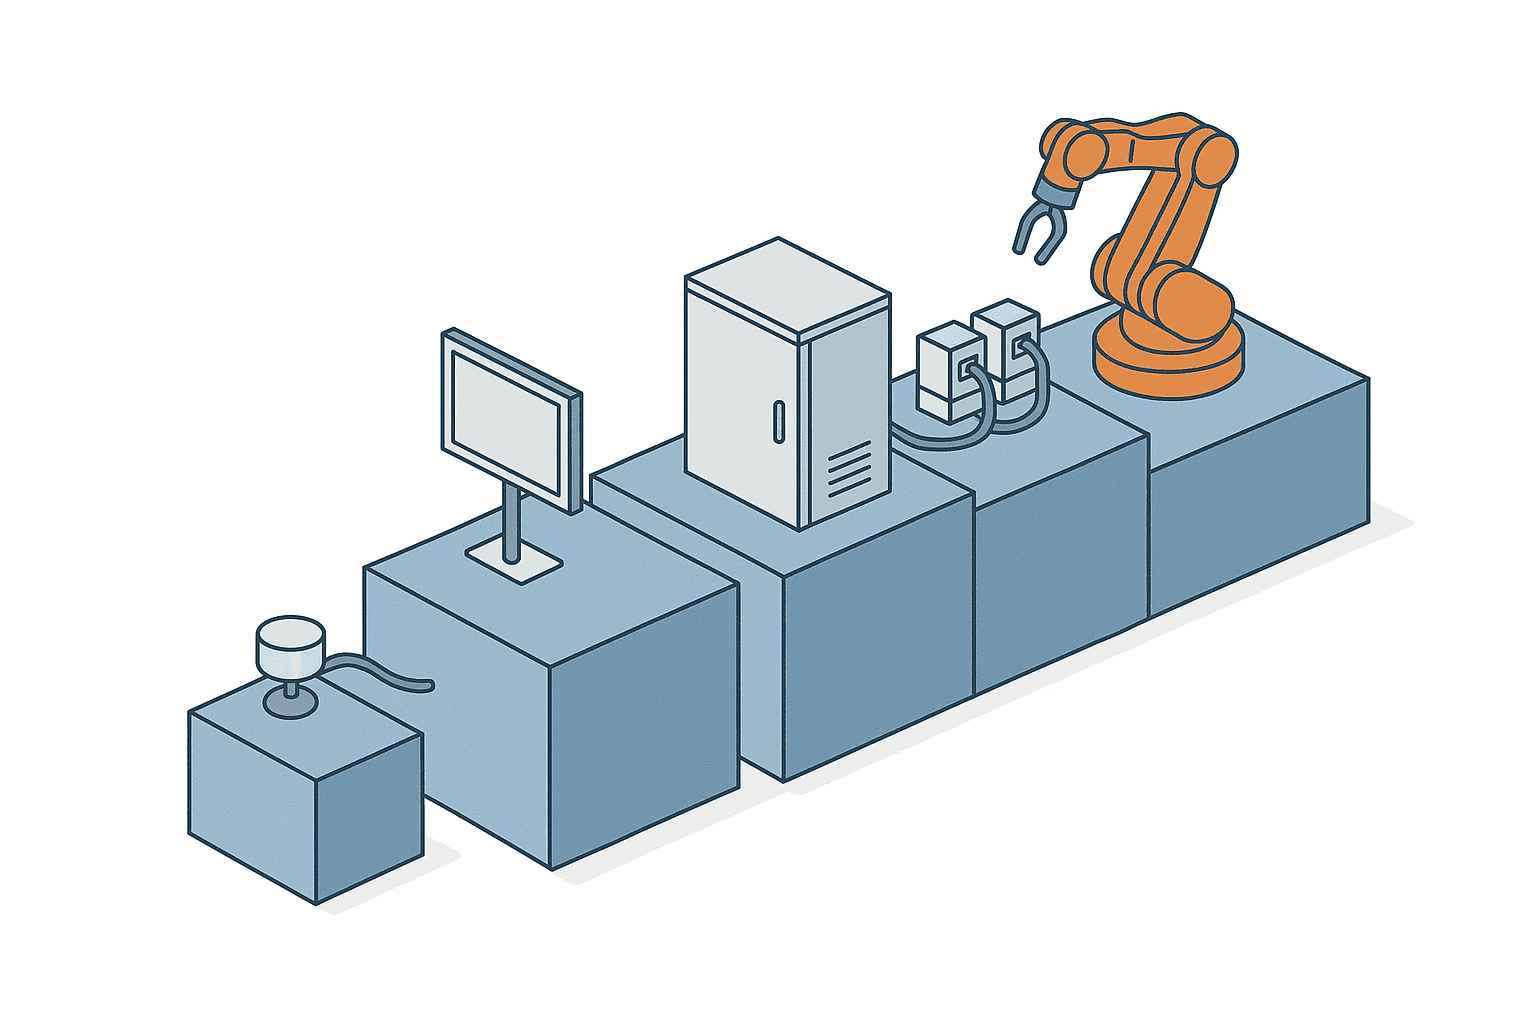
In practice it helps to place a Level 0 in front of these when assessing. That is the state where there is still no means of capturing data and records stop at a handwritten daily sheet. As noted above, maturity is generally measured on a 0-to-5 or 1-to-5 range, so adding a zero is not an odd thing to do as a framework.
Seventy percent of Thai plants say Level 3 is far enough
The striking part of that webinar report is not the level definitions themselves but how they are received. According to the report, at plants in Thailand the proportion answering that “up to Level 3 is enough” reaches seventy percent. That figure comes from research and reporting as of July 2024.
In other words, capture numbers on the floor, make them visible, identify causes, and adjust conditions. Reach that far and, for many plants, the objective has been met. The majority view locally is that Level 5, with every process unmanned, does not justify its capital cost and its running cost.
That feeds straight back into how an assessment should be designed. The purpose of the assessment is not to measure the distance to Level 5. It is to decide the destination that is appropriate for your own plant. Set the destination too high and the investment plan needed to reach it becomes unrealistic, with the result that you never take even the first step.
An unambitious assessment makes the investment decision realistic
When an assessment shows that you are not yet at Level 1, drawing up a plan that targets Level 4 sends initial investment through the roof, because you now need an integration platform, analytics tooling, and instrumentation across several lines all at once.
Decide instead that the goal is “Level 2 for now,” and the scope narrows to instrumenting one line and consolidating its data. The investment figure changes by an order of magnitude, and the period needed to verify the effect gets shorter. The measured values obtained at Level 2 then become the evidence for deciding whether to move on to Level 3.
Refusing to skip stages is not excessive caution. It is following the order that gets you the information the next decision requires at the lowest possible cost.
The self-assessment checklist
The checklist below turns the six practical axes into something you can score directly. Rate each item on a four-step scale of 0, 1, 2, or 3 points. Only the 0-point and 3-point states are defined, so for anything in between, judge by which end it sits closer to.
First, the three axes of strategy and governance, process standardisation, and equipment and instrumentation.
| Axis | Check item | 0-point state | 3-point state |
|---|---|---|---|
| Strategy and governance | Is the objective of automation documented as a numerical target | The objective stops at “responding to the labour shortage” with no success criteria | Target process, labour hours to be removed, and deadline are documented and shared |
| Strategy and governance | Are the responsible owner and the approval route defined | Ownership changes by project and lessons do not carry over | There is a standing owner and an annual budget allocation |
| Process standardisation | Is the work procedure documented and actually followed | No procedure document, or one that differs from the real work | The document matches the real work and the revision history is traceable |
| Process standardisation | Are changeover times and steps measured | Only a rough feel, along the lines of “about 30 minutes” | Measured values exist and the spread is known |
| Equipment and instrumentation | Can signals be taken out of the target equipment | No output available, and no investigation into whether modification is feasible | Running state can be obtained from existing contacts or communication |
| Equipment and instrumentation | Are running, stopped, and changeover states recorded automatically | Recorded by hand on a daily sheet | Captured automatically from the machine and stored with timestamps |
The three axes above are broadly about whether you are in a position to start automating. The remaining three are about whether you are in a position to keep automating. Within the same plant, it is common to find the first half scoring high and the second half low.
| Axis | Check item | 0-point state | 3-point state |
|---|---|---|---|
| Data and connectivity | Is there a shop-floor network with a known reach | Office LAN only, nothing built on the production side | A network diagram for the floor exists and free ports are known |
| Data and connectivity | Can the collected data be viewed in one place | Each machine managed on its own PC with USB sticks | Consolidated on a shared platform that people outside the team can view |
| People and organisational capability | Is there anyone in-house who can maintain or make simple modifications | Everything is left to the vendor and you wait for a visit | Local engineers handle first response and minor modifications |
| People and organisational capability | Is there a mechanism that makes changes stick | Past installations quietly reverted to the old manual method | Training and an adoption check are built into the project process |
| Investment and payback management | Are the effects measured after installation | Only the estimate at approval time, with no follow-up on actuals | Before-and-after measurements are compared and fed into the next project |
| Investment and payback management | Does the cost view include maintenance, consumables, and downtime loss | Machines compared on initial price alone | Compared on total cost of ownership over about five years |
Scoring all twelve items gives a maximum of 36 points. To read your position from the total, use the correspondence below.
| Total score | Approximate position | What to do next |
|---|---|---|
| 0 to 8 | Level 0 to Level 1 | Invest in instrumentation and work standards before automating any individual machine |
| 9 to 17 | Level 2 | Narrow the scope to one line, complete visualisation, and identify the top causes of downtime |
| 18 to 26 | Level 3 | Implement exactly one automation project against an identified downtime cause and measure the effect |
| 27 to 36 | Level 4 and above | Roll out horizontally across lines and optimise. Standardise the investment decision framework |
Two things to watch when scoring
Do not let one person score alone. On the same item, the manufacturing department and the engineering department can land two points apart. That gap is itself an assessment result. Any item where perceptions are not aligned will resurface as a mismatch in the requirement specification at the equipment selection stage, without fail.
Second, score one target process rather than the plant as a whole. Averaged across the site, good processes and bad processes cancel out, the score drifts to the middle, and it stops being useful. Pick the one process you want to automate next and score that.
Turning the assessment into an investment decision
An assessment does not end when the score comes out. Translating the score into an investment decision is part of the assessment. Data on how much the presence or absence of a prior assessment changes the outcome is useful here.
According to the Capgemini Research Institute’s Smart Factories Report 2025, manufacturers that carried out a structured AI and automation readiness assessment before implementation had fifty percent fewer pilot failures and reached scale thirty-five percent faster than companies that did not.
The asymmetry between assessment cost and transformation cost
The comparison of figures presented in the same report is instructive for thinking about where an assessment sits.
| Item | Indicative amount | Framing in the source |
|---|---|---|
| Prior readiness assessment | EUR 15,000 to 25,000 | The level of assessment investment incurred where an assessment was carried out |
| Transformation programme run without an assessment | EUR 200,000 to 2,000,000 | The scale that can arise when a transformation programme proceeds without an assessment |
| Avoided pilot failure cost | EUR 150,000 to 300,000 | The average for companies that detected the gap between OT and IT in advance |
What stands out is that the cost of the assessment and the amount lost in a failure are an order of magnitude apart. A prior assessment comes in at EUR 15,000 to 25,000, while the pilot failure cost avoided by companies that found the OT-IT gap beforehand averaged EUR 150,000 to 300,000. The money that can disappear into a failure is roughly ten times the cost of the assessment. That asymmetry is the argument for treating a prior assessment as insurance rather than as an extra step.
The gap between OT and IT, incidentally, refers to a mismatch between the control systems on the floor and the information systems side over the assumed granularity of data, its update frequency, and the boundary of responsibility. In terms of the assessment axes it sits on the border between the equipment and instrumentation axis and the data and connectivity axis, which is exactly the territory that gets missed when the two are scored separately. When you run the assessment, deliberately check that those two axes are consistent with each other.
How to think about the payback period
When estimating the payback on automation, stacking up only the labour hours removed drifts away from reality. Using what the assessment gave you, it is more realistic to split the effect into three parts.
- Reduction in labour cost. The hours in the target task, and whether those hours actually transfer to other value-adding work. If the task disappears but headcount allocation does not change, the effect does not appear in the books.
- Reduction in downtime. How much operating time increases once visualisation has identified the causes of stoppages. The plants that scored “handwritten operating records” in the assessment are the ones with the most headroom hidden here.
- Reduction in quality defects. The defect rate and the loss per defect. Include not only rework hours and material cost but also the impact when the defect is found at a later process.
Of these three, usually only one is quantified before the assessment. The rest sit in the state of “we won’t know until we can see it.” That is precisely why the rational order is to weight the first investment towards visualisation and to set the size of the next investment using the measured values it produces.
For concrete capital investment including robot deployment, the method for calculating the payback period and the cost items that are easiest to overlook are covered in detail in our article on robot deployment cost effectiveness. Refer to it at the estimation stage, once the assessment has narrowed the target process.
The next step — how to plan factory automation
Once the assessment result is in, the way forward reduces to a sequence of assess, prioritise, and start small.

Step 1 — Identify the constraining axis, not the lowest one
Looking at the scores, the temptation is to start with the lowest axis. What deserves priority, though, is not the axis with the lowest score but the axis that is blocking the next step.
Investment and payback management scoring zero, for instance, is not fatal at the stage of implementing your first project. Equipment and instrumentation scoring zero, on the other hand, means you cannot measure the effect at all, so no investment can be justified. Likewise a process where standardisation scores zero will stop on exception handling no matter what equipment goes in.
In practice, the two axes that most often turn out to be the constraint are the equipment and instrumentation axis and the process standardisation axis. Until those two rise to 2 points or better, deferring large capital investment gets you further, faster.
Step 2 — Narrow to a single target process
Assess process by process, and start process by process. Run several lines in parallel and, when something goes wrong, you cannot isolate the cause, so everything stops.
There are three criteria for narrowing down. Is it the constraint on the line? Can the effect be measured numerically? If it fails, can you revert without stopping production? A process that meets all three is a good first target. The third is more important than it looks, because keeping a configuration you can switch back to manual operation lowers the psychological barrier during commissioning.
Step 3 — Start small and use the measured values for the next decision
Keep the first project small in cost and short in duration. The goal is not to maximise the effect. It is to verify whether your own assumptions were correct.
The assumptions worth verifying look like this. Did the labour hours you expected to remove actually come out? Were the top causes of downtime what you thought they were? Did the local engineers cope with maintenance? Did the period from installation to stable operation match the plan?
Once those measured values are in hand, the accuracy of the approval request for the second project rises. The thirty-five percent faster time to scale in the Capgemini figures quoted above is, in part, the difference between having done that assumption checking beforehand and not.
Step 4 — Bring in outside eyes where self-assessment runs out
Self-assessment has a structural limit. Practices that have become normal inside your own company are not recognised as things to be scored at all. A procedure you think of as “just how it’s done here” turning out to be something other companies automated long ago is a frequent occurrence.
The equipment and instrumentation axis also involves a technical judgement about whether signals can genuinely be pulled from existing machines. That part cannot be settled without looking at both the drawings and the physical equipment.
Getting a rough fix on your position through self-assessment, then asking outsiders to confirm only the items you cannot judge, gives the best balance of cost and accuracy. How to use consulting and hands-on support beyond the assessment, including how to divide up the scope of what you outsource, is covered in our guide to using automation consulting in 2026.
Assessment points specific to plants in Thailand
For a Japanese manufacturer with a site in Thailand, local conditions need to be added to the six axes above.
Build the timing of BOI incentives into the assessment
On 15 January 2026 the Thailand Board of Investment announced a renewed set of investment incentives that includes a “Smart and Sustainable Industry” category. It strengthens tax privileges across advanced manufacturing and automation, EV and mobility, and high-value R&D.
That “Smart and Sustainable Industry” category covers equipment upgrades, energy saving, renewable energy, adoption of digital technology, and the introduction of automation and robotics into production. Applications in this category in the first half of 2026 numbered 132, with total investment of THB 17.158 billion. Those figures come from reporting dated 23 July 2026.
The point to be careful about here is the scope of the numbers. A separate figure of 1,300 projects and more than 82,000 jobs created has been reported for BOI approvals, but that is not limited to the automation category; it is the total across all categories. Quote the 1,300 figure to convey the scale of automation investment and you are out by an order of magnitude on project count. When you prepare internal material, always state which scope a number belongs to.
In assessment practice, overlay the incentive requirements onto the timing of the investment plan. Which equipment categories qualify, when applications must be filed, how long the required documentation takes to prepare. These are conditions to confirm before equipment selection, because noticing them afterwards means the same machine goes in without the privilege attached.
Securing local engineers sets the ceiling on the result
The people and organisational capability axis described earlier carries particular weight at a Thai site. At a plant in Japan you can generally assume a certain number of people with equipment maintenance experience already on staff. At an overseas site that is not guaranteed.
What the assessment should check is not headcount but the division of roles. Who does the first-line triage when a fault occurs? Is there someone in-house who can change the control program, or is it always a vendor call? Who manages spare parts, and who decides when to order? Push ahead with automation without those three settled and every hour the equipment is down becomes production lost.
Recruitment and training take time. Which is exactly why, if the assessment shows the people axis is low, you can decide to align the timing of equipment installation with the readiness of the team. That option only exists because the assessment came first.
Judging when to switch from labour-intensive to automated
Thailand is a market where the shift from labour-intensive production to automation is under way. An SVRC report, citing IFR World Robotics data, puts Thailand’s robot density at 74 units per 10,000 workers, the highest level in mainland Southeast Asia. The figure is described as reflecting the depth of an automation base built around the automotive industry.
There are two ways to read that number. One is that a certain population of suppliers and integrators capable of supporting automation exists locally. Procuring equipment and outsourcing maintenance are both more practical options here than bringing everything from Japan.
The other is that the number is a national average. As the source itself notes, the high density reflects a concentration centred on the automotive industry, and it does not necessarily represent the reality in other sectors. Inferring what is normal for automation in your own industry from a national average figure is best avoided. In the assessment, score the actual state of your own processes rather than the situation at other companies in your sector.
When judging the timing of the switch, the basic method is to line up the rate of increase in labour costs against the payback period of the equipment. Add recruitment difficulty and retention rate to the assessment items as well. Even where labour cost is unchanged, a process for which you cannot hire the headcount you need has, in practice, no option other than automation.
Frequently asked questions
What does a factory automation assessment involve?
It is the work of scoring your own current state across several axes before selecting equipment, in order to set the priority of which process to tackle first. This article set out a method for scoring on six axes, namely strategy and governance, process standardisation, equipment and instrumentation, data and connectivity, people and organisational capability, and investment and payback management. What is assessed is not the equipment itself but the surrounding conditions that keep it running.
How much does an assessment cost and how long does it take?
For a self-assessment, the checklist in this article can be scored in about half a day to a day per target process. As a benchmark for commissioning it externally, the Capgemini Research Institute’s Smart Factories Report 2025 puts investment in a prior readiness assessment at around EUR 15,000 to 25,000. The same report indicates that proceeding to a transformation programme without an assessment can run to EUR 200,000 to 2,000,000, so the assessment cost is more than an order of magnitude smaller than the transformation cost. Actual cost varies with the scope of the assessment and the number of machines involved, so treat these as indicative.
Can we do the assessment ourselves, or should we commission it?
You can do the first pass yourselves. The checklist in this article is set up so that it can be scored internally as it stands.
At the same time, practices that have become normal inside your own company tend not to be recognised as scoreable at all, and the technical judgement about whether signals can genuinely be pulled from existing machines cannot be settled without seeing the drawings and the physical equipment. Grasping the overall picture through self-assessment and then asking an outside party to confirm only the items you cannot judge is realistic on both cost and accuracy.
If the assessment shows a low level, should we give up on automation?
There is no need to. Take the opposite view, that you have obtained the information that stops you from committing to advanced automation while your level is low.
There is also a report that at plants in Thailand the proportion answering “up to Level 3 is enough” reaches seventy percent. Without aiming to remove people from every process, reaching the stage where you capture numbers, make them visible, identify causes, and adjust conditions is enough for many plants to meet their objective. Once the assessment has told you where you stand, setting the target one level above that and starting with a single target process is the shortest route forward.
Summary
A factory automation assessment is the work of scoring your current state before selecting equipment, so that you can decide the order in which to start. What is assessed is not the performance of the equipment but the conditions that keep it running, namely the six axes of strategy, procedure, instrumentation, data, people, and investment management.
Maturity can be viewed on a range from 0 to 5, but there is no obligation to set your goal at the top. There is a report that seventy percent of plants in Thailand answer that Level 3 is far enough, and deciding a destination that fits your actual size is what makes a plan realistic.
When you carry the assessment result through to an investment decision, the thing to remember is the asymmetry in cost. A prior assessment is on the scale of EUR 15,000 to 25,000, whereas a transformation programme run without one is reported as potentially reaching EUR 200,000 to 2,000,000, and companies that carried out a prior assessment were reported to have fifty percent fewer pilot failures and to reach scale thirty-five percent faster.
The next step, then, is to identify the constraining axis, narrow to a single target process, start small, and obtain measured values. At a site in Thailand, add the requirements and timing of BOI incentives, and the division of roles among local engineers, to the assessment items before you select any equipment.
Where your own plant sits, and which process you should tackle first, often turns out differently from what you assumed once you actually score it. TOMAS TECH has worked on the ground in Thailand with both the production equipment and the factory systems of Japanese manufacturers. Even if you are nowhere near a decision to install anything, and simply want help reading your checklist score or working out which axis to address first, feel free to get in touch and we can take it from the earliest stage of the assessment.
References
- Smart Manufacturing Readiness Assessment Checklist – Oxmaint
- Industry 4.0 Readiness Checklist 2026 – iFactory
- Manufacturing AI Readiness Assessment – Thinking Inc., citing Capgemini Research Institute, Smart Factories Report 2025
- Smart Factory Webinar Report – THAIBIZ / Lib Consulting
- Thailand’s Renewed BOI Incentives – Alvarez & Marsal
- BOI Smart and Sustainable Industry applications in H1 2026 – The Nation Thailand
- Robotics Market in Asia – SVRC, citing IFR World Robotics data


