


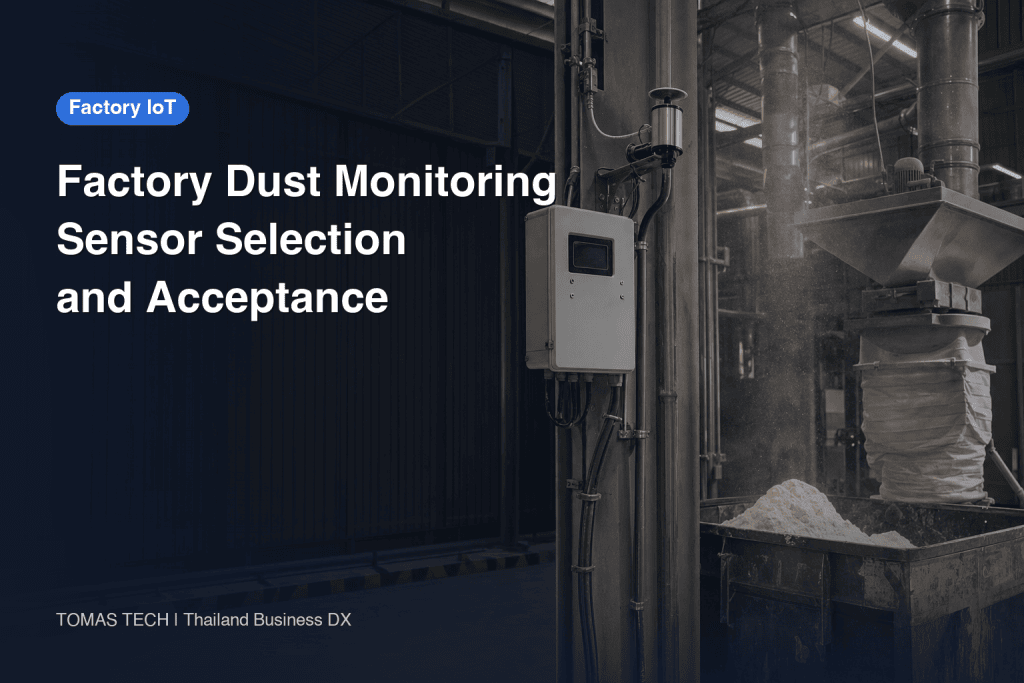
When implementing a factory airborne dust monitoring system, the first decision is not the sensor price. It is which air to measure, at which process, so that which person can act sooner. A request to see the time pattern of dust released during cutting, grinding, powder charging, bagging or cleaning overlaps with a request to assess workers’ exposure, but the two are not identical. For manufacturing sites in Thailand and ASEAN, this guide connects the measurement objective, sensor placement, optical instrument limitations, comparison with reference sampling, alarms, maintenance, procurement and acceptance tests. Assess substance-specific health risks and applicable legal duties with qualified local professionals.
Define what factory airborne dust monitoring will measure
The phrase “too much dust” may refer to air inside a dust collector, pressure loss across its filter, particles suspended in a work area, or the air a worker may inhale. These require different measurement positions and instruments. Differential pressure across a collector filter is a useful signal of filter or flow-path condition. Yet dust can escape a hood, a worker’s position can change, or cleaning can resuspend material while filter pressure remains in its normal band. The reverse is also possible: a pressure change need not produce a proportional change in work-area concentration. This article concerns time- and location-specific airborne dust in the occupied work area. Treat filter pressure as a separate signal to compare, rather than as a substitute. Our dust-collector differential-pressure guide addresses that equipment signal in detail.
Dust itself is not a single substance. Material, particle size and shape, chemical composition, and heating during processing can change the appropriate size fraction and sampling method. ISO 7708 defines inhalable, thoracic and respirable sampling conventions relevant to health assessment, but the fraction needed depends on the material and the purpose of the assessment. Installing an inexpensive indoor “PM2.5” sensor does not complete an assessment of inhalable or respirable workplace dust. The specification must say whether the display represents particle count or estimated mass, what size range is measured, and how the inlet and any size selector are configured.
Separate fixed-location area monitoring from personal exposure assessment. A fixed instrument can compare processes, identify unusual events and follow trends before and after controls. It cannot always represent the breathing zone of a worker who moves, leans into a source, or changes tasks. NIOSH describes how direct-reading instruments provide time-series information and can support intervention and alarms, while also emphasizing appropriate selection and interpretation. State each objective separately in the requirements: trend monitoring, source finding, control verification, or personal exposure assessment.
Define success as an action on the floor
What changes when a graph rises? A peak just after bagging starts may prompt checks of the bag mouth, extraction hood, charging speed, lid and cleaning method. A rise during a break may prompt a review of ventilation schedules, forklift movement or compressed-air cleaning. Colouring a dashboard does not change a process. Success means a timestamp can be matched to work records, a named person checks the area, records the cause, applies a correction and measures again under comparable conditions. Formal exposure or compliance decisions need a sampling and analytical method designed for that purpose.
Select measurement points from the layout and worker movement
Mark sources, standing positions, worker routes, exhaust hoods, make-up air, doors, forklift paths, walls and ceiling fans on a floor plan. Record which actions release dust and when they occur: opening a sack, starting a cut, blowing off a part or changing a collector bin. A daily average can hide a short task. Choosing a permanent point solely because an outlet is available measures convenient air. Observe airflow and use temporary mobile measurements first, then choose the permanent points.
Give candidate points different jobs: one near the source to detect change, one in an occupied area, and one away from the process to establish background. Their values need not be equal; the differences are informative. An inlet directly in a machine discharge jet may register extreme moments that misrepresent the wider area. An inlet high above the work or inside a closed cabinet may miss relevant variation. Set the inlet height and direction in view of the objective, airflow and instrument sampling requirements, and record the decision with drawings and photographs.
Placement must survive operational change. Stacked materials, new partitions, a different production rate or seasonal fan use can redirect air. A documented reason for each point makes later reassessment possible. Confirm power, communications, safe cleaning access, protection against a blocked inlet, water ingress, vibration and temperature/humidity conditions at every point. Radio coverage alone does not prove continuous logging. Include a field network survey and a power-loss and reconnection test.

Do not use a fixed point as a proxy for every worker
A person passing a grinding table, lifting a powder sack or leaning toward a hood may breathe different air despite sharing a room. A fixed point may show no peak while a short personal task is elevated; it may show a peak when nobody is present. Align work observations with sensor timestamps and plan personal sampling or specialist investigation for tasks that need it. Do not label an area-sensor value “employee exposure concentration.” Keep area points, process events and personal sampling results separate on screen and in the data model.

What optical real-time dust monitors can and cannot do
Many direct-reading optical instruments use light scattered by airborne particles to provide short-interval readings. They help identify when a task produces dust and whether controls change the trend. Their output also depends on the instrument principle, particle size, shape, refractive index and density, humidity, and losses in the sampling line. A NIOSH review of occupational aerosol instruments notes that understanding selection, operating principles and data analysis is essential. EPA guidance explains that a sensor’s bias may change with particle type, size and environmental conditions. EPA’s guide primarily addresses general air sensors; it is not an occupational instrument certification. The transferable principle is to interpret a sensor in its deployment conditions against an appropriate reference method.
The same displayed number may mean different things when the process changes. Metal grinding dust, polymer swarf, dry powder, damp powder, fume and mist scatter light differently. A catalogue “measurement range” does not resolve that. Ask bidders to specify the measurement principle, size range, expected materials, temperature/humidity envelope, response time, logging interval, missing-data behavior and maintenance parts. Where a particular chemical constituent matters, select a suitable analysis separately. One optical channel does not identify chemical composition.
A short spike is not automatically a failed control. Clothing may resuspend material near the instrument, cleaning may briefly lift settled dust, or a droplet may affect the inlet. Retain raw time resolution and compare it with task, airflow, ventilation and instrument-status logs. Keeping only a smoothed average can erase the cause; showing only instantaneous values can train staff to ignore alarms. Keep both.
Calibration, collocation and correction are different tasks
The maker’s zero check and calibration verify instrument condition. Collocation compares the sensor response with an appropriate reference instrument or sampling method at the same place and time using the site’s dust. Field correction manages how measured differences affect interpretation or conversion. The phrase “calibrated” does not explain which of these has been done. EPA describes collocation as a way to understand sensor performance under real conditions. An optical monitor estimates mass concentration from scattered light. By contrast, weighing the selected particle-size fraction collected on a filter and dividing the mass gain by the sampled air volume yields an integrated gravimetric mass concentration for comparison. Match the size fraction, inlet location and sampling period when comparing the two. For a workplace, choose a reference method that fits the substance and purpose with the occupational hygiene lead, and compare during representative materials, humidity and operating states.
Record serial numbers, inlet positions, time window, process, running equipment, temperature/humidity, sampling method, reference result, raw sensor value, corrected value and correction-model version. A convenient one-day correlation should not be extended unquestioningly to every process. A material change, sensor replacement, relocation or changed response after cleaning should trigger review. The reference result may take time, but it does not remove the value of the live trace: the trace answers *when*, and the comparison helps answer *what the number means*.
Design alarms as operating rules, not a single threshold
A solitary alarm number often either sounds so often that it is ignored or rarely sounds and misses events. Define an alarm as a combination of reading, duration, point, equipment state, recipient, first check and escalation. At a bagging point, the first checks might be inlet contamination and task timing, followed by hood position, collector operation, bag seal and cleaning method. A falling reading does not close the case automatically; record the cause and action.
There is no universal alarm number. Its meaning depends on the substance, method, validity of any correction, process pattern, applicable criteria and management purpose. During a pilot, review normal running, start-up, cleaning and shutdown separately and agree which changes need action. Label a provisional process alarm for what it is. Do not present it as a legal exposure limit. Formal compliance assessment follows its own measurement plan.
Distinguish instrument failure from high dust. Reduced sample flow, blocked inlet, lost communication, clock error, power loss and an out-of-range reading do not mean the air is clean. Plotting “missing” as zero can falsely make a failed system look effective. Keep an audit trail of muted alarms, maintenance mode, acknowledgment and open cases across shift handovers. Where appropriate, store readings locally and test buffered retransmission and duplicate removal after a connection returns.
Connect the signal to cleaning, ventilation and process changes
The answer to an alarm is not necessarily turning up a fan. Source capture, enclosure, material handling, cleaning practices and collector maintenance may matter more. OSHA’s combustible-dust material emphasizes capture, containment and housekeeping, but combustibility and explosion risk depend on the material and process. An optical area monitor cannot determine explosion risk. Obtain a separate specialist assessment where applicable. Give each alarm and countermeasure a case number and feed the result back into work instructions and maintenance records.
Architecture of a factory dust monitoring system
The basic chain is sampling instrument, timestamped collection, storage, display, notification and maintenance register. The handoffs between these layers determine usefulness. If a sensor logs every minute but the gateway delivers an hour late, it cannot support a timely alarm. Decide which alarms run locally and which analyses run centrally when communications fail. Feeding area-monitor values back to a PLC to change equipment control requires a separate process-safety design and change approval; it is not an incidental dashboard feature.
Store more than a measured number: timestamp and time zone, point and instrument IDs, unit, status, raw/corrected/averaged value type, correction version, material and process event, and reason for missing data. For multiple sites, store a consistent time base and display local time. If personal samples are linked to names, set access and retention rules separately and collect no more personal detail than the improvement task needs.
The maintenance register should contain cleaning, flow and zero checks, collocation, parts replacement, software updates, relocation, failure and recovery. Retain actual results, not only scheduled dates. A dusty inlet may need more frequent attention than a generic annual plan allows. Use pilot experience to choose inspection intervals and review them after process changes. Include the maker’s maintenance procedure, warranty, local service scope and spare-part lead time in procurement.
Record the conditions that make trends comparable
When comparing weekly charts, do not compare the vertical-axis values alone. Record output volume, material lot and particle characteristics, line utilisation, exhaust status, doors and make-up-air configuration. A lower daily average may simply reflect half the production volume. Conversely, a new material can change optical response without an equivalent change in actual particle mass. A claim that a control worked should compare like process, workload, airflow, material and instrument condition.
Time alignment matters. If a sensor uses local time, a PLC uses server time and a handwritten shift log uses another clock, a difference of minutes may assign a peak to the wrong task. Set clock synchronisation, time zone and restart behavior at deployment. Record event start and end times and the type of task. Version configuration and correction changes. If old readings are recalculated under a new correction, preserve the original display separately from the recalculated result.
Begin dashboard design by showing units and value types. Particle count, estimated mass and corrected concentration should not look like interchangeable lines. For each point, make instrument model, measurement principle, correction scope and last inspection available. Let the operator move from a high reading to the relevant work record and response history. A monthly report should show event times, identified causes, follow-up measurements and missing-data duration alongside averages. Only then does a trend become an operational record.

What to put in the RFP and bid comparison
Three quotations for “dust sensors” may describe three different projects: fixed monitors only, monitors plus reference work, or a dashboard without response procedure. Give every bidder the same account of objectives, material, process states, candidate points, time resolution, display, alarms, reference work, maintenance, training and acceptance tests. Ask each bidder to state what the system can and cannot claim. “High accuracy” in a brochure is not a field performance specification.
Separate sensor and sampling hardware, installation, power, networking, collection and storage, screen, alerts, initial collocation, periodic maintenance, consumables, calibration, training, local support, data export, relocation and eventual removal. Check what happens to licences and gateway capacity when points are added. Compare first-year cost and ongoing obligations on the same basis. A cheap bid may simply have left out maintenance or comparison. Do not copy a unit cost from an unrelated plant.
Use common evaluation questions. What changes if the material or humidity changes? How are mist and sensor fouling recognised? Where do readings reside during an outage? Who approves a changed correction factor? What exactly does the shift lead do on an alert? Where does the vendor’s responsibility end and the plant’s network team’s begin? Written answers let you compare an operable monitoring service rather than a box price. For the wider retrofit and collection design, see our factory IoT sensor selection guide. Aerosol-specific field comparison is still required.
Use FAT and SAT to accept more than a displayed number
At factory acceptance testing (FAT), test the device and logic with normal readings, out-of-range values, power and network loss, clock drift, sensor failure, maintenance mode, duplicate notifications and buffered recovery. Check units, raw versus average labels, point IDs, permissions and export. A simulated alarm proves the logic runs; it does not prove the instrument measures the plant’s dust accurately. Record each input, expected outcome, actual outcome, assessor and open item.
At site acceptance testing (SAT), compare actual inlet position, orientation, power, networking and cleaning access with the plan. Log representative operations, perform the planned collocation and align the trace with task records. Schedule charging, bagging, cleaning, material changes and stop/start states. Send an alarm to a real recipient and walk through acknowledgment, action and closure. After power and network recovery, confirm missing data remains marked missing, values are not duplicated and clocks remain aligned. Agree acceptance criteria before testing.
Review early operation after handover: which detected changes had an identified cause, suspected false or missed alerts, missing-data duration, maintenance effort and whether repeat measurement followed action. Build baselines at your own site rather than borrowing another plant’s alarm target. Before adding points, ask whether the first points are changing decisions.
Start with one process and expand on evidence
Inventory one process: material, release action, exhaust, worker location, cleaning and existing measurement results. Observe airflow and use temporary measurements and task logs to evaluate candidate points. Install a small set of fixed points with distinct source, occupied-area and background roles. Record start-up, normal running, cleaning and shutdown, not merely steady production. Compare the optical trace against suitable reference sampling and retain both raw and corrected interpretations.
Then trial the alarm-to-action procedure with production, maintenance, health and safety, and IT. Fix alerts that reach nobody or tell nobody what to do. Review the ongoing maintenance and data-checking load before choosing the permanent point count. A small pilot is a strength when each point supports a clear decision and repeat measurement. Repeat the assessment when materials, abrasives, hoods, line layout, cleaning or shifts change. Preserve the point rationale, comparison records, alarm procedure and maintenance history so the next team can understand what each reading means.
Example: deciding whether a bagging pilot succeeded
Imagine a powder bagging line where staff see a white cloud while changing bags, although the collector differential pressure is normal. Adding another pressure gauge will not show where the cloud goes. Log bag fitting, filling, sealing, removal and cleaning; map the operator, hood and incoming air. Move a temporary monitor between the source side and occupied area to compare traces, and consider a background point if another line runs nearby.
If peaks recur only during bag changes, compare timestamps with observations before selecting a remedy. Inspect bag opening, clamp, hood position and whether capture reaches the release point. When needed, sample by an appropriate reference method under the same operating conditions to understand the optical response to this powder. After the modification, compare the same product, throughput and ventilation. A remaining question about the worker’s breathing zone calls for personal sampling, not a conclusion from the wall-mounted trace.
Passing the pilot means more than a lower graph. A named recipient must receive an alert, check the instrument, observe the process, record cause and action, and verify the change by repeat measurement. Decide who will keep cleaning the sensor and organising reference checks, and who notices lost data. If this sequence works, expand to another filler or grinding cell. If it does not, fix the procedure and ownership before adding instruments.
Frequently asked questions
Does a factory airborne dust monitoring system replace personal exposure sampling?
No. Fixed points describe area time trends, not every worker’s moving breathing zone. If personal exposure or legal compliance must be assessed, design a substance- and purpose-specific sampling and analysis plan with a competent professional. Area data can help select the tasks and times to investigate.
Is an optical dust sensor display a direct mass-concentration measurement?
That depends on the instrument. Some report particle count; others estimate mass from scattering; size ranges differ. Material and humidity can change response. Check the principle and display definition, then plan comparison against a suitable method for the site’s dust. A catalogue value alone cannot validate every process.
How many dust sensors should a plant start with?
There is no universal number. Map source, occupied area and background; observe the process and use temporary readings to justify each permanent point. Start with a few points with different roles, verify location and alarm procedure, then add where decisions require it. Floor area alone is a poor placement rule.
How is dust-collector differential pressure different from work-area airborne dust monitoring?
Differential pressure mainly indicates filter or flow-path condition. An area monitor records particles at its own inlet. Neither signal alone determines the other. Comparing both traces against process events helps diagnose an abnormality.
How should alarm values be set?
Define purpose, substance, relationship to reference measurements, normal process variation and an action the site can take. Do not confuse a provisional process alert with a personal exposure or legal evaluation value. Confirm applicable criteria with a specialist, use pilot data and revise after false alerts, suspected misses and process changes.
Summary
A factory airborne dust monitoring system is an operating process, not merely installed hardware. Distinguish area trends from personal exposure, position points around sources and occupied spaces, compare optical readings with a suitable reference method, identify missing data and failures, and link alarms to corrective action. Write measurement meaning and maintenance ownership into the RFP. At FAT and SAT, test outages, abnormal values, task events, comparison evidence and the actual human response. A one-process pilot can establish that the measurement changes a decision before the network is expanded.
TOMAS TECH can help a Thai factory define measurement points, the boundary with its existing OT/IoT systems, and the RFP and acceptance tests while the project is still being scoped. Share the process and the decision you need to improve through our contact page.
Sources
- NIOSH Direct Reading and Sensor Technologies Center
- NIOSH review of direct-reading aerosol instruments
- NIOSH Manual of Analytical Methods, real-time optical aerosol monitors
- US EPA Enhanced Air Sensor Guidebook
- US EPA Air Sensor Collocation Instruction Guide
- ISO 7708 particle size fractions
- OSHA, Protecting Workers from Combustible Dust Explosion Hazards


