


Ask, “Which machines at our Thailand plant had more downtime this month?” or “Show excess inventory and stockout risk together,” and receive an answer in natural language with the underlying query and source. This is the promise of data agent implementation. But producing a convincing demo is not the same as supporting real decisions while enforcing permissions. Before evaluating eloquence, a company must define business meaning, access control, verified questions, auditability, and operating ownership.
This guide is written for manufacturers operating in Thailand and ASEAN. It explains how to decide whether to build or buy a data agent, how the technology differs from BI and RAG, how to prepare a semantic layer, and how to evaluate OEE, yield, downtime, and inventory use cases through a 90-day proof of concept. Pricing and performance vary by contract, region, architecture, and workload, so this article does not invent either.
Executive summary: seven principles for data agent implementation
- Start with one business domain that has a named owner and stable definitions, not an enterprise-wide rollout.
- Define OEE, yield, downtime, and other metrics in a semantic layer; table access alone is not enough.
- Evaluate query-and-answer pairs against verified questions, not the appearance of a general-purpose chat interface.
- Enforce the signed-in user’s permissions and expose zero unauthorized rows or columns.
- Make every answer traceable to its executed query, source, period, and filters.
- Keep the PoC read-only. Any write-back remains a human-approved workflow outside the PoC.
- Never present correlation as root cause. Causal conclusions require appropriate analysis and operational evidence.
TOMAS TECH can help from the earliest stage, including data inventory and creation of a 30-question evaluation set. To compare a managed platform with a custom approach for your Thailand operations, contact us.
What is a data agent? Natural-language BI with governance and evidence
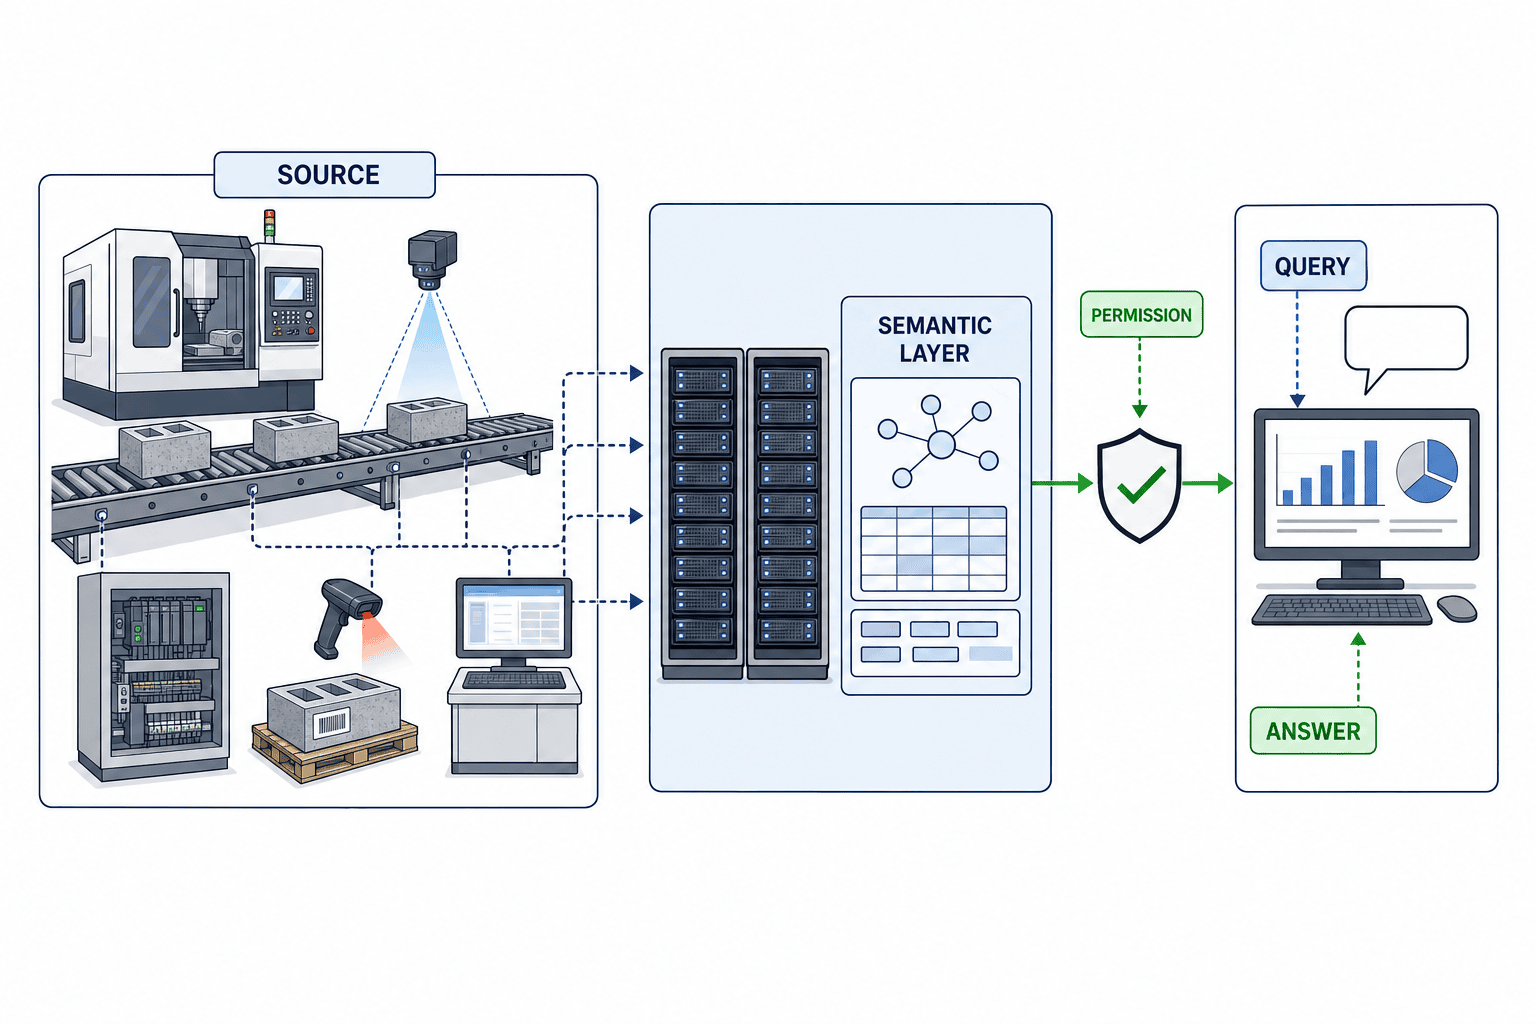
A data agent links a user’s natural-language question to approved enterprise data, business definitions, access permissions, query execution, and visualization. It typically interprets intent, selects an appropriate source, generates and executes SQL, DAX, or KQL, and explains the result. It is therefore broader than a standalone NL2SQL feature.
OpenAI’s September 10, 2026 description of its internal Data agent identifies approved sources, semantic layers and business definitions, permission enforcement, dashboards, and human-approved actions as parts of the system. OpenAI also reports that nearly all of its product team and more than two-thirds of its go-to-market organization use the agent. Those figures describe adoption inside OpenAI; they are not a promise of equivalent adoption or outcomes at another company.
Microsoft’s Fabric Data agent documentation says that the system uses the user’s identity and permissions, supports natural-language access to SQL, DAX, and KQL, and accepts up to five data sources per agent. It also states that causal and root-cause questions are out of scope. Databricks explains that Genie Agents are curated with Unity Catalog datasets, example SQL, expressions, and instructions. Snowflake’s Verified Query Repository stores verified questions and their SQL to improve trustworthiness through human verification. Across these products, the recurring lesson is that a deployable data agent is a combination of model, data, meaning, permissions, and human validation.
Data agent vs. RAG, BI dashboards, and causal analysis
These technologies complement one another, but they answer different questions and fail in different ways.
| System | Primary material | Best suited to | Evidence | Main caution |
|---|---|---|---|---|
| Data agent | Structured data, KPIs, history | “What was OEE by line?” “Which machines had more downtime?” | Query, tables, metric definitions | Joins, aggregation, and time interpretation must be verified |
| General RAG | Procedures, policies, reports | “What is the recovery procedure?” “What requires approval?” | Retrieved documents and citations | Not designed for exact aggregation across relational tables |
| BI dashboard | Predefined recurring metrics | “Show today’s OEE.” “Monitor the monthly trend.” | Governed model and visualization | New questions may require redesign |
| Causal/root-cause analysis | Experiments, time series, process conditions | “Did higher temperature cause defects?” | Statistical design, experiments, causal assumptions | Correlation and narrative do not establish causality |
A data agent may show that night-shift yield is lower. It cannot infer, without additional evidence, that the shift itself caused the difference. Product mix, machine, material lot, working conditions, or missing measurements may be responsible. Design the answer to separate observed differences, potentially associated factors, and the additional evidence needed.
For a broader information architecture, see our practical guide to generative AI for data analysis and enterprise RAG implementation guide. Together, they help separate structured numerical analysis from document retrieval.
Manufacturing use cases: OEE, yield, downtime, and inventory
OEE: expose definition differences instead of hiding them
OEE is commonly expressed as availability multiplied by performance and quality. Yet the result changes depending on whether planned downtime is removed from the denominator, which reference speed is used, and where defects are counted. Two plants may both label a field “OEE” while using different definitions.
For implementation, record the group-standard definition, each plant’s local definition, the formula, source tables, time zone, update frequency, and owner. If definitions cannot be harmonized, show “Group OEE” and “Plant OEE” separately. Do not create a cross-plant ranking from incomparable values.
Yield: distinguish process, product, lot, and rework
First-pass yield, final yield, scrap rate, and acceptance after rework are not interchangeable. The agent must not silently choose one when a user asks, “What was yesterday’s yield?” It should ask a clarifying question, or explicitly show the default definition used.
Downtime: make overlaps and unclassified events visible
PLC events, MES reason codes, and maintenance records may describe the same incident and cause double counting. Before aggregation, define corrections to start/end times, overlap handling, the micro-stop threshold, planned downtime, and the treatment of unclassified reasons. Showing an “unclassified share” next to the top-five reasons helps prevent management from acting on a misleading ranking.
Inventory: separate current position from future risk
ERP on-hand inventory, WMS location stock, work in process, quality hold, open purchase orders, and forecasts update on different schedules. A trustworthy answer states its snapshot time and distinguishes physical stock, available stock, safety stock, and days of inventory. “Will we stock out next week?” is a forecast, not a current-state query, so assumptions about demand and lead time must be explicit.
Why semantic layer AI determines success
A semantic layer translates physical database structures into governed business meaning. It is more than a dictionary of friendly column names. It includes formulas, grain, joins, default filters, units, currencies, time zones, exclusions, permissions, and ownership.
| Definition element | Manufacturing example | Failure if omitted |
|---|---|---|
| Grain | machine × shift × product × day | Event-level and daily tables are joined and double-counted |
| Metric formula | good quantity ÷ input quantity | Rework and re-entry change the answer |
| Time boundary | operating day starts at 07:00 ICT | A night shift is split across dates |
| Unit | kg, piece, THB | Incompatible units are summed |
| Permission | plant, department, cost column | Other plants, personal data, or cost data become visible |
| Freshness | five minutes, hourly, next morning | Old data is mistaken for current data |
| Owner | production engineering, quality, finance | Nobody approves a definition change |
OpenAI explicitly lists semantic layers and business definitions among its Data agent’s connected elements. Databricks describes curating datasets with example SQL, expressions, and instructions. Snowflake’s Verified Query Repository similarly uses human-verified question-and-SQL pairs. The core of quality improvement is therefore not merely a larger model; it is an operating system for maintaining meaning and correct examples.
Natural-language BI permissions: never exceed the user’s access
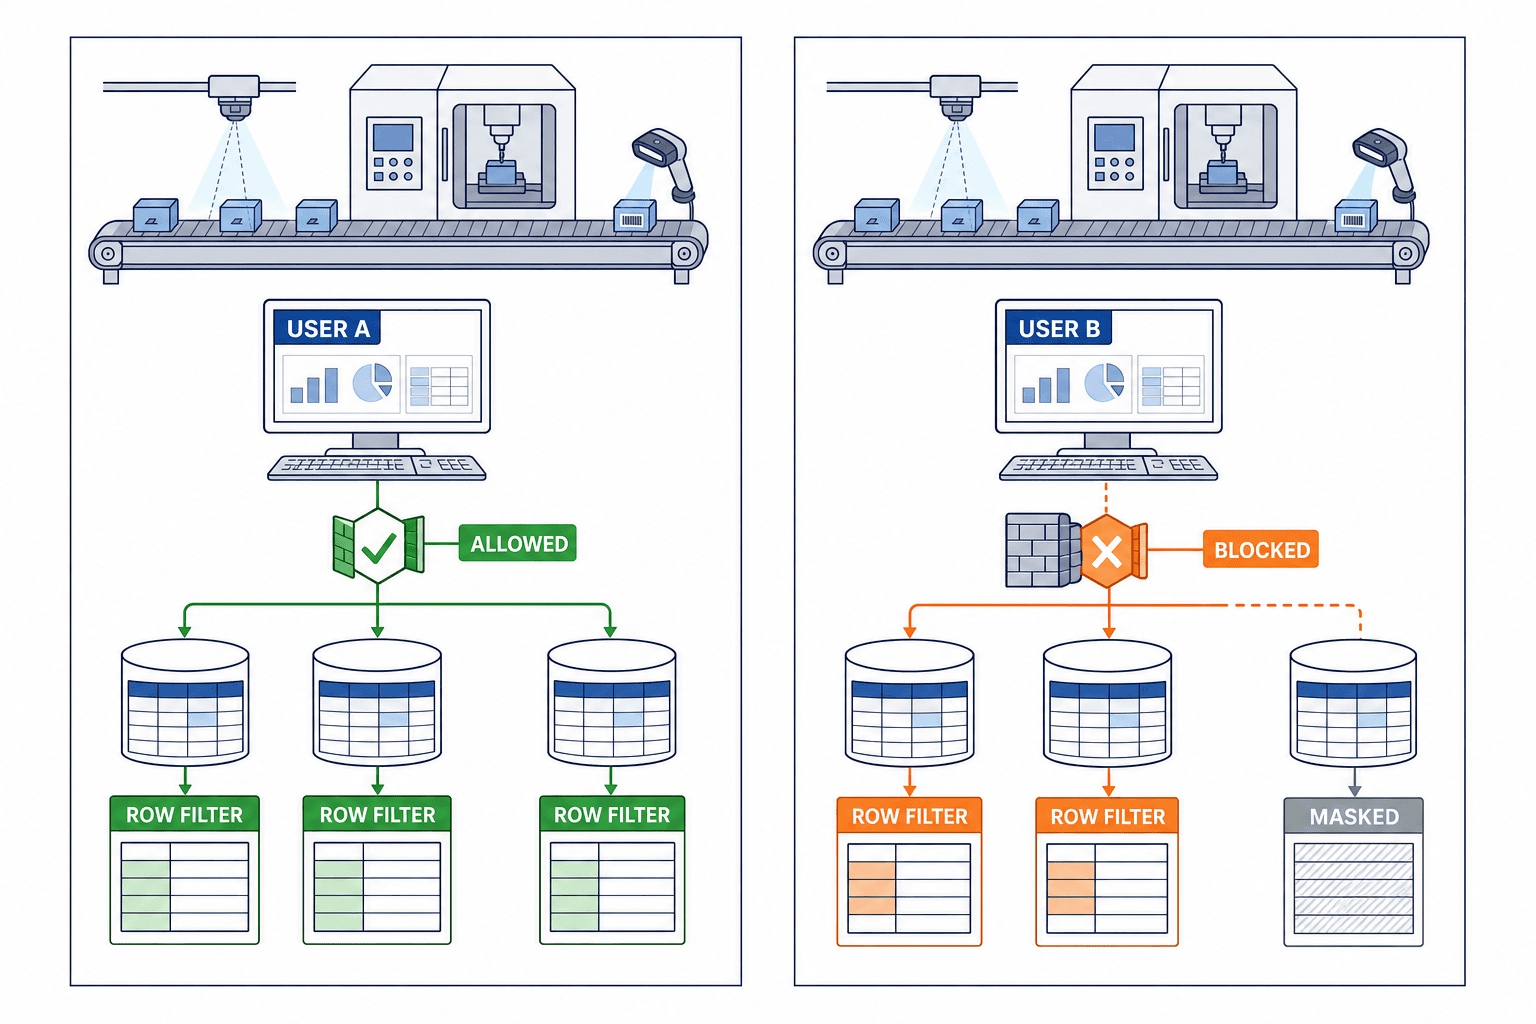
With natural-language access, users may not realize how broad a search has become. A column absent from an ordinary dashboard can still appear in prose if the generated query can read it. A prompt that says “do not reveal confidential data” is not a sufficient security control.
At minimum, enforce the following in the data or authenticated execution layer:
- Identify each user through corporate identity or SSO; do not give a shared service account unrestricted access.
- Apply row-level access for plant, department, customer, and assignment.
- Restrict or mask cost, personal, payroll, and customer-confidential columns.
- Separate development, test, and production; do not copy PoC permissions directly into production.
- Log the question, generated query, user, time, sources, and result count.
- Preserve source permissions in exports and shared links.
- Set query timeouts, row limits, and compute limits.
As Microsoft’s documentation emphasizes user-identity permissions, the agent should act as an assistant within the signed-in user’s access—not as a separate identity that can see everything.
Build or buy an AI agent for data analytics
Build versus buy is rarely a binary decision. A practical architecture often buys platform capabilities such as identity, catalog, execution, and audit, while building company-specific definitions, evaluation questions, approval flows, and user integration.
| Decision factor | Leans buy | Leans build | Evidence to request |
|---|---|---|---|
| Data platform | Most data is consolidated on a supported platform | Multiple databases, on-premises systems, and custom APIs | Connector and network architecture |
| Identity and access | Standard IAM integration fits | Plant/customer permissions are highly specific | Tests with real user roles |
| Business meaning | Standard semantic modeling is sufficient | Complex process logic and exceptions dominate | Definition implementation and versioning |
| User experience | Standard chat and charts are sufficient | MES screens, approvals, or reports require embedding | APIs, SDKs, embedding options |
| Operations | Vendor monitoring is preferred | An internal AI/data team can operate it | Logs, evaluation, incident ownership |
| Residency and regulation | Available region and contract meet requirements | Segmented or specialized deployment is mandatory | Processing, retention, and cross-border terms |
Five things to demand in a vendor demonstration
- Use your anonymized data and ambiguous real questions, not only the vendor’s sample data.
- Show the generated query, source tables, filters, and period—not just the final answer.
- Ask the same question as two users with different permissions and verify different results.
- Test whether the agent refuses nonexistent metrics, impossible joins, and out-of-scope causal questions.
- Show who can edit definitions and verified SQL, in which interface, and with what history.
“Accurate” or “secure” in a product presentation does not mean the product has passed on your data. Before signing, document the evaluation set, logging method, incident responsibilities, and retention terms.
OpenAI’s August 2026 enterprise analysis defines frontier firms as the top 10% by monthly usage and typical firms as those in the 45th–55th percentiles. Frontier firms generated 8.3 times as many output tokens per active user as typical firms. Among weekly active users, Plugin usage was 21% versus 9%, and skills usage was 19% versus 3%. These are adoption-context observations. They do not prove causal ROI from a product or guarantee repeatable results for every organization.
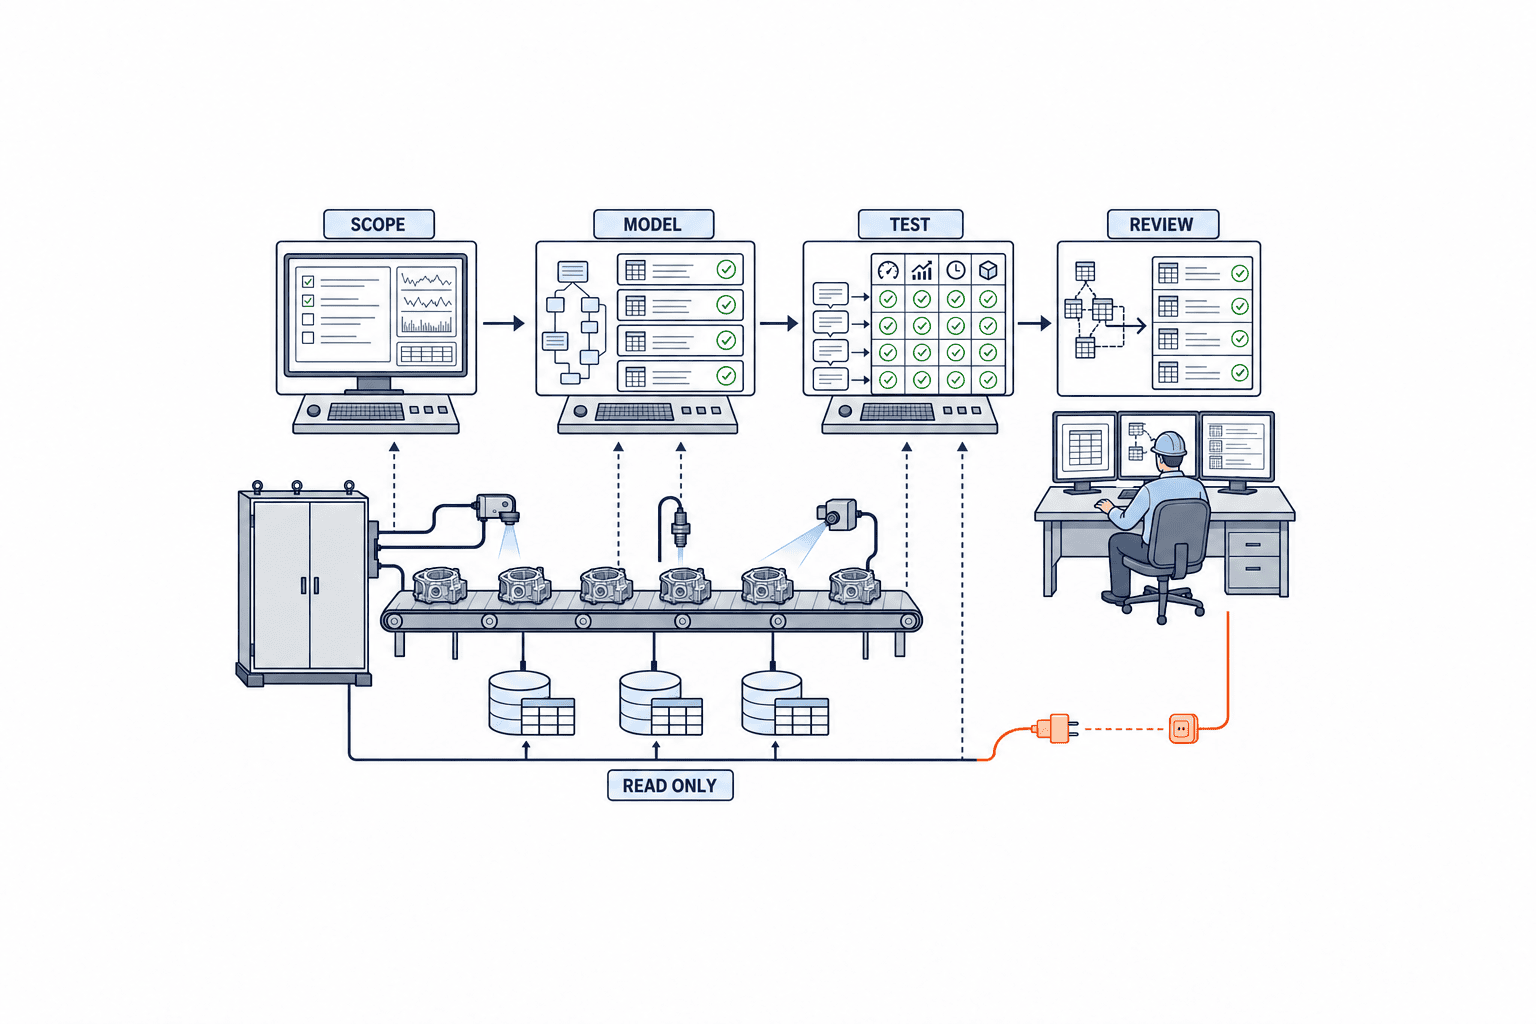
A 90-day PoC with 30 verified questions
The following is an illustrative 90-day PoC recommended by TOMAS TECH. It is not a research result or vendor guarantee. Adjust the duration, sample size, and thresholds to the risk and data quality of the selected use case.
Recommended acceptance criteria (TOMAS TECH recommendation)
| Measure | Acceptance threshold | How to test |
|---|---|---|
| Unauthorized row/column exposure | 0 cases | Ask questions as users with different roles; inspect results and logs |
| Correct query-and-answer pairs on frozen set | At least 27 of 30 | Compare with approved SQL and expected values; 27 ÷ 30 = 90% |
| Answer traceability | 100% | Every answer links to the executed query and source |
| Automatic write-back | 0 actions | Do not grant update APIs or database write permission during the PoC |
“27 of 30” means that both the query and final explanation are correct for at least 27 questions. Fluent prose with incorrect SQL fails. Correct SQL with a wrong unit or period in the explanation also fails. Ninety percent is a recommended starting gate, not a universal safety threshold; quality-, safety-, legal-, or finance-critical use cases may require stricter criteria or all questions to pass.
Days 1–15: freeze scope and ground truth
- Limit the PoC to one plant or domain, with named business and data owners.
- Create 20 representative questions, five ambiguous questions, and five permission/refusal questions: 30 total.
- Human reviewers approve expected SQL, expected values, acceptable explanation, and refusal conditions.
- Freeze the period and data snapshot so the answer does not move during evaluation.
- Record definitions and owners for OEE, yield, downtime, and inventory.
Do not make all 30 questions easy aggregations. Include ambiguous terms such as “recent,” “latest,” “plant-wide,” and “poor-performing”; include zero results, missing values, duplicates, time-zone boundaries, and prohibited columns. Also ask an out-of-scope request such as “state the root cause of defects” and verify that the agent explains the limitation and proposes additional analysis.
Days 16–35: connect data and semantic definitions
- Prepare a read-only validation environment.
- Expose only the minimum tables, views, and semantic models.
- Register example SQL, synonyms, formulas, joins, and default periods.
- Configure row/column access and masking close to production conditions.
- Show data freshness in every answer so stale data is not mistaken for current data.
More sources do not automatically create more value. Microsoft Fabric, for example, documents a limit of up to five sources per agent. Limits and connection conditions vary by product; list your required sources first and determine whether agents must be split or data consolidated.
Days 36–60: test, correct, and rerun the complete set
Score intent interpretation, source selection, generated query, query result, explanation, and visualization separately. Do not label every failure “model accuracy.” Use a diagnosis such as the following:
| Error class | Example | Primary improvement |
|---|---|---|
| Intent | “Last week” uses the wrong operating calendar | Clarification and time definition |
| Source | Current inventory selected instead of inventory history | Catalog description and scope |
| Join | Equipment events and production results create many-to-many duplication | Curated view |
| Metric | Reworked units included incorrectly | Semantic definition |
| Permission | Cost appears in the answer | Column access and masking |
| Explanation | THB described as quantity | Unit metadata and response template |
| Overreach | Correlation presented as cause | Guardrail and scope statement |
After any correction, rerun all 30 frozen questions, not just the failed one. Adding an example SQL for one question can degrade another. If using a verified-query repository, manage change history, approver, and regression-test date.
Days 61–75: limited operational trial
An illustrative cohort is five to ten users from production control, quality, and maintenance. This number is a TOMAS TECH recommendation, not a requirement. Teach users to treat answers as decision inputs, open unfamiliar definitions, avoid causal conclusions, and not forward confidential results beyond authorized recipients.
From the logs, inspect not only success rate but also why users rephrased, which questions were abandoned, and when they returned to manual work. Fast responses have little operational value if a data specialist rewrites every query. If many questions are repetitive, route them to the governed BI dashboard rather than rebuilding them conversationally.
Days 76–90: acceptance and production plan
Run the frozen 30-question set again in fresh sessions. Confirm permissions, traceability, and zero write-back. Even after passing, expand plants, users, and sources in stages rather than opening the agent company-wide.
Failure does not always mean the product should be rejected. If errors concentrate in definitions and source quality, improve the data first. If the system cannot enforce permissions, expose query/source provenance, or meet deployment requirements, stop adoption or revisit the architecture.
How a factory KPI dashboard and data agent work together
A data agent does not eliminate dashboards. OEE, running status, unresolved alarms, and inventory warnings that must be reviewed every morning are best shown in a consistent layout. The agent adds value for follow-up exploration such as “split the weak line by product and shift” or “compare it with last month under the same conditions.”
A useful three-layer entry model is:
- Monitor: show approved KPIs continuously in the factory KPI dashboard.
- Explore: pass dashboard context to the data agent for additional questions.
- Act: a human reviews the evidence and uses an existing approved workflow for maintenance, planning, or purchasing.
Do not automate the third layer during the PoC. If actions are added later, separate read access from write permissions and explicitly design allowed actions, approvers, limits, rollback, and duplicate-execution prevention. OpenAI’s description includes human-approved actions; it does not imply unconditional autonomy.
Pre-implementation data diagnostic
When a data-agent evaluation stalls, the root issue is often data readiness. If the following questions cannot be answered, consider an illustrative two-to-four-week diagnostic before the PoC. This duration is a TOMAS TECH recommendation and should be adjusted to the environment.
- Does every critical KPI have a business owner and data owner?
- Is there an approved report or SQL that establishes the current ground truth?
- Can plant, machine, product, and material master keys be mapped across systems?
- Are time zone, operating day, and shift boundaries standardized or convertible?
- Can missing, late, duplicated, and manually corrected records be detected?
- Can production-like row and column permissions be reproduced in test?
- Can query logs be retained so an answer can be reproduced later?
Classify the result into practical categories such as ready to connect, view preparation required, master-data integration required, and out of scope. This is more useful for investment decisions than a simple yes/no rating.
Operating model: prevent accuracy from degrading after launch
Data, metrics, and factory processes change. A solution that passes the PoC can fail after a new machine, ERP migration, product-code change, or fiscal-year update. At minimum, manage the following:
| Operating object | Recommended control |
|---|---|
| Evaluation set | Keep the critical 30 questions as regression tests and rerun them after definition or model changes |
| Semantic definitions | Version the reason, approver, effective date, and affected questions |
| Access | Review joiners, leavers, transfers, new plants, and contractors |
| Data quality | Detect late, missing, duplicate, and anomalous data before answering |
| Usage logs | Audit failed, frequent, rephrased, and exported questions |
| Incidents | Define stop, notification, investigation, and prevention for wrong answers or data exposure |
The interface should provide evidence, not just confidence. Show the metric definition, time period, last refresh, sources, generated query, and limitations so users can verify the result against original data.
Common failure modes and safeguards
Connecting enterprise-wide data first
Each additional domain adds ambiguous terms, duplicate metric names, and permission combinations. Start with one plant, one domain, and 30 questions; expand after acceptance.
Scoring only the prose answer
An invalid join can accidentally return the expected number. Score the query and answer together, and preserve source traceability.
Passing only polished demo questions
Real users ask “recently,” “bad line,” or “is inventory okay?” Evaluate clarifying questions, refusals, and definition disclosure as core capabilities.
Delegating root-cause analysis to conversational explanation
The agent can show that downtime and defects increased together. That does not prove one caused the other. Label potential causes as hypotheses and inspect process conditions, maintenance history, materials, and experimental evidence.
Granting write-back during the PoC
If a misunderstanding directly changes a purchase order, plan, or machine setting, impact escalates. Keep automatic write-back at zero for the 90-day PoC and require human approval.
FAQ: data agent implementation
How is data agent implementation different from a chatbot?
A data agent combines approved enterprise data, semantic definitions, user permissions, query execution, and auditing. A generic chatbot may generate text, but accurate KPI aggregation and enforceable data access require additional governed systems.
Can RAG replace an AI agent for data analytics?
Not completely. RAG is suited to retrieving procedures and reports; a data agent is suited to aggregating structured records and comparing metrics. A practical architecture uses queries for numbers and document citations for procedures.
Can non-SQL users use natural-language BI?
Yes, but “not writing SQL” does not mean “no verification.” Users should check period, unit, metric definition, and refresh time. A data specialist should remain in the review path for high-risk decisions.
What belongs in a semantic layer for AI?
Include formulas, grain, joins, units, time zones, default filters, exclusions, permissions, owners, and verified question-SQL pairs—not only metric names. Maintain version history and regression tests.
Does a data agent replace the factory KPI dashboard?
No. Use dashboards for stable recurring monitoring and the data agent for follow-up exploration. Rebuilding the same KPI in a conversation is slower and less stable than using an approved dashboard.
Can it automatically identify root cause?
It can summarize correlations and candidates, but that is not causal proof. Microsoft Fabric’s documentation explicitly treats causal/root-cause questions as out of scope. Combine statistical methods, experiments, process knowledge, and shop-floor confirmation.
Is 27 correct answers in a 90-day PoC sufficient?
The 27/30 = 90% threshold is an illustrative TOMAS TECH recommendation. High-risk uses may need stricter thresholds. Separately, the PoC must achieve zero unauthorized row/column exposure, 100% answer traceability, and zero automatic write-backs.
How much does a data agent cost?
Cost depends on licensing, consumption, the data platform, networking, semantic-model preparation, and operations. This article does not state unverified prices. Compare products using the same 30 questions, data, permissions, PoC scope, and production operating assumptions.
Conclusion: establish truth, permission, and provenance before buying
The value of data agent implementation is not conversation for its own sake. It is the ability to connect frontline questions to approved data and definitions, then deliver a verifiable answer quickly. OEE, yield, downtime, and inventory are strong manufacturing entry points, provided that grain, periods, exceptions, and access are defined first.
For build-versus-buy evaluation, look beyond model brands and polished demos. Test query correctness on your data, permission inheritance, audit logs, semantic-layer maintainability, and deployment conditions. An illustrative 90-day PoC can require at least 27 correct query-and-answer pairs out of 30, zero unauthorized exposures, 100% traceability, and zero automatic write-back. These are TOMAS TECH recommendations and should be strengthened for higher-risk use cases.
Finally, keep observed differences separate from causal conclusions. A data agent can accelerate exploration, but it does not replace source-data quality, human review, or manufacturing knowledge.
If you are still deciding whether your organization can create 30 verified questions, or whether a managed product or custom build fits, that is an appropriate time to talk. For data connections, KPI definitions, and permission design across Thailand and ASEAN plants, contact TOMAS TECH.
References
- OpenAI: Put data to work with a data agent (September 10, 2026: approved sources, semantic layers, permissions, dashboards, human-approved actions, and internal adoption)
- OpenAI: How enterprises put AI to work (August 12, 2026: observed enterprise adoption patterns)
- Databricks: Genie Agents (curation with Unity Catalog data, example SQL, expressions, and instructions)
- Snowflake: Verified Query Repository (human-verified questions and SQL for greater trustworthiness)
- Microsoft Learn: Create a Fabric Data agent (user permissions, SQL/DAX/KQL, up to five sources, and causal/root-cause limitations)


