


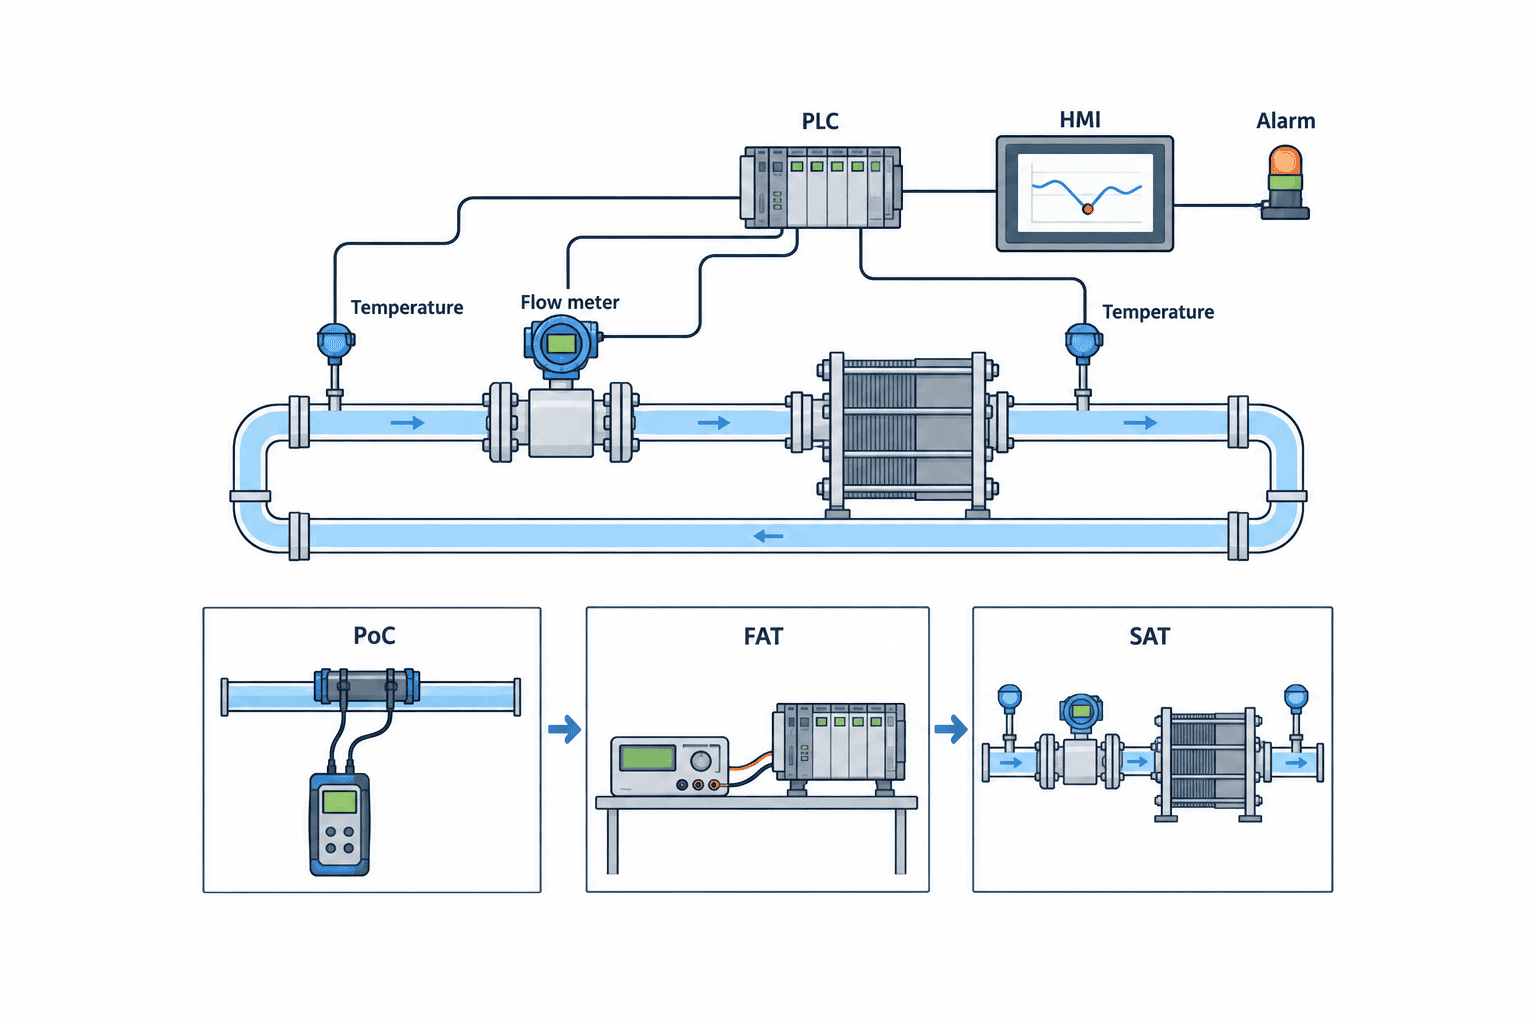
When a factory in Thailand implements cooling water flow monitoring, the first decision is not the meter model. It is which equipment must be protected, how quickly a loss of flow must be detected, and who acts on the alarm. A total meter at the pump discharge cannot reveal every under-supplied heat exchanger. Metering every branch, however, adds construction and maintenance cost. This guide takes the project from an existing-pipe survey and measurement-point plan through meter selection, alarms, a proof of concept (PoC), the request for proposal (RFP), factory acceptance testing (FAT), and site acceptance testing (SAT).
Keep this objective distinct from cooling tower water-quality management and whole-factory water accounting. Circulating flow indicates whether water reaches the equipment; make-up water indicates losses from the cooling tower. Flow alone also does not establish heat-transfer performance: read supply and return temperature, pressure, pump status, and valve position with it. The U.S. Department of Energy (DOE) describes process cooling as essential to maintaining process and product temperature, quality, and specifications. Every threshold and calculation below is a design example. Determine actual limits from equipment manufacturers and site tests.
Separate three objectives before installing cooling water flow monitoring
“Make cooling water visible” is an understandable request, but an undefined request can produce a screen of numbers without an action when something goes wrong. Distinguish equipment protection, product quality, and water/energy management. Each objective calls for different meter locations, data intervals, and alarm priorities.
Equipment protection: capture the duration below minimum flow
Insufficient cooling can stop or damage a furnace, molding machine, compressor, or laser machine. Do not convert every instantaneous dip into a trip. A brief disturbance during pump changeover differs from persistent low flow caused by a blocked strainer. Agree on the minimum permissible flow, persistence time, operating-state conditions, and response with the equipment maker, maintenance team, and production team. If the project includes a safety interlock, design and validate it under its applicable safety requirements separately from an ordinary monitoring alarm. A dashboard must not be treated as a substitute for a safety function.
Product quality: view flow and temperature difference together
Even when flow is within its design range, rising inlet water temperature may reduce available cooling. Conversely, a small flow reduction does not prove that a product defect occurred when process load is low. This is why flow and heat-exchanger inlet/outlet temperatures belong on the same trend. A water-side heat-transfer estimate is density × specific heat × volume flow × temperature difference. Heat loss, mixing, and instrument error mean that the estimate is not a direct product acceptance criterion. Validate the relationship with product-temperature and defect records.
Water and energy: do not confuse circulation with make-up
Cubic metres circulated per hour and cubic metres added to a cooling tower are different metrics. Circulation transports heat; make-up replenishes evaporation, blowdown, drift, and leakage. DOE recommends meters on cooling-tower make-up and blowdown lines, assessed alongside conductivity. A circulation meter alone cannot prove water savings, while a make-up meter alone cannot confirm sufficient flow through a heat exchanger. For the factory-wide water balance, see our water usage monitoring guide. For conductivity, blowdown, and chemistry, see cooling tower water quality monitoring.
Choose cooling-water pipe measurement points from the P&ID and a site walk

Trace pumps, cooling towers, heat exchangers, headers, branches, bypasses, check valves, and strainers on the piping and instrumentation diagram (P&ID). Then walk the plant. Extensions absent from the drawing, bypasses left open, isolation valves shut, and standby pumps out of service can make the actual flow path differ from the designed one. Selecting a meter from the drawing alone can measure the wrong stream.
Put the first meter where it helps isolate a cause
Candidates include the pump discharge, a critical equipment supply branch, the heat-exchanger inlet, and cooling-tower make-up. Ask: when this reading falls, what will the technician check next? A fall in main-line flow points toward the pump, suction side, main valve, or common strainer. Yet a normal total flow can coexist with one branch being throttled. Meter the branch independently when the equipment’s loss of cooling has high consequences.
For several heat exchangers in parallel, a total at the inlet and outlet headers cannot prove the split among branches. Measure critical branches or combine differential pressure, temperatures, and valve position to diagnose imbalance. One meter cannot reveal every possible fault. Expecting it to do so creates both nuisance alarms and missed events.
Record operating conditions before deciding whether the meter fits
For each point record normal, minimum, and maximum flow; nominal and actual inner diameter; pipe material, wall thickness, and lining; conductivity and glycol concentration; fluid temperature and pressure; bubbles and solids. Include insulation thickness, outer-pipe condition, available straight run, distances to elbows and valves, cabling, power, flooding, and condensation. Measure the pipe if its marking and the as-built drawing disagree. On large pipes, scaffolding, insulation reinstatement, welding, lifting, and shutdown time can exceed the meter’s own cost.
A partly filled horizontal pipe, an air-collecting high point, or a turbulent point immediately after a pump needs special attention under either technology. Do not apply a universal “five pipe diameters” rule. Required straight run depends on meter design, upstream fittings, and product-specific correction features. Yokogawa’s installation guidance distinguishes bends, valves, and junctions. Match the candidate product’s manual to the measured site dimensions before ordering.
Cooling water flow meter selection: clamp-on ultrasonic or magnetic?

Clamp-on ultrasonic measurement is attractive when an existing system cannot be stopped. External transducers may avoid pipe cutting and draining. At Vietnam’s Pomina 3 steel mill, an Emerson/FLEXIM case study describes a retrofit on cooling-water piping for a rolling line that runs continuously. That installation does not guarantee the same performance elsewhere. Pipe material, wall thickness, coating, internal scale, bubbles, velocity, and transducer position affect signal quality. Trial the technology at the actual site.
A magnetic meter measures conductive liquid in a full pipe and has no moving parts. Emerson and Yokogawa publish cooling-water and chilled-water applications. An inline installation on an existing line generally needs a planned shutdown, cut pipe, and flanges, while a suitable application can make it a strong permanent option. A magnetic meter cannot measure a nonconductive fluid. Specify liner and electrode material, grounding, conductivity, empty-pipe detection, and condensation protection.
| Decision item | Clamp-on ultrasonic | Magnetic, inline |
|---|---|---|
| Existing pipe shutdown | May be avoided when conditions fit | Usually needs pipework and a shutdown plan |
| Wetted parts | None | Sensor contacts the liquid |
| Main feasibility checks | Pipe material/wall, internal condition, bubbles, velocity | Conductivity, liner/electrode, grounding, full pipe |
| Site verification | Signal quality and repeatability with trial unit | Installation, zero, signal, and grounding |
| Typical fit | Retrofit where shutdown is difficult | New pipe or planned-shutdown permanent point |
This compares principles, not guaranteed specifications. Request accuracy, range, straight-run requirements, and maintenance conditions for the actual temperature, pressure, bore, and fittings. Some individual products can compensate for short straight runs, but do not transfer that claim to all magnetic meters. If the only available location is beside an elbow, check the exact model’s installation criteria or move the point.
A portable survey and a permanent alarm need different evidence
A few days with a portable instrument can show which branch merits permanent monitoring. A permanently installed alarm also needs a year-round operating range, restart behaviour, communication-loss handling, calibration, and maintenance plan. A stable temporary reading is not sufficient on its own. Include wet and dry seasons, all-line and partial-line operation, and pump changeovers when defining the range. If low-flow decisions depend on relative error, check range and low-flow cutoff settings explicitly.
Compare installed cost rather than a unit price
Request meter, transmitter, brackets, insulation removal and reinstatement, pipework, scaffolding, panel terminals, PLC I/O, communications, HMI, alarm testing, commissioning, spares, and calibration documentation. If shutdown costs dominate, a more expensive non-invasive meter may have a lower total installed cost. On a new pipe, an inline installation may add relatively little construction work. Compare offers using identical scope and expected maintenance work.
Detect heat-exchanger cooling-water abnormalities beyond one low-flow limit
A frequent mistake after installation is to set “alarm at 80% of design flow” and stop there. Design and operating flow often differ; the resulting alarm may either sound continually or never sound when needed. Set thresholds using the manufacturer’s minimum, measured operating distribution, product-quality records, pump and valve state. Add start-up delay, suppression during planned pump transfer, and a hysteresis for return to normal. Verify all of them in testing.
Make the logic return a plausible next check
Low supply flow with low pump discharge pressure suggests checking the pump, suction side, and major leakage. Low flow with a rising strainer differential pressure points toward blockage. Normal flow with higher heat-exchanger outlet temperature suggests increased load, warmer inlet water, fouling, or a bypass. These are diagnostic clues, not proof of a single cause.
| Observation | First checks | Additional signals |
|---|---|---|
| Flow down, discharge pressure down | Pump, suction, main valve | Current, suction pressure, valve state |
| Flow down, strainer differential pressure up | Strainer blockage | Pressures, cleaning history |
| Flow normal, outlet temperature up | Inlet temperature, load, heat-transfer surface | Supply/return and product temperatures |
| Make-up up, circulation stable | Blowdown, leak, overflow | Conductivity, level, blowdown valve |
The final row separates a circulation problem from a water-balance problem. DOE recommends comparing make-up and blowdown flow ratios with conductivity ratios and investigating leaks or other withdrawals when they diverge. Water-treatment changes still require a water-treatment specialist and the site’s chemistry limits.
Check data health before trusting the alarm
Does a zero reading mean the water stopped? A power failure, broken 4–20 mA loop, PLC input fault, communication outage, or time mismatch can produce a zero-like value. Record a genuine zero, missing value, communication fault, and meter self-diagnostic separately. An alarm log needs occurrence and clearance times, operating state, acknowledgement, and response. A coloured screen without a traceable event history cannot support a later investigation.
Worked example: minimum flow and heat load
All figures here are assumptions to demonstrate a calculation, not actual plant performance, a supplier guarantee, or a general Thai water tariff. Assume one heat exchanger normally receives 50 m³/h, with a minimum permissible flow of 40 m³/h. Assume water density of 1,000 kg/m³, specific heat of 4.186 kJ/(kg·K), and a 5 K inlet-to-outlet temperature difference. Mass flow is then 50,000 kg/h. The water-side heat-transfer estimate is 50,000 × 4.186 × 5 = 1,046,500 kJ/h; divided by 3,600, that is about 291 kW. It is an estimate of heat transported by the water, not the equipment’s electrical consumption or an energy-saving claim.
At 40 m³/h with the same other assumptions, the calculation is about 233 kW. In reality, the temperature difference may change; it would be wrong to claim “20% less flow means 20% less cooling.” At 40 m³/h with a 6 K difference, the result is about 279 kW. Investigate process load, inlet temperature, heat-exchanger fouling, and sensor positions to explain that difference. Record flow and both temperatures with synchronised timestamps.
As another hypothetical project, consider reducing excessive flow by changing pump speed. Pump affinity laws alone cannot establish annual savings: static head, throttling valves, parallel pumps, minimum flow, and efficiency curves matter. Compare measured kW, flow, pressure, and hours before and after under comparable production conditions. An electricity reduction that compromises equipment protection, temperature, or quality is not a successful outcome.
Define three layers of KPI before the PoC
An operating KPI can be the fraction of run time that critical-branch flow stays inside limits; a maintenance KPI, time from low-flow detection to inspection; an improvement KPI, pumping electricity under comparable production and ambient conditions. Track nuisance alarms and missing-data rate as well. A simple month-on-month comparison without production normalisation can exaggerate or hide the benefit. Agree on the baseline and comparison method before the PoC.
What to include in a cooling-water monitoring RFP
An RFP that asks merely for “one flow meter set” invites cheap bids with missing construction scope. Give every bidder the same measurement objective, P&ID, point list, ranges, fluid, shutdown window, acceptance criteria, and maintenance requirements. State where the meter supplier’s work ends and the pipe contractor’s, PLC contractor’s, and plant maintenance team’s work begins.
Minimum RFP checklist
- Equipment, P&ID, tag number for every point, monitoring objective, and required response to abnormal conditions.
- Normal/minimum/maximum flow, liquid temperature and pressure, pipe dimensions/material, conductivity/concentration, bubbles, and solids.
- Straight runs, valve/elbow/pump distances, insulation, power, cable routes, and spare cabinet space.
- Outputs, PLC addresses, update rate, time synchronisation, data retention, and display of missing data.
- Alarm conditions, delay, reset, recipients, and boundary with existing interlocks.
- Shutdown, draining, reinstatement, leakage test, spare parts, and maintenance procedure.
- PoC, FAT, SAT tests and acceptance criteria, drawings, training, warranty, and handover documents.
“±1% accuracy” is incomplete. State the flow range, whether percentage is of reading or full scale, and the fluid/installation conditions for which it applies. If meter output and PLC collection intervals differ, a brief low-flow event may disappear. Specify response time across the entire path from sensor to notification if it matters to the operation.
Make omitted scope visible in the bid comparison
Use separate columns for instrument/transmitter, construction, PLC/network, HMI/history, tests, spares, annual maintenance, and shutdown impact. Ask each supplier to mark an item as included, separately priced, or excluded, then normalise the totals. Assess availability of replacement parts and service in Thailand, calibration support, and response time. A joint site visit before purchase reduces later changes based on a mistaken pipe assumption.
Design PoC, FAT, and SAT as distinct tests
PoC asks whether this method can read the required range on this pipe. FAT checks the instrument, PLC, displays, and alarm logic with simulated signals before delivery. SAT verifies installation and actual operation after mounting on the real pipe. Passing a screen test in FAT does not prove that the installed meter reads actual water correctly.
PoC: a reading is not yet a pass
Trial near normal, minimum, and maximum operating states if feasible. Include pump transfers, valve changes, and all-line and partial-line running. Log signal quality, variation, missing data, and repeatability after remounting. Compare with existing pressure/temperature records and pump curves. Without a traceable reference meter, report that trends and repeatability were checked; do not claim to have established absolute accuracy. Record attachment location, outside diameter, wall thickness, and instrument settings for the permanent design.
FAT: test the complete signal path
Use simulated zero, normal, low, high, broken-wire, communication-loss, and power-restart conditions. Verify PLC scaling, units, tags, timestamps, recipients, delay, and reset. Check that stopped equipment does not produce nuisance alarms and that missing data is never treated as a healthy value during operation. Record stimulus, expected result, actual display, pass/fail decision, and corrections.
SAT: accept the meter on the real system
Inspect orientation, grounding, insulation, terminals, water ingress protection, pipe leaks, and agreement between local and central displays. Check plausibility and stability at more than one actual operating point. If safe, simulate low flow and follow the alarm through notification to human response. Test any critical shutdown only under a separately approved procedure with the responsible staff present. When site operation cannot cover the full required range, state what SAT did not verify and schedule additional testing. “Test performed” and “performance demonstrated” are different claims.
Use the first 90 days to turn data into routine action
In the first 30 days, build a normal flow and temperature range for each operating mode. Log nuisance alarms, missing data, and delays; separate instrumentation faults from process faults. In the next 30 days, refine thresholds and recipients, linking the alarm to a maintenance checklist. In the final 30 days, compare detection-to-response time, recurrence, quality records, and pump power. This is an example commissioning plan, not a statutory schedule. A seasonal process may require separate reviews during wet and dry periods.
Retain the tag register, P&ID, calibration records, setting changes, and response table when staff rotate. Close every meaningful alarm with a cause, interim action, permanent measure, and follow-up trend. Cooling-water flow data should become a shared language for preventing equipment stoppages. A technician who knows the next action is more valuable than a polished dashboard alone.
Frequently asked questions
Where should cooling water flow monitoring start?
Start where a loss of cooling has the greatest consequence and where a reading can separate common-system from branch faults. The main pipe helps assess pump and common piping, but can miss a throttled branch. Consider an independent branch point for a critical heat exchanger or furnace. Confirm the P&ID against real operating paths first.
How do I select a cooling water flow meter: ultrasonic or magnetic?
If stopping an existing line is difficult, shortlist clamp-on ultrasonic and trial its signal and repeatability on site. If construction is planned and the water is sufficiently conductive, include magnetic meters. Compare the actual pipe, fluid, straight run, installation, maintenance, and total cost in one RFP. The technology label alone does not establish accuracy or price.
Can flow alone detect a heat-exchanger cooling problem?
It detects a flow reduction, but not the complete thermal performance or definite cause. Inlet/outlet temperature, pressure, pumps, and valves are also needed. Cooling can deteriorate even with normal flow when inlet water warms or heat-transfer surfaces foul.
What belongs in the FAT and SAT sections of the RFP?
FAT should test scaling, display, history, alarms, wire breaks, and communication failure using simulated inputs. SAT should test mounting, leaks, grounding, agreement of field and HMI readings, plausibility at operating points, and low-flow response. Give each test an expected value, tolerance, record method, and owner.
Does a cooling-tower make-up meter replace a circulation meter?
No. Make-up measures the tower water balance; circulation measures water reaching the heat exchanger. For water savings, prioritise make-up, blowdown, and conductivity. For equipment protection, prioritise circulation, temperature, and pressure. One meter should not be asked to answer both questions.
Summary
Cooling water flow monitoring works when the project begins with the equipment to protect and the action required after an abnormal reading. Match the P&ID with the physical pipe, and distinguish common-line from critical-branch measurements. Compare clamp-on ultrasonic and magnetic technologies by shutdown constraints, fluid and pipe conditions, total installed cost, and maintenance. Read flow together with temperature, pressure, and running state. Use PoC to establish site feasibility, FAT to verify signals and alarms, and SAT to prove the installed system’s behaviour. This is how a flow number becomes an operational decision.
If your Thai plant is deciding where to meter a cooling-water circuit or whether an existing line can be instrumented without a shutdown, share the P&ID and equipment outline through TOMAS TECH’s contact page. We can discuss the measurement points and PoC scope while the project is still being defined.
References
- U.S. Department of Energy, Process Cooling and HVAC: purpose and components of industrial cooling.
- U.S. Department of Energy, Cooling Tower Management: make-up, blowdown, conductivity, and water balance.
- U.S. Department of Energy, Single-Pass Cooling Equipment: checking entering/leaving water temperatures and flow.
- Emerson/FLEXIM, Cooling Water Monitoring in a Steel Mill: Pomina 3: non-invasive retrofit case.
- Emerson, Magnetic Flow Meters: principle and conductive-liquid suitability.
- Yokogawa, Chilled Water in Air Conditioning Unit: magnetic-meter application.
- Yokogawa, AXF Magnetic Flowmeter Installation: piping and straight-run guidance.


