


When selecting and implementing a belt scale for conveyors, simply comparing the accuracy figures in catalogs will not determine your measurement results. This is because a belt scale is a device that combines the load and speed of a belt carrying bulk material over a weighing roller, and accumulates the passing quantity. The measurement system must be designed as a whole, including installation location, roller alignment, belt tension, stability of the conveyed material, zero adjustment, and verification with actual material. This article summarizes the decision-making process from RFP to FAT/SAT, assuming the handling of raw materials, minerals, aggregates, grains, and recycled materials in Thai factories.
First, Decide “What Will Be Measured”
A belt scale determines the instantaneous flow rate and cumulative throughput of bulk materials conveyed continuously. The basic principle is to measure the linear load on the belt (kg/m) using a weighing frame with a load cell, and multiply it by the belt speed (m/s) obtained from a speed sensor. The resulting flow rate is in kg/s. Integrating the flow rate over time gives the total mass for a given period. In practice, the indicator includes sampling, filtering, zero correction, and accumulation processing, so the displayed value cannot be explained by a simple instantaneous multiplication. Decide at the outset whether the measurement results will be used for process monitoring, raw material accounting, or shipment quantity verification.
If you misidentify the target, your choice of system will be off. Checkweighers that judge pass/fail for each packaged product, weighing/blending systems that batch specified quantities, and general conveyors designed for routing or merging have different purposes. The main outputs of a belt scale are “how many tons passed during this period” and “what is the current t/h.” If you require mass assurance at the particle or bag level, a different type of scale is needed. Clearly state the measurement objective in a single sentence and place the value to be used for which judgment or control at the beginning of your RFP.
OIML R 50 covers continuous totalizing belt weighers that combine the mass of bulk material under gravity with belt speed. It includes single-speed, variable-speed, and multi-speed conveyors. However, being covered by the standard does not automatically mean your equipment can be used for commercial transactions. For use in sales, certification, or legal metrology, you must individually confirm the applicable Thai regulations, type approval, verification, sealing, and on-site test requirements with the relevant authorities and suppliers. The numerical examples in this article are for design procedure explanation and are not declarations of legal accuracy.
Align Measurement Points with Operational Values
A ton measured immediately after raw material receipt, before crushing, before mixing, after drying, or before shipment has different operational significance. This is due to changes in moisture, adhesion, spillage, and returned material in between. For example, if you want to manage the input to a crusher, use the cumulative value at the weighing point just before that machine. If you want to reconcile with shipment quantities, you need to account for losses and branches between the weighing point and loading. For raw material accounting, if you don’t synchronize the weighing times and boundaries of multiple lines, the totals won’t match. In the initial site survey, draw the weighing points, input points, branches, return flows, and bypasses on the conveyor system diagram.
Simply comparing “total daily quantity” will not reveal abnormal points. Attach equipment ID, material, lot or batch, start/end time, operating status, and the history of zero adjustments or calibrations to the measurement values. Decide how to cut off accumulated values at shift boundaries, how to retain previous values after a power outage, and how to handle small flows when no material is running. When reconciling with truck scales or hopper scales, match the target material and time period, and subtract any inventory changes in between. Mixing units like t, kg, and t/h can cause transcription errors, so fix the units on screens, reports, and PLC tags.
For integration with higher-level systems, handle instantaneous flow, accumulated value, belt speed, zero status, faults, calibration in progress, and communication quality separately. If the accumulated value decreases due to instrument replacement or reset, the MES must be designed not to record a negative production quantity. When recovering from a communication failure, define keys for retransmission and duplicate elimination. The concepts of confirmed values and history discussed in Designing Weighing Scale Data Integration for Factories also apply here, but for belt scales, the focus is on continuous accumulation and how to define periods.
Breaking Down the Components of a Belt Scale
The weighing frame transmits the force of the belt and material on the weighing idler to the load cell. The speed sensor detects the movement of the belt or a trailing roller. The indicator/totalizer reads the load and speed, calculates the flow rate and total quantity, and outputs the results. In addition to these three, the conveyor body, rollers, take-up, belt, skirt, cleaner, and feed chute are also part of the measurement system. Even if you use a high-spec load cell, if the belt floats, rollers seize, or the load bounces on the weighing section, the results will not be stable.
Special attention is needed for how speed is measured. The speed calculated from the drive motor’s frequency command does not always match the actual belt speed, due to slippage, pulley diameter differences, and delays during acceleration/deceleration. Check the mounting position and contact method of the speed sensor, whether it slips during cleaning, and how to handle reverse or low-speed operation. Siemens’ recalibration guide also lists checking conveyor speed as the first step in the procedure. Speed errors directly affect flow rate, so repeatedly adjusting only the load side will not fix the problem.
For indicator functions, check the update cycle, flow smoothing, accumulation start point, zero tracking, low-flow cut-off, and end-of-batch processing. Even if the flow display looks stable, if the filter is too strong, supply abnormalities will be detected late. Conversely, if the display is too fast, periodic roller vibrations or fluctuations from lumpy material will trigger frequent alarms. Define the required response for each use—monitoring, control, reporting—and do not indiscriminately reuse the same value tag for all purposes.
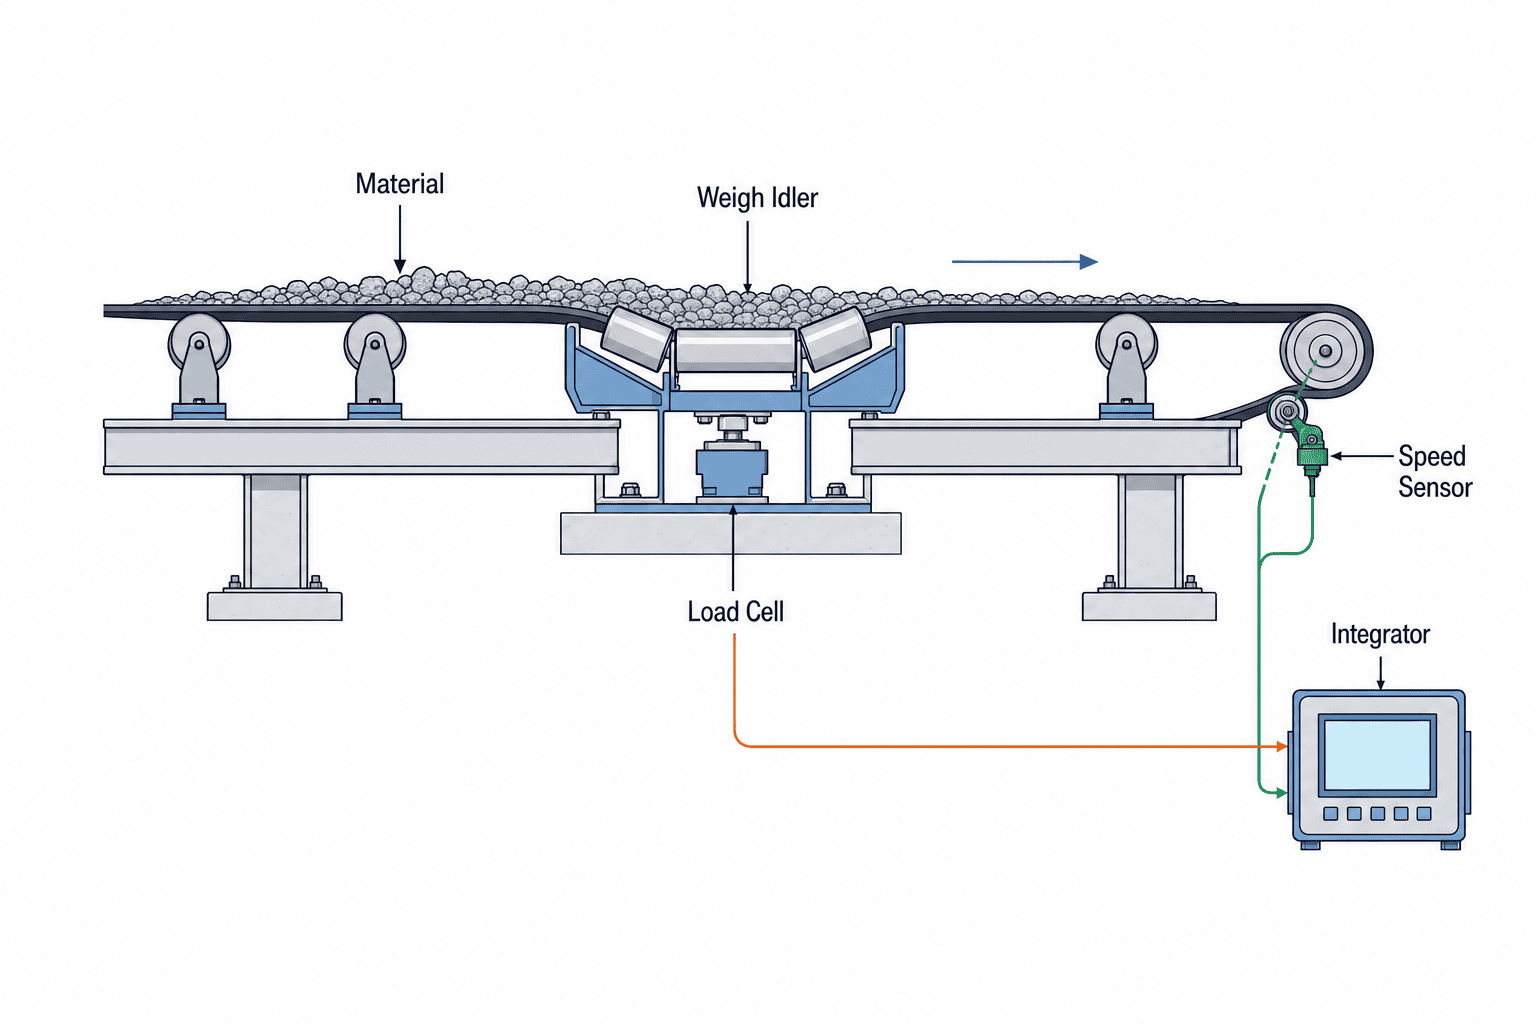
Do Not Decide Installation Location by Straight Length Alone
The weighing section requires a straight section where the material has settled after dropping, free from impact and lateral deviation. Check the positions of the feed chute, skirt end, pulleys, curves, trippers, magnetic separators, and cleaners on the drawings. If too close to the head pulley, the transition from troughed to flat belt applies extra force to the weighing roller. If too close to the feed point, the load is still bouncing on the belt and distribution across the width is uneven. The required distance depends on belt speed, trough angle, and conveyor structure, so compare the equipment manufacturer’s installation instructions with actual site dimensions.
Siemens’ Belt Scale Application Guidelines emphasize idler alignment around the weighing section as a critical condition, recommending alignment of at least two, preferably three, idlers on both sides of the weighing idler. The same document recommends equal spacing between approach, weighing, and departure idlers, generally not exceeding 1.5 m. These are application conditions from their guide and not universal standards for all models. In the RFP, request the supplier to provide drawings showing the required straight length, alignment tolerances, and roller arrangement for the target model.
Record whether the weighing section is horizontal or inclined, and whether it is indoors or outdoors. Rain, dust ingress, spillage, strong winds, cleaning, vibration from nearby equipment, and maintenance walkways used by workers all affect how the frame and sensors should be protected. In Thailand’s hot and humid environment, consider not only waterproofing of electrical boxes but also condensation, cable entry points, terminal corrosion, and safe scaffolding for inspections. Do not declare installation suitability based solely on equipment protection ratings; confirm with installation drawings, cable routes, and cleaning methods as well.
Prepare the Belt and Idlers First
If roller height, levelness, squareness, or rotation are inconsistent, the load distribution on the weighing frame will change. If the trough angle or roller shape changes before and after the weighing section, belt rigidity and contact will also change. Do not compare results to nominal accuracy if the belt floats above the weighing roller, contacts only one side due to misalignment, or if material is stuck to the rollers. Siemens lists idler alignment, belt tension, and installation location as the three main factors affecting accuracy. Before installing the frame, inspect roller type, wear, rotation, and belt tracking, and replace as necessary.
The take-up mechanism stabilizes tension fluctuations during operation. Tension varies with empty running, material load, temperature, and during start/stop. Both excessive and insufficient tension change the force on the weighing section and belt contact. If the belt splice thickness or hardness is inconsistent, it may cause periodic zero shifts as it passes over the rollers. Provide the supplier with details of the existing belt’s material, width, speed, splice, and take-up method, and request confirmation of applicability and any required modifications.
Cleanliness also affects measurement. If material adheres to the weighing idler, it changes the zero point and rotational resistance. Material carried on the underside of the belt may also pass periodically. If you add cleaning devices near the weighing section, their contact force may affect measurement, so design their position in advance. The existing conveyor design article covers transport and merging aspects. In this article, we additionally check the force transmission path to the weighing roller.
Maximum t/h Measurement Range Alone Is Not Sufficient
Obtain the distribution of maximum flow rate, normal flow rate, minimum flow rate, and empty belt time. Even if you select a large weighing frame based on the catalog’s maximum throughput, if daily operation is at very low load, you may not achieve the desired repeatability. Conversely, if you underestimate only the maximum value, you risk overloading during supply surges or startup. Instead of relying on the line’s rated capacity, record the actual combinations of material load and speed. Input conditions should include bulk density for each material, particle size, maximum lump size, stickiness, moisture content, temperature, and load bias.
Required accuracy must be defined as “the error against what, over which interval.” Variations in instantaneous flow display, bias in accumulated value over a fixed period, zero stability, day-to-day repeatability, and agreement with a reference scale are all different metrics. For example, short-term flow fluctuations are important for monitoring mixing ratios, while long-term accumulated deviation is critical for monthly raw material accounting. When you see a manufacturer’s “accuracy 0.5%” claim, check what reference quantity, operating range, test method, and installation conditions it refers to. Do not compare numbers with different definitions in the same column.
When comparing methods, consider options such as single weighing idler, multiple idlers, or heavy-duty types. It cannot be said that multiple idler systems are always superior. Match the choice to the available straight length of the existing conveyor, roller diameter, trough angle, maintenance space, and required measurement purpose. Ask suppliers to provide configuration diagrams and the basis for the usable flow range, and have them estimate spare parts and construction scope under the same conditions.
Aligning Specification Meanings with Calculation Examples
For example, if the design line load is 20 kg/m and belt speed is 1.5 m/s, the theoretical instantaneous flow rate is 30 kg/s, or 108 t/h. This is a hypothetical example to illustrate unit conversion and does not indicate the performance or measurement accuracy of any specific equipment. If the speed is the same but the line load is halved, the calculated flow rate is also halved. In actual equipment, the empty belt load is subtracted as zero, and calibration factors, filters, and speed measurement errors are included. Do not use calculation examples as guarantees of measured values.
For verifying accumulated values, if the display shows 108 t/h for 10 minutes, you can calculate 18 t. However, in reality, the supply amount fluctuates, so estimating the interval total from a single instantaneous reading is not a valid acceptance method. Record the accumulated value at the start and end of a fixed interval, and weigh the same batch of material with an independent reference scale. Account for the empty belt section before supply starts, the time material remains on the weighing section, and the delay to the end of transport. If the material batches being compared are not aligned, results will not match even if the instrument is correct.
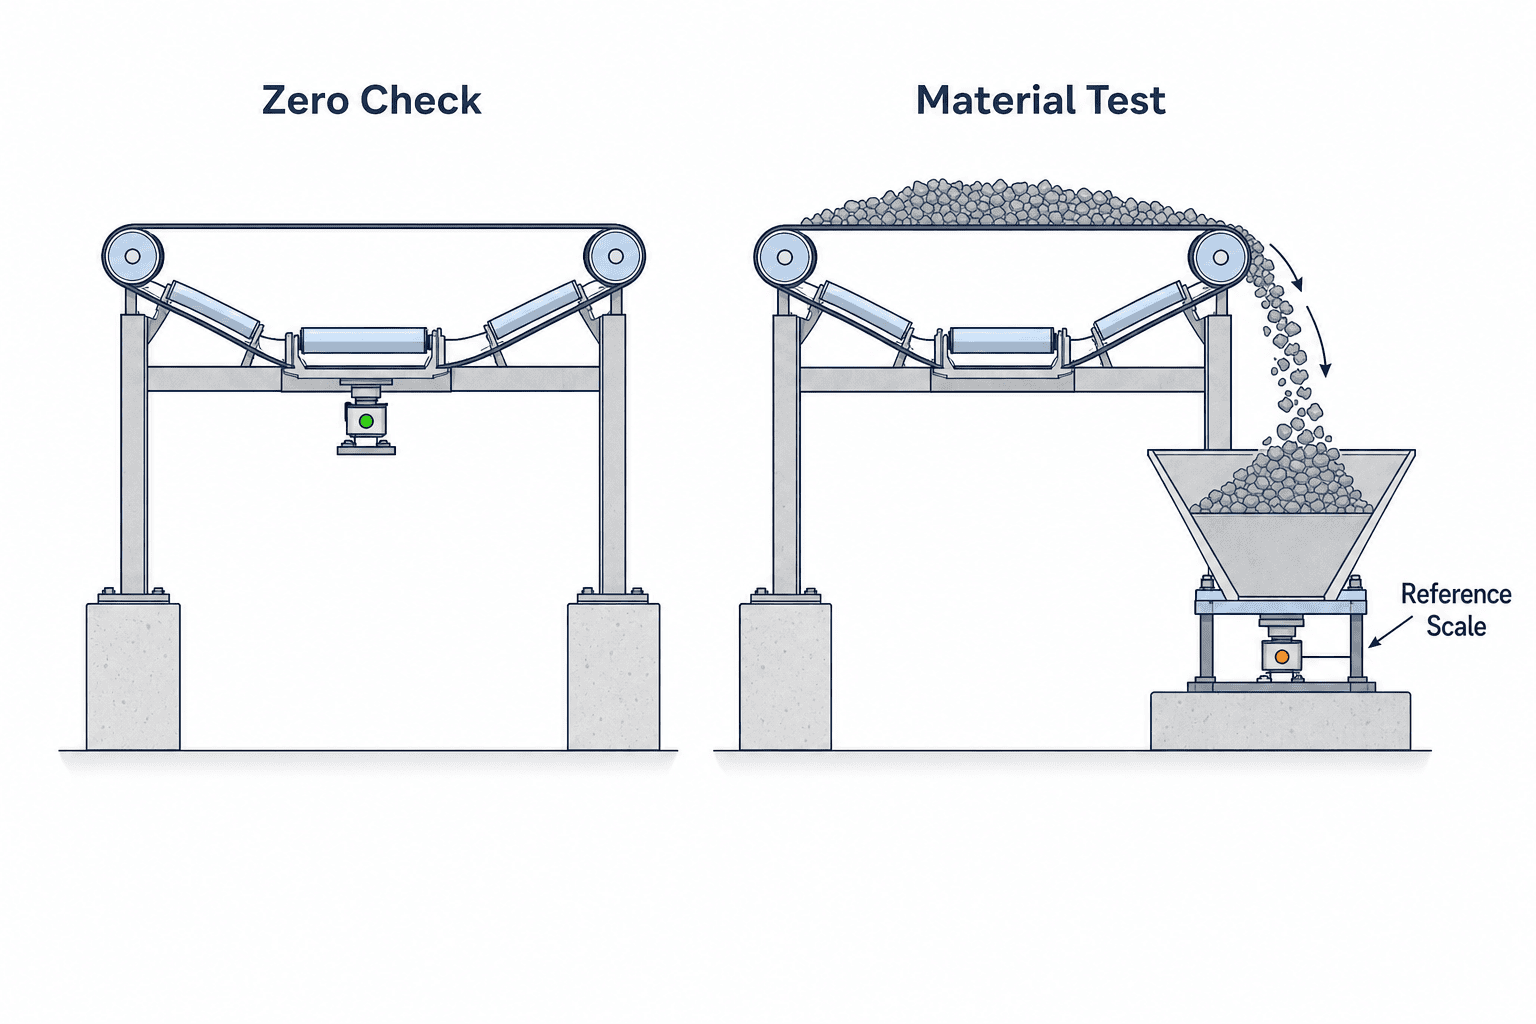
Separate Zero Adjustment, Simulated Load, and Actual Material Testing
Zero adjustment with an empty belt reflects the condition of the belt and rollers. Pressing the zero button while the conveyor is stopped is not the same as checking zero after running the belt for at least one full revolution. Follow the instrument’s manual for procedures, and set conditions for rechecking after cleaning, repairs, or belt replacement. Changes in zero can also be early signs of contamination or roller issues. Before clearing values that exceed the allowable range on the display, inspect the mechanical side.
Test weights, test chains, and electronic simulated signals are methods for checking part of the instrument and load detection system. Siemens’ equipment manuals recommend calibrating with test weights after installation and connection, and suggest actual material testing for best accuracy. Thermo Fisher’s handbook also emphasizes preparing for material testing and reference scales for trade compliance. Even if the display matches with simulated load, this does not confirm cross-belt distribution of actual material, interaction with the belt, or tension fluctuations during transport.
For actual material testing, run representative materials at normal speed and load, and verify the weight with an independent static scale, such as a hopper scale or truck scale. Record the calibration status and identifier of the reference scale, material loss, recycling route, and test section. Do not consider the process complete after a single match; check repeatability with multiple runs and different loads. For trade applications, official test methods and witness attendance take priority. Here, we do not present any specific permissible error or number of test runs as a universal acceptance criterion.
Photos and Measurements to Record During On-Site Surveys
If you are estimating the retrofit of an existing conveyor, a single overview photo is not sufficient. Measure with a tape from the feed chute to the candidate weighing position, and from the weighing position to the head pulley, then annotate these dimensions directly onto photos that clearly show each location. Also, record photos of the roller rows taken from both sides, the lower frame at the weighing position, the take-up, candidate rollers for speed sensors, cable routing paths, and walkways where operators can safely approach. If there are discrepancies between the drawings and the actual equipment, prioritize the actual measured values and mark the differences in red on the drawings. Photos or short videos showing the equipment in operation with material flowing provide suppliers with clues to evaluate lateral load bias and bouncing. Always follow equipment safety procedures during photography, and do not approach rotating parts for measurement.
For existing equipment, record not only a single representative daily operating value, but also low, normal, and high flow rates for each product type. Instead of inverter setpoints, record the actual speed; instead of feeder setpoints, record the actual time material is flowing; and if possible, log cumulative increments during periods that appear to be zero flow. This clarifies the assumptions for proposals. For items that cannot be measured directly, mark them as estimates and decide who will measure them before FAT or SAT. If the manufacturer’s quotation conditions state “constant belt speed” or “uniform material distribution,” confirm the proportion of time these conditions are actually met on site. Do not assume that a short trial run represents all annual conditions; include unusual situations such as adhesion during the rainy season or high-moisture materials as design inputs.
In the on-site survey form, also include information such as which points to lock out during equipment shutdown, whether the belt can be slackened when installing the weighing frame, whether lifting equipment can be brought in, and whether there is a route to return material to a hopper or truck for testing. If inspectors need to remove guards to reach rollers, include inspection procedures and restoration checks in the design. If a weighing device is installed in a location inaccessible for maintenance, even if initial readings are good, regular calibration will not be sustained. Do not judge installation feasibility based solely on available space for the device; also consider workflow for construction, testing, cleaning, and replacement when making decisions.
Prepare the Required Input Table for the RFP
Before contacting suppliers, organize drawings and actual measurements of the existing conveyor. At minimum, gather belt width, speed range, inclination, transport length, idler spacing, trough angle, take-up method, material type, particle size, maximum/normal/minimum flow rate, power supply, PLC/SCADA configuration, outdoor conditions, and allowable downtime. Add actual dimensions from the skirt end to the candidate location, and from the candidate location to the head pulley, to the drawing. Accept “installation possible” responses only with dimensions and stated assumptions. Have suppliers return any missing information via a questionnaire, so you can see the exceptions in their quotations.
For output requirements, specify instantaneous flow, total accumulation, shift-based accumulation, equipment status, alarms, calibration flags, units, and handling during communication loss. If used for control, specify alarm response and delay; if for reporting, specify time synchronization and history granularity. The specification sheet should include not only the device, but also weighing idlers, speed detection, frame reinforcement, wiring, display, software settings, test material, reference scale, and operator training. For retrofitting existing equipment, it is important to include machine downtime and recovery conditions in the estimate scope.
| RFP Item | Information Provided by Factory | Supplier’s Required Response |
|---|---|---|
| Weighing Purpose | Process monitoring, accounting, shipment verification, trade, etc. | Applicable methods and excluded uses |
| Conveyor | Width, speed, inclination, rollers, tension, drawings | Installation location, required straight length, modification drawings |
| Material | Type, particle size, moisture, stickiness, flow distribution | Usable range and constraints |
| Measurement | Target section, reference scale for comparison, objective | Error definition, test method, calibration method |
| Integration | PLC, SCADA, MES, report tags | Signal list, communication method, behavior during faults |
| Maintenance | Cleaning, safety, spare parts, allowable downtime | Inspection procedures, on-site support, replacement conditions |
When comparing candidates, do not just line up the lowest main unit prices. Compare total costs including additional roller work, frame reinforcement, preparation of reference scales, test material circulation, downtime, spare parts, and annual inspections. For existing equipment, construction costs can exceed the main unit price, so it is important to align site survey assumptions first. The quotation should clearly state who will re-tension the belt, who will perform zero and span adjustments, and who will isolate causes if discrepancies arise during SAT.
Distinguish the Roles of FAT and SAT
During FAT (Factory Acceptance Test), check control panel wiring, load cell and speed input, indicator settings, PLC signals, alarms, communication loss, retention/reset of accumulated values, and date/time settings. Simulated signal tests that can be done off-site are important, but you cannot reproduce actual conveyor belt tension, material movement, or roller alignment. Even equipment that passes FAT will require reinstallation, zero adjustment, and actual material testing on site. Attach software versions, setting files, calibration factors, and I/O table versions to inspection records.
During SAT (Site Acceptance Test), sequentially check frame position and roller alignment per drawings, belt tracking, cable protection, maintenance access, empty belt zero, speed verification, simulated load, and actual material testing with representative material. Compare results at low, normal, and high loads, and if results are outside the target range, keep data from before and after adjustments. Secure routes for recovering test material, reference scales for weighing, and stoppable operation time at the construction planning stage. If you postpone material testing until “convenient” after handover, acceptance decisions and payment terms become ambiguous.
Define pass/fail criteria for values by application in the contract. For example, specify “accumulated value at normal flow,” “repeatability at low flow,” and “zero change after restart” as separate items. Do not confuse catalog accuracy with total field error. If specifying OIML R 50 class or test methods, confirm the intended application and local regulations. Do not erase adjustment history during testing and leave only final values. If conditions change before and after modification, record the differences in the acceptance record.
Managing Drift After Commissioning
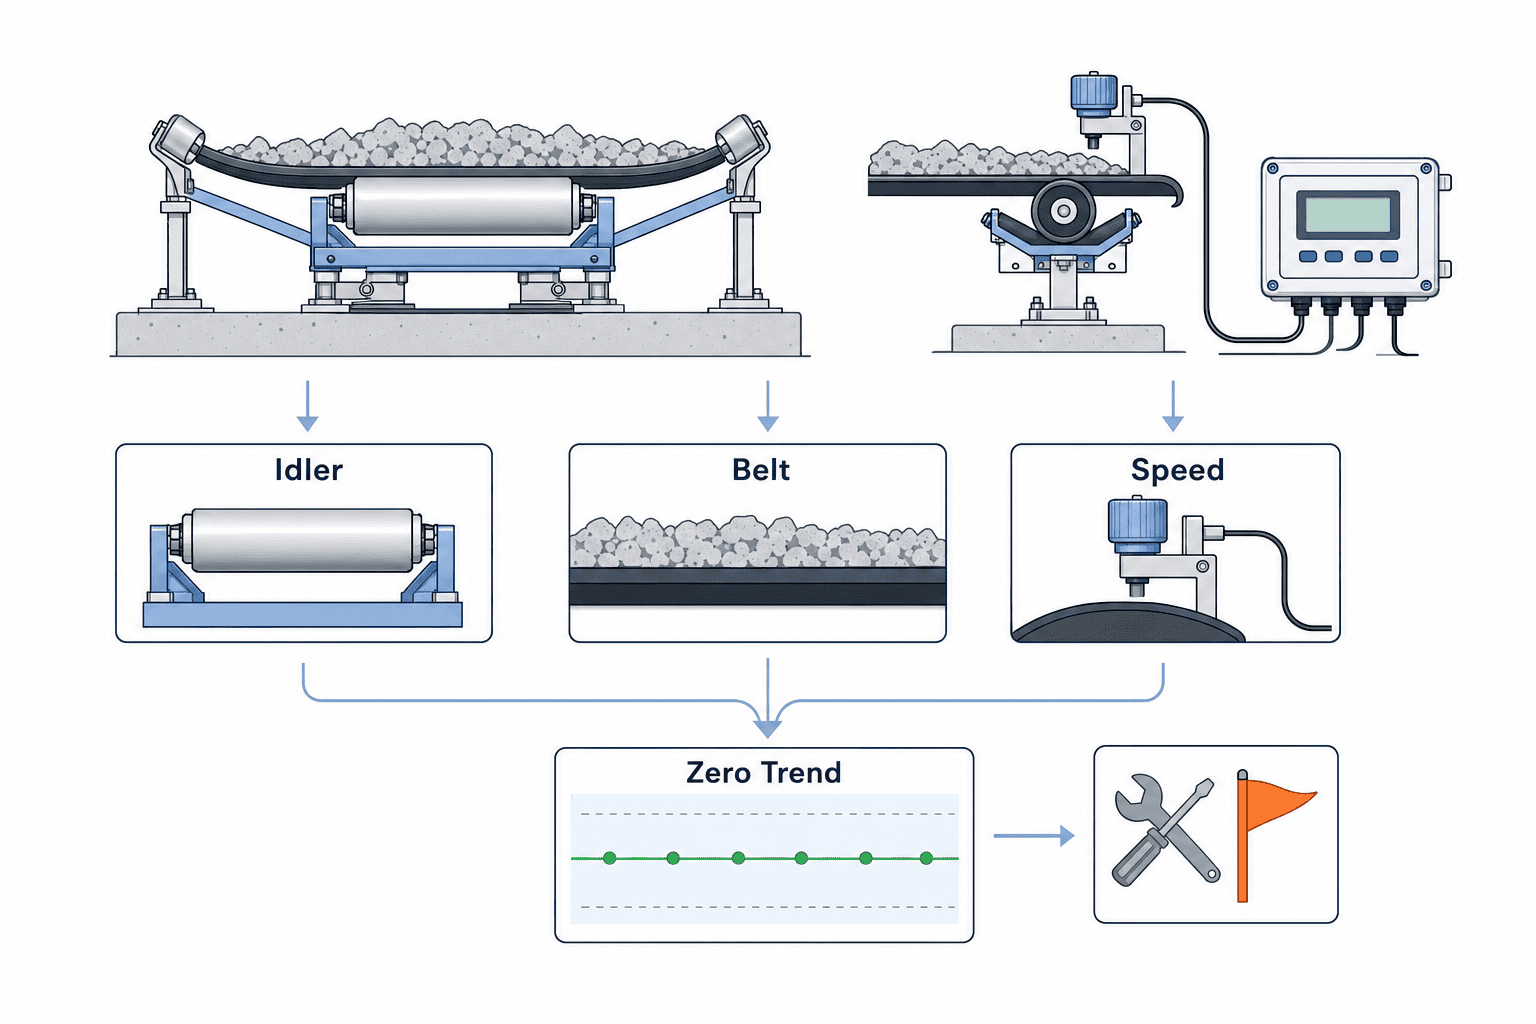
Passing the initial acceptance test is not the end point. Over time, factors such as roller contamination, belt wear, changes at the splice, tension adjustments, speed sensor slippage, and ambient temperature can all shift the indicated values. Siemens cites temperature and weather, conveyor maintenance, and build-up on the weighing frame, belt, and rollers as reasons for recalibration. During regular inspections, establish an order for checking speed, zero, simulated load, and material tests, and record what each inspection is monitoring. The inspection interval should be set based on process risk and historical fluctuations.
For monitoring, track zero deviation, abnormal flow fluctuations, belt speed, communication errors, accumulated values when speed is zero, and overload history. If the accumulated value increases when there is no material, if flow is indicated while the belt is stopped, or if the zero point changes daily with an empty belt, do not simply correct the instrument readings—inspect the equipment condition. Overlaying cleaning and roller replacement dates onto weighing history makes it easier to trace the causes of changes. Maintenance procedures should include lockout, restoration after cleaning, and conditions for re-zeroing.
The frequency of material tests cannot be the same for process monitoring and for trade use. For trade or legal applications, prioritize local regulations and certification procedures; for internal management, decide based on process loss risk and the availability of reference scales. Importantly, explicitly evaluate the assumption that after the initial calibration with actual material, only electronic simulation will be relied upon. Use maintenance records and measurement trends to predefine the conditions for retesting.
Design Examples for Raw Material Balancing and Control
The first example is monitoring raw material feed from a silo to a crusher. Place the weighing point just before the crusher, and use the difference in accumulated values at the start and end of operation as the crushed amount. If the weighing frame is placed immediately after the silo feed, material may bounce, so prioritize securing a stable section. Since material remains on the belt even after the crusher stops, specify in the operating procedure up to which point material is included in the batch. If the accumulated value is cut off the moment the stop signal is given, leftover material passing through afterward may be counted in the next batch. On the control side, treat belt operation, feeder operation, material detection, and accumulation enablement as separate signals.
The second example is a line that continuously mixes multiple materials. The instantaneous flow rates of each line are compared to monitor ratios, but if the transport times from each weighing point to the mixer differ, aligning values at the same time does not represent the same mixing interval. In control, account for these delays and adjust filters and alarm delays. Also, set conditions to stop ratio calculations when the denominator (flow) is near zero for stopped belts. For processes requiring blend assurance, decide with the quality department whether belt scale flow monitoring alone is sufficient or if additional batch scales or product inspections are needed.
The third example is reconciling the amount conveyed before shipment with the truck scale. Differences between the two can be due not only to instrument error but also to material left at the conveyor end, spillage, moisture, different weighing times, and return routes. If you uniformly reflect the difference for each shipment in the belt scale’s calibration factor, you may obscure the real cause. First, fix the start/end conditions for belt scale accumulation and the scope of truck weighing, then break down the difference into “measurement,” “inventory,” and “loss” for investigation. If setting an allowable error, check the results of several representative shipments and the status of the reference scale. All three examples show the need to distinguish between the instrument functioning correctly and the business numbers matching.
Troubleshooting Sequence When Abnormalities Occur
If the total amount consistently drifts in one direction, first confirm that the comparison period and material match. Next, independently check the speed display, then observe the zero point with an empty belt and the load response under load. If speed is correct but zero has shifted, inspect for contamination on the weighing frame, material stuck to the underside of the belt, and roller seizure or deformation. If zero is stable but only the loaded value is off, check for material bias, belt tension, skirt contact, and differences between test weights and actual material. At any stage, if you change settings to eliminate symptoms before investigating, you may lose evidence of the cause.
If values spike intermittently, compare the cycle of belt splices passing the weighing section, the cycle of lumps falling from the feed chute, electrical noise, and sensor cable damage over time. If the zero point slowly changes with seasons or shifts, overlay temperature, sunlight, washing, rain, and the timing of cleaning or maintenance. If discrepancies only occur when changing materials, check not only bulk density but also particle size, load bias, adhesion, scattering, and feed position. In the abnormality diagnosis log, record “symptom,” “occurrence condition,” “observed value,” “mechanical inspection,” “electrical inspection,” “reference scale status,” and “changed settings” line by line. Avoid operations where the correction factor is changed every time without explaining the cause.
Set boundaries for recovery decisions as well. Distinguish between minor alarms that allow continued operation and failures where accumulated values cannot be used for business records. For material conveyed during periods when weighing values are invalid, decide in advance whether to fill in with estimates, reweigh using another scale, or leave as missing data in reports. If missing data is recorded as zero, it will appear as if no material was used even though it actually flowed. After calibration is performed post-recovery, ensure that values before and after calibration and the affected lots can be traced.
Procurement and Operation Structure in Thai Factories
When procuring overseas-made equipment for Thai factories, check not only the main unit lead time but also the local inventory and support system for load cells, speed sensors, indicators, and idlers that can be replaced on-site. Decide who will diagnose the cause of failures, who will stop the belt, and who will approve production restart after calibration. Include English and Thai operation and inspection procedures, equipment drawings, setting backups, and training in the handover package. Even if the manufacturer provides remote support, separately define factory network connection approval and information management.
For maintenance cost comparison, check how many shutdowns per year are required, how many tons of material are needed for actual tests, whether material can be recovered, and whether a reference scale can be arranged. These are equipment-specific, so this article cannot provide fixed prices. If the supplier offers “accuracy guarantees,” include acceptance test conditions, target materials, flow ranges, responsibility for site modifications, and retesting costs in the contract. To reduce disputes after procurement, do not leave expected figures only in the equipment specifications—incorporate them into test plans and responsibility assignments.
FAQ|Questions About Belt Scale Accuracy and Implementation
What accuracy percentage should I choose for a belt scale?
First, determine the application and comparison method. The requirements differ for short-term flow monitoring versus long-term accumulation, and for internal management versus commercial transactions. For the manufacturer’s nominal value, check the definition of that value, target flow range, installation conditions, and whether actual material tests are included. Do not set targets based only on catalog numbers—survey the existing conveyor and document achievable acceptance conditions with the supplier.
Can a belt scale be retrofitted to an existing conveyor?
Retrofitting is sometimes possible, but requires straight sections, roller arrangement, tension, distance from skirts and pulleys, frame rigidity, and maintenance space. You need not only drawing clearances but also actual measured positions and belt condition. After a site survey, have the supplier specify the scope of weighing frame integration and required modifications.
Can a belt scale be accepted using only test weights?
Test weights and test chains are effective for calibration and inspection, but do not fully reproduce the bias and belt behavior when actual conveyed material passes. The basic approach is to design for material testing and compare with an independent reference scale using the same batch of material. For trade use, check local legal procedures.
How is a belt scale different from a checkweigher?
A belt scale measures the flow and cumulative amount of bulk material in continuous motion. A checkweigher measures discrete items such as packaged goods in transit and is used for pass/fail judgment of each item. The measurement principles, test materials, and required record units differ. If the target is bags or boxes, first decide whether you want to manage individual weights or know the total amount for the entire line.
Can it be used with variable-speed conveyors?
OIML R 50 covers variable speed, but whether a specific device meets performance requirements across all speeds depends on the model and installation conditions. Confirm with the supplier the speed sensor method, signal resolution at low speeds, and accumulation processing during acceleration/deceleration, and test within the actual usage range.
Conclusion
Selection of a conveyor belt scale does not start with the model number of the load cell or indicator. First, define the operational significance of the weighing point, target material and flow range, condition of the belt, idlers, and speed detection, and the method for actual material testing. Include site conditions and responsibility assignments in the RFP, check electrical and communication aspects at FAT, and verify with the actual belt and material at SAT. Even after commissioning, keep records of zero, speed, simulated load, and material reconciliation to ensure the data remains usable for process decisions.
Even if you are only considering retrofitting to an existing conveyor or adding a weighing point to a new line, as long as you have a transport drawing, material, flow estimate, and intended use, you can contact us for consultation. We can help organize the weighing location and the conditions required for on-site testing.
Reference Information
- OIML R 50:2014 — Continuous totalizing automatic weighing instruments (belt weighers)
- OIML R 50-1:2014 — Metrological and technical requirements
- Siemens, Belt Scale Application Guidelines
- Siemens, Milltronics WD600 Operating Instructions
- Thermo Fisher Scientific, Belt Conveyor Scale Handbook
- Siemens, Belt scales and recalibration
- Siemens, What keeps my belt scale from providing the accuracy I need?


