


When selecting a compressed air flow meter for a factory in Thailand, comparing pipe sizes and maximum rates in catalogs is not enough to produce usable data. First decide where to measure, which decision the measurement will support, and what flow condition the number represents. Supply from the compressor, consumption by a production line, and the base load during a shutdown are different quantities. A meter may be working correctly while the resulting business decision is wrong. This guide takes purchasing and engineering teams through specifications, installation, FAT, SAT, and data integration.
Define the measurement purpose before selecting a compressed air meter
A compressed air network has a supply side and a demand side. The U.S. Department of Energy and Compressed Air Challenge sourcebook treats compressors, treatment, distribution, and points of use as one system. It puts baseline operating conditions and data collection at the start of improvement work. A flow meter is one observation point in that system. One meter at the inlet does not identify which production line consumed the air. Meters on every branch do not help if their accounting boundaries overlap.
Write a one sentence use case: “monitor total supply downstream of the compressor room,” “record assembly line A’s consumption by shift,” or “quantify the base flow that remains during a planned stop.” Mark the associated pipe segment and excluded branches on a P&ID or a verified site drawing. Then agree on the time resolution, reporting unit, asset boundary, and operating events required. Cost allocation needs reliable cumulative volume and clear ownership of shared branches. A short air-blow event needs sufficient response and sampling speed. Operational optimization needs the flow trace aligned with pressure, compressor power, and running states.
Avoid saying that the meter directly measures energy savings. Flow describes air use; electricity consumption and cost require separate measurements and tariff assumptions. A before-and-after comparison should record production output, shifts, pressure setpoints, and equipment utilization. The meter’s useful role is to establish an observation point that reveals candidates for improvement and remains available after a change. The practical process for finding individual losses is covered in our compressed air leak detection guide.
Standard volume and actual volume are different quantities
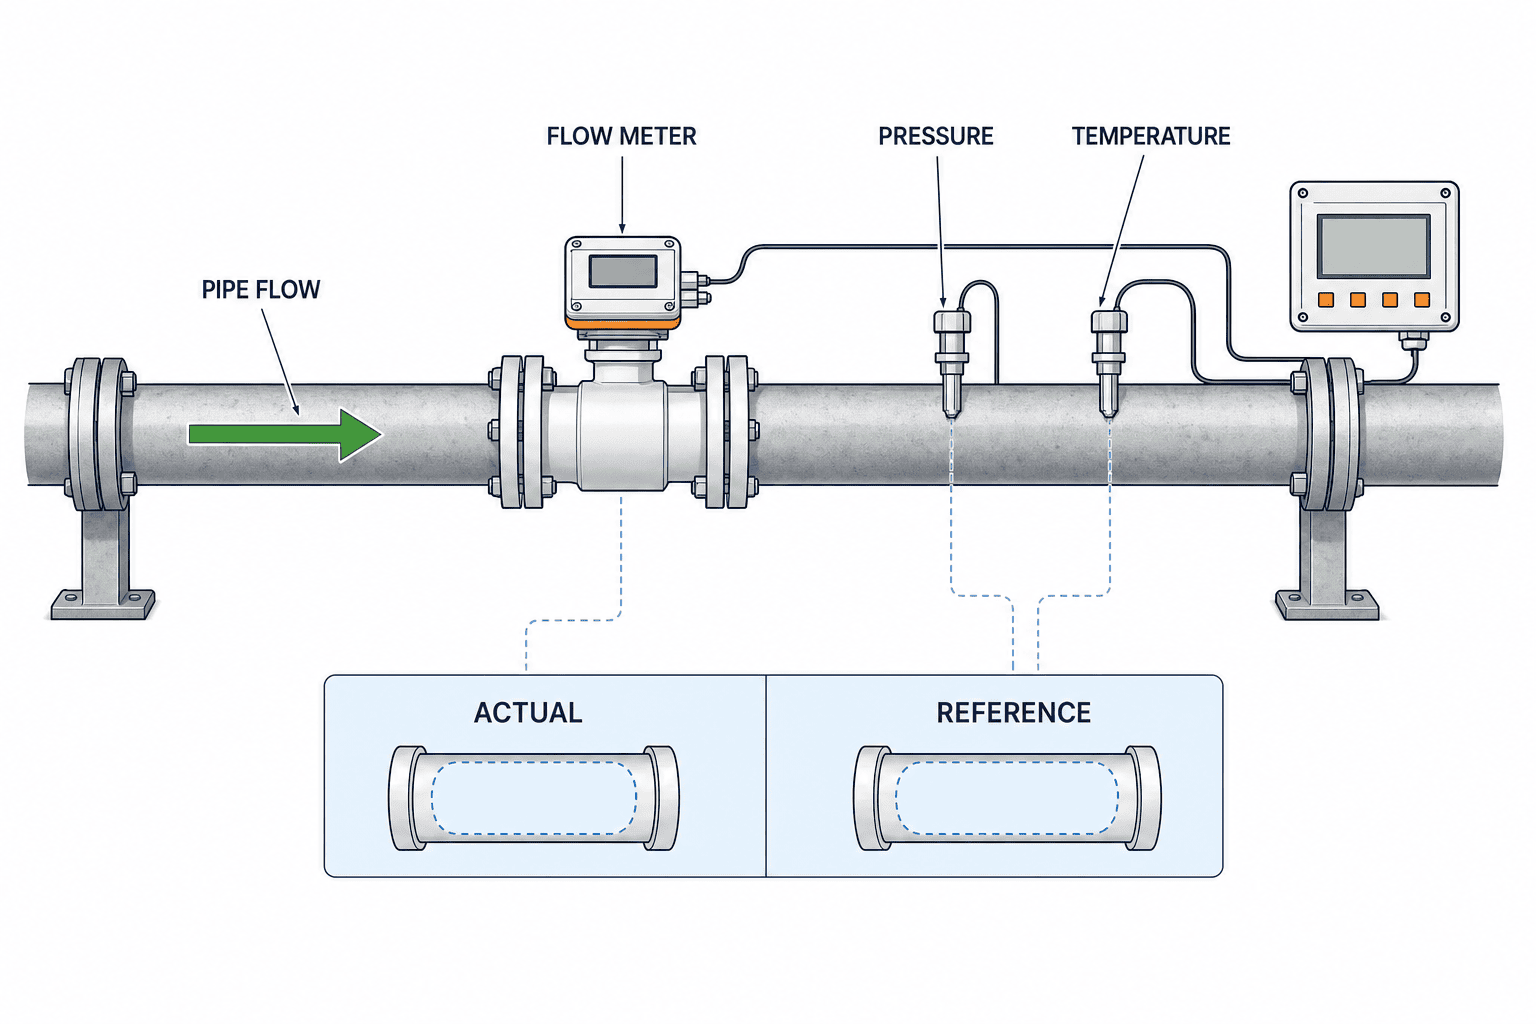
If a quotation lists only “m³/h,” “Nm³/h,” or “L/min,” ask which reference state applies. Actual volume flow in the pressurized pipe varies with operating pressure and temperature. Standard or reference volume flow expresses the amount of air as a volume at a separately specified reference pressure and temperature. The two numerical values can differ for the same amount of air. Even a mass flow sensor may convert its output to a reference volume for its display or communication register.
The SICK FTMg operating instructions describe selectable reference conditions. Examples in that manual include DIN 1343 at 1.01325 bar absolute and 0°C, ISO 1217 at 1 bar absolute and 20°C, and ISO 2533 at 1.01325 bar absolute and 15°C. ISO 1217 itself specifies acceptance test methods for displacement compressors. A reference setting named ISO 1217 on a meter does not mean the meter has an “ISO 1217 certification.” Keep the convention for reporting volume separate from a claim about product approval.
If the supply meter and production-line meters use different reference temperatures, comparing their totals may create an unexplained apparent imbalance. In the RFP specify the reporting reference pressure in absolute units, reference temperature, unit for instantaneous and totalized flow, and the location responsible for conversion. Confirm that the device display, PLC, and dashboard use the same convention. Gauge pressure, bar(g), is not absolute pressure, bar(abs). When a conversion is applied, document how moist air, compressibility, and the selected reference state are treated. Do not use an undocumented spreadsheet factor to make the totals match.
Four values that make a flow number comparable
Store at least the measured flow value, its unit and reference state, simultaneous pipe pressure and temperature, and the device quality status. You may not need all four for routine control, but they allow an engineer to explain disagreements later. Some models include pressure and temperature sensing. For example, ifm’s SD technology description describes a thermal measurement principle and integrated pressure and temperature sensing in that product family. Outputs, range, and accuracy still depend on the selected model and must not be copied as universal meter specifications.
Size the meter from low flow as well as maximum flow
A meter that fits the pipe diameter may fail to resolve flow during a shutdown, changeover, or lightly loaded shift. Estimate the normal minimum, representative, and brief maximum separately from recent operating information. If no permanent meter exists, document the sources and uncertainty of compressor records, machine duty cycles, or temporary measurements. Do not equate a compressor’s nominal delivery capacity with a line’s actual use. Record an anticipated expansion as a separate future case, with its expected date and added demand, rather than oversizing the current meter until its low-flow range becomes useless.
Ask each bidder for normal and extended measurement ranges, behavior near zero, and the error equation in the same comparison table. “Percent of reading” and “percent of full scale” have different consequences at low flow. The SICK FTMg manual, for example, gives different accuracy expressions by nominal diameter and by standard or extended range. Use the latest data sheet for the actual model, medium, and range being purchased. Do not apply a number quoted for one size to all sizes or another brand.
A large advertised turndown ratio alone is not a decision rule. Check whether the minimum flow is in the guaranteed accuracy range or merely displayable. Check whether a configurable low-flow cutoff suppresses the volume you hope to measure during planned stops. Near-zero behavior is central when the purpose is to understand base use. Conversely, a long averaging filter can smooth a short burst until its peak disappears or its relationship to a process event becomes unclear. Specify the observation interval first, then compare meter response, filtering, and communication update rates.
Build the sizing table around three plant operating cases as well as each candidate’s maximum rating: normal production, equipment shutdown, and a brief period when several air-blow devices operate together. Give a range for each case and state the evidence behind the estimate. Do not present an unmeasured assumption as a confirmed value. Overlay those cases on the instrument’s guaranteed range. This makes it clear whether the shutdown flow lies below that range or the peak exceeds its upper limit. Pipe-size selection alone often misses one of these extremes. If one device cannot cover both, consider prioritizing the principal use case, dividing the measurement boundary, or using instruments with different ranges. Record the chosen compromise so dashboard users understand what the meter can and cannot resolve.
Do not confuse piping design flow with actual consumption when comparing ranges. If the original simultaneous-use assumption no longer reflects plant operations, sizing from the design figure can push everyday flow toward the bottom of an oversized meter. Conversely, sizing only from today’s average may miss a product change or seasonal peak. Reconcile the machine list, compressor operating records, and line-stop history. Label each number as measured or estimated; that distinction is the starting point for a fair vendor comparison.
Compare thermal and other technologies against the actual application
Thermal mass, differential pressure, vortex, and ultrasonic devices may all appear in a compressed air project. A technology label does not decide the purchase. Evaluate the required flow range, pipe diameter, air quality, shutdown window for installation, accuracy conditions, and maintenance capability on the same grid. A thermal sensor uses the cooling effect of flowing gas on a heated element; the particular implementation is model specific, as ifm explains for its SD family. Do not assume that every thermal instrument is entirely unaffected by pressure and temperature. Read the guaranteed operating conditions and the display conversion rules.
A differential pressure device derives flow from the pressure difference across a restriction, so range and additional pressure loss need joint review. Ultrasonic configurations may be clamp-on, in-line, or insertion types, each with distinct requirements for pipe material, wall thickness, and suitability for gas. Vortex devices also need a suitable velocity range and installation geometry. These are questions to resolve from model-specific documentation, not a universal ranking of technologies. In a procurement comparison, columns for medium, range, error, installation, outputs, and service requirements are more useful than a single “measurement principle” column.
Water, oil, and particles in the air may affect sensor cleanliness or equipment suitability. Conditions upstream of the dryer, downstream of a filter, and at the end of a production branch differ. Characterize the medium at the planned measurement point and confirm the meter’s permitted air quality. Our compressed air dew point monitoring guide discusses the related moisture measurement. A flow meter with built-in pressure and temperature measurement does not necessarily measure dew point or contamination class.
Installation needs more than an open space on the pipe drawing
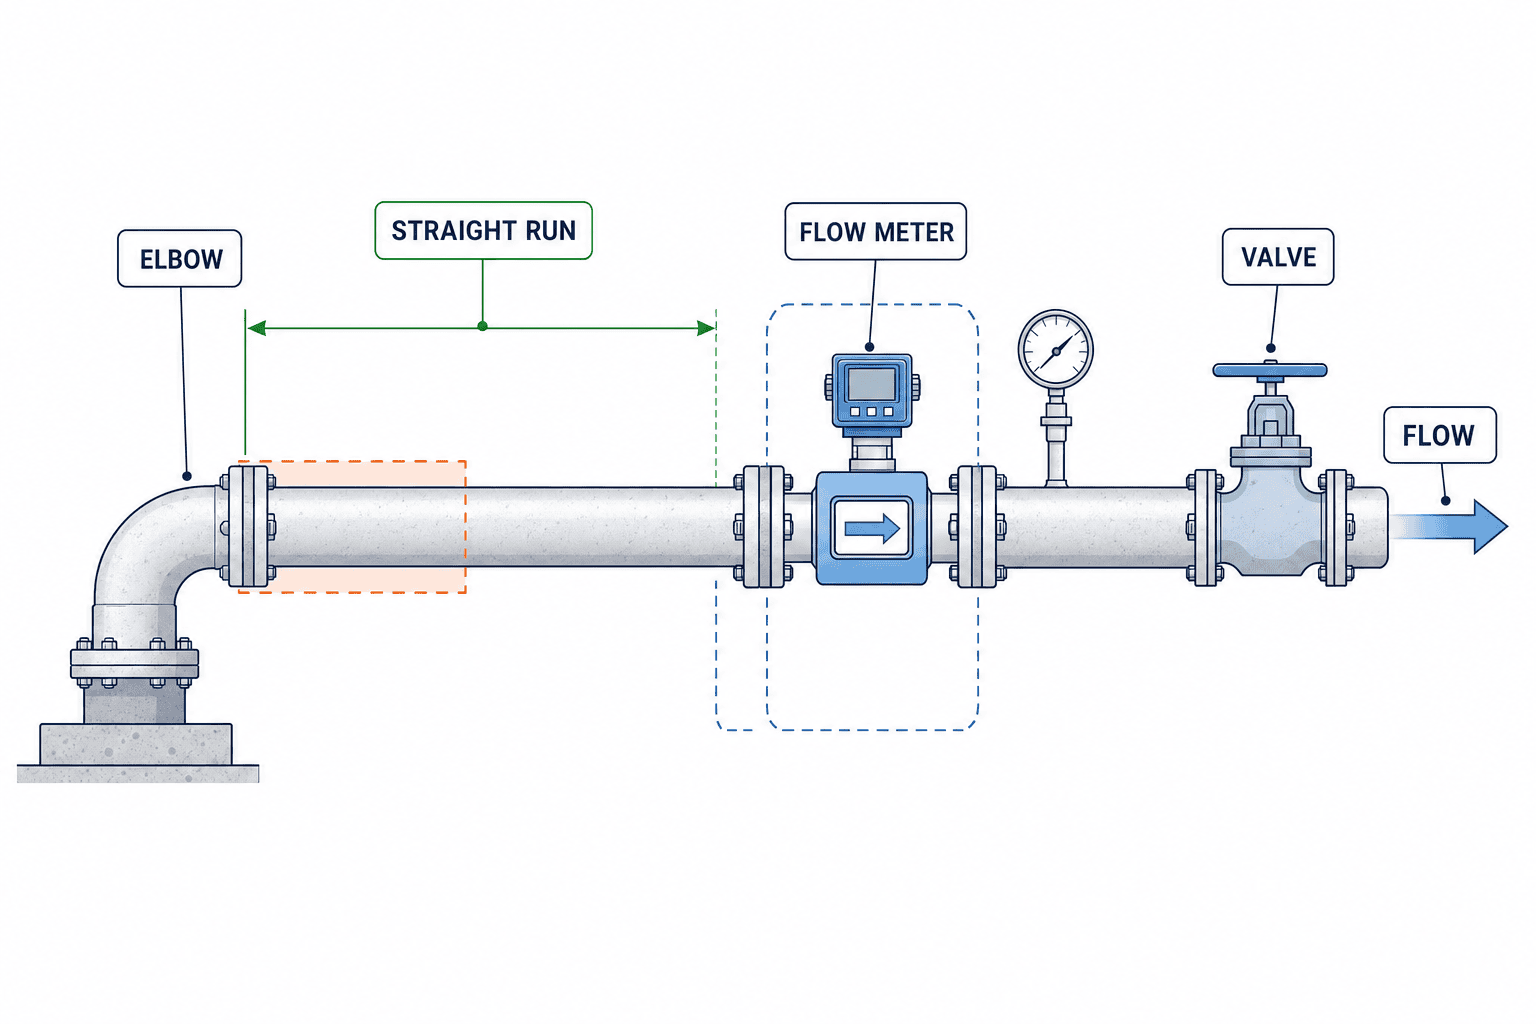
Before finalizing a model, photograph and measure the available straight pipe, flow direction, valves, elbows, reducers, tee branches, and drain points. Disturbed flow can prevent a meter from achieving the performance stated under its test conditions. As one model-specific example, the SICK FTMg manual lists 25×DN upstream and 5×DN downstream for a 90° elbow, and 50×DN upstream and 5×DN downstream for a valve. These are minima for reproducible measurements; the same manual separately recommends 100×DN upstream to achieve the specified measurement accuracy. These figures are not a universal rule for every flow meter. If the required lengths are unavailable, ask the vendor to evaluate a different location, a flow conditioner, another technology, or a documented effect on measurement uncertainty.
That manual also calls for flow in the marked arrow direction and separation from disturbances. Where reverse flow is possible, confirm whether the proposed device can distinguish its direction and how the totalizer handles it. Include isolation, bypass arrangements where needed, removal clearance, safe access, and electrical isolation in the installation design. A meter that maintenance staff cannot reach for inspection, cleaning, or recalibration may not retain its day-one performance.
Request a pressure-loss estimate for the complete proposed installation, including a conditioner where applicable. Additional loss can matter to a production branch with little pressure margin at the end user. Do not assume that every device is lossless or can be mounted anywhere. For each candidate location, check pressure during normal and peak operation and fix its position relative to dryers, filters, and regulators on the drawing. The work instruction should cover the plant’s shutdown procedure, depressurizing, pipe cleanliness, and a leak check after repressurization.
Integrate the meaning and timestamp of the data, not just its value
A readable local display does not guarantee that the PLC or MES receives usable information. In procurement, list how instantaneous flow, cumulative volume, pressure, temperature, device health, and fault codes will be acquired. ifm lists compressed air flow meter product choices, while the FTMg instructions describe analog, IO-Link, and Ethernet options by variant. Confirm the features of the exact selected unit and the compatibility of the existing plant controls. Availability somewhere in a product family is not proof of compatibility with a specific PLC.
For a 4–20 mA signal, define scaling into engineering units, open-wire behavior, high-end saturation, and the method of totalization. For pulse outputs, define volume per pulse, power-return behavior, and counter rollover. For IO-Link or a network connection, define tag names, data types, update interval, units, quality bits, and what happens when communication is lost. Seeing a plausible number on a screen is not enough. At the same timestamp and in the same units, compare raw PLC data, local display, and historian or MES values. Confirm that flow changes produce reasonable totalizer increments.
When a Thai plant compares data with another facility or headquarters, document the relationship between Thailand time (UTC+7), device time, and server time. Misaligned clocks can falsely suggest that a stopped line consumed air. Preserve source units and quality flags in raw records; if a dashboard converts units, publish the rule. A missing signal must remain missing, not be silently filled as zero flow, or both totals and improvement estimates can be distorted.
For line-level allocation, define the parent and child pipe hierarchy and treatment of shared equipment first. If a parent meter and sum of child meters differ, investigate unmeasured branches, time alignment, reference states, reverse flow, and missing data as well as meter accuracy. Apply alert thresholds by operating mode where appropriate: night shutdown and production peak need different context. Set those thresholds from commissioning data instead of promising an arbitrary reduction percentage in advance.
What a compressed air flow meter RFP should contain
An RFP that asks only for “one 50A compressed air flow meter” leaves the scope of pipe work, electrical supply, calibration, PLC connection, and acceptance to each bidder. Prices then cease to be comparable. Ask for responses in the same structure. Where values are not yet measured, label them as estimates, note their confidence, and identify what a site survey must confirm.
At the survey stage, record internal diameter and connection standard, not just visible outer diameter. Capture insulation, usable straight sections, power source and earthing, spare PLC terminals, and cable distance to the panel. For pipe alterations, agree on the available shutdown window, leak check, cleanliness check, and the owner of restoration. Imported devices and local installation may be under separate contracts at a Thai site; assign responsibility for drawing approval, procurement, mechanical work, instrumentation, and software. Classify requirements as mandatory, desirable, or pending site verification. Keep proposal versions, accepted model numbers, and reasons for rejection so the comparison remains auditable.
| Item | Specify in the RFP | Evidence requested from bidder |
|---|---|---|
| Purpose and point | Target line, boundary, use of rate and total | P&ID position and installation drawing |
| Medium | Compressed air, expected oil, water, and particles | Permitted medium and quality conditions |
| Flow | Normal minimum, typical, short peak, expansion case | Model-specific range and accuracy equation |
| Reference state | Absolute pressure, temperature, units, conversion owner | Configuration example and data dictionary |
| Piping | Diameter, material, straight run, valves, shutdown window | Installation drawing, required runs, pressure loss |
| Electrical and data | Power, PLC terminals, protocol, update interval | I/O list and communication specification |
| Maintenance | Cleaning, calibration, replacement, isolation | Service procedure and calibration evidence |
| Acceptance | FAT/SAT tests, criteria, witnesses | Test plan and record form |
Break down the price into instrument, piping, shutdown labor, panel changes, cabling, gateways, software configuration, calibration, commissioning, training, and service. State exclusions and work assigned to the plant. If a calibration certificate is required, check its measurement points, range, reference conditions, recalibration process, and cost. A data sheet’s instrument accuracy is not automatically the uncertainty of the installed measurement system.
Before scoring proposals, confirm that all bidders received the same site conditions. If one bidder missed the upstream elbow, its quoted pipe work and straight run may look artificially attractive. Distribute answers to questions as a versioned addendum to every bidder. Track changes to diameter, connection, air quality, and reference state. For anything marked “to be decided after site survey,” set a survey deadline and decision owner; otherwise a low quoted price can turn into extra work or delay. Mechanical, electrical, and information-system owners should sign off on the same drawing for the pipe cut, shutdown authorization, and PLC modification boundary.
Add a column to the evaluation sheet stating what each measured value will be used for. Maintenance trend monitoring places weight on missing-data alerts and replaceability. Cost allocation by line needs continuity of totalizers and unambiguous pipe boundaries. Production traceability needs timestamps aligned with process events. That use-case column explains why a network feature is required or why it is unnecessary. Record the requirements met and the remaining constraints as well as the selected model, so later changes in placement or configuration have a clear basis.
FAT and SAT: test whether the meter is usable
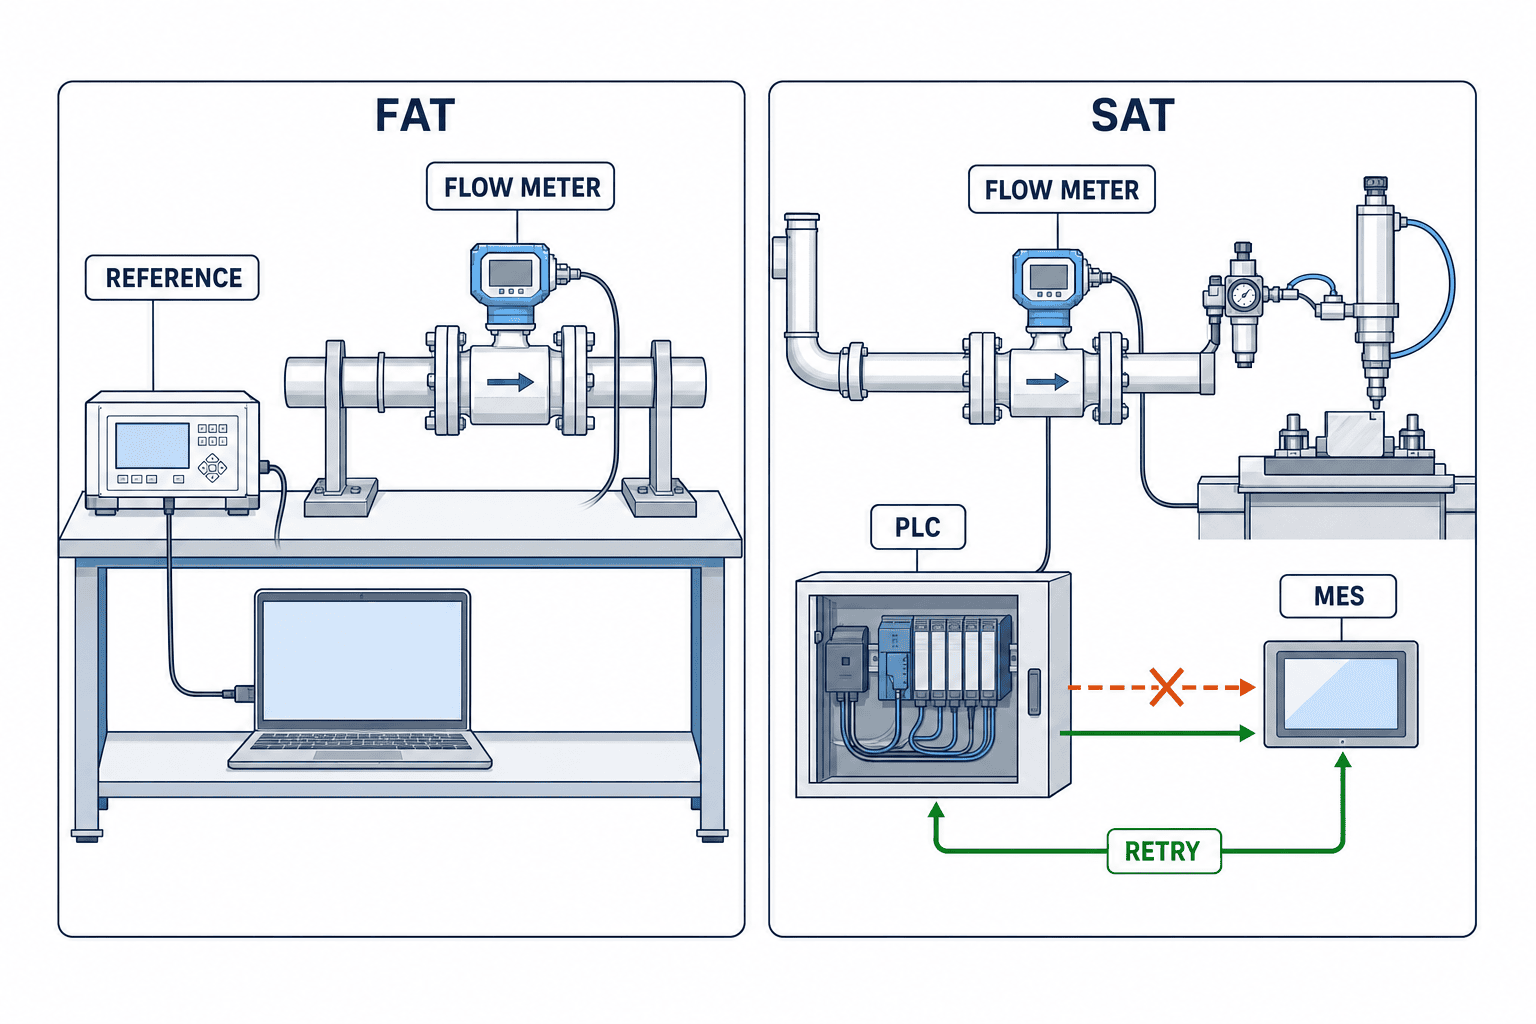
FAT, before shipment, is the opportunity to inspect the hardware, setup, I/O, and communications. Record model, size, firmware, medium and reference-state settings, range, tag names, alarms, and totalizer behavior. If test equipment can provide representative points, compare them with the calibration record. Separate instrument functions that can be checked at the vendor’s facility from installation behavior that must be checked at SAT. Passing FAT cannot correct a short straight run or reversed mounting at the plant.
At SAT, verify flow direction, orientation, upstream and downstream runs, leakage, power, communications, timestamps, and units on the actual pipe. Observe near-zero and representative flow as the line transitions between stopped and running states. Record local display, PLC, dashboard, and cumulative volume at the same times. If an independent reference meter or other defensible comparison is available, define its conditions and tolerances in the test plan before testing. A display that merely looks plausible is not proof of absolute accuracy. Keep checks of repeatability and signal quality separate from an absolute-accuracy verification.
Test what happens to the total when communications fail, power returns, a meter is replaced, or the PLC restarts. A totalizer reset can make recorded consumption appear to fall. Decide whether the system will keep a monotonic cumulative total or store the reset event and previous value for reconstruction. Distinguish a device fault from a process alarm; a broken wire must not silently become “zero flow.” Retain the pressure, temperature, flow, operating mode, and timestamps at each test, not only the pass/fail result.
For data acceptance, independently record the time when the test operator stops and restarts a machine, then compare it with the flow change on the screen. Reading a displayed number aloud is unlikely to reveal communication latency, clock drift, or a missed totalizer increment. If the PLC and local display disagree, check units, reference state, analog scaling, averaging settings, and display update interval before concluding that the sensor has failed. Include a simulated fault, a short communications interruption, and recovery in the plan. Verify that the affected period can be identified later as missing or invalid data.
Classify each open SAT issue as instrument performance, mechanical installation, control setup, or display and aggregation logic. Name an owner, a repeat-test method, and which data can be used during temporary operation. Do not hand over a test sheet with an unresolved pass/fail cell and no explanation. If absolute accuracy cannot be verified directly on site, state that limitation and distinguish what the calibration certificate proves from what the installation checks prove. This prevents every future data difference from being labeled a sensor fault.
Keep an acceptance record that can be audited
“The number appeared on the PLC” is too vague for acceptance. Collect local display readings, raw and scaled PLC values, MES or historian readings, initial and final totalizer values, communications status, configuration version, and installation photographs as one package. Practical criteria include agreement on units, clear distinction between faults and low flow, and a trace that follows flow changes under the agreed operating modes. Numerical tolerances depend on the chosen instrument and comparison method; put project-specific values in the approved RFP test plan. After acceptance, record who changed a setting, why, the old value, and any repeat test.
Use the first 30 days to establish an operating baseline
Do not judge project results from a single day of readings. Product mix, changeovers, shifts, and maintenance alter air demand. Choose an initial observation period that includes normal operation, planned stops, start-ups, and busy periods, and attach production output and equipment state to each period. The DOE and Compressed Air Challenge sourcebook includes baselining and continued monitoring in its improvement approach. What counts as a representative period depends on the plant’s actual schedule.
Review the base flow during stops, volume per unit of production, short peaks after process events, and the relation between flow and pipe pressure as well as daily totals. Investigate a change against production and maintenance logs before assigning a cause. Air use during a stop might be a leak, but it may also be an intended purge or standby function. Keep measurement location and configuration fixed across a before-and-after comparison, or record the break in comparability. Treat the purchased meter as the start of observation; evaluate a separate improvement action under comparable conditions.
Segment baseline data by shift, product, and reason for a stop rather than relying only on a daily average. A maintenance shutdown and normal production on the same weekday have different air-use patterns. Including missing periods or changed meter settings in an average can create apparent improvement or deterioration. Tag intervals as normal operation, changeover, shutdown, or missing data, then define which are comparable. Keep the baseline owner, approver, included periods, and reasons for exclusions so another engineer can repeat the analysis next month.
When selecting improvement candidates from the initial data, do more than rank lines by absolute flow. Ask whether use is proportionate to production, whether air continues flowing during a stop, and whether pressure at the end user is adequate. A lower flow after a change is not a saving if output fell at the same time. To claim lower electricity use, also measure compressor-side power and operating mode and examine their relationship with air consumption. Meter data supplies hypotheses and a record for following an intervention; it does not establish the cause by itself.
Add routine data-quality checks to plant operations. Each month review missing communication intervals, zero behavior, outliers, and setting changes. After pipe modifications or filter work, confirm that installation and flow conditions have not changed unexpectedly. Set the calibration interval to the use case, manufacturer advice, and internal quality requirements. For a critical line, decide in advance whether a replacement meter or spare parts are needed to restore measurement quickly.
FAQ: installation, thermal meters, RFP and FAT/SAT
Is one flow meter just downstream of the compressor enough?
It may be appropriate for total supply, but it will not identify consumption by individual lines. Place meters at boundaries that match the pipe branches and the intended accounting. Conditions also differ around dryers and filters, so check each proposed position.
Does a thermal meter eliminate the need for temperature and pressure sensing?
Internal compensation and integrated sensors depend on the model. Decide what you need to record for volume reporting, diagnosis of pressure variation, and quality control. The word “thermal” alone does not decide which additional measurements are needed.
What if the required straight run is unavailable?
Compare another location, a suitable flow conditioner, or a different measurement technology. A conditioner may add pressure loss and cost. Required lengths depend on the manufacturer, model, and upstream disturbances; submit the site drawing to the bidder for a documented decision.
Can we compare bids by requesting “±1% accuracy”?
No. Define whether the percentage is of reading or full scale, and agree on range, medium, pressure, temperature, reference state, and installation conditions. Tie a proposal number to the selected model’s guaranteed range and the acceptance method.
Can energy savings be a FAT or SAT acceptance criterion?
Meter acceptance should cover installation, configuration, signals, records, and agreed comparison tests. Energy results depend on a separate operational change and its conditions, so evaluate them separately. Record electricity, production, shifts, and pressure setpoints for that evaluation.
Summary: choose a measurement system, not only a readable display
Compressed air flow meter selection begins with purpose and pipe boundary. Agree on actual versus reference volume, compare ranges including low flow, and examine technology against the medium. Carry straight-run requirements, air quality, pressure loss, data meanings and time, and FAT/SAT criteria into one procurement specification. When the point and the future use of its data are clear before purchase, both vendor comparison and later improvement decisions become more concrete.
If your Thai factory is still mapping measurement points, drafting an RFP, or planning PLC and MES integration, you can start with a pipe drawing and a short description of the decision you want to make. Contact TOMAS TECH to discuss the conditions already known.
Primary references
- U.S. DOE / Compressed Air Challenge, Improving Compressed Air System Performance: A Sourcebook for Industry
- ifm, SD flowmeters use thermal technology
- ifm, Air flow meters for compressed air and industrial gas
- SICK, FTMg Operating Instructions
- ISO, ISO 1217:2009 Displacement compressors — Acceptance tests
*The straight-run lengths and reference-state figures above are examples from cited product documents. Check the latest specifications for the model purchased and the conditions at the installation point.*


