


You collected quotations for a business system development project from three vendors, lined them up, and found the totals varied by more than a factor of two, which made comparison impossible. In the enquiries we receive from Japanese-owned factories in Thailand, this happens almost every time. The cause is not a difference in vendor skill. The price of a quotation is set not by “what you build” but by “what you connect it to.”
Here is the conclusion up front. For a business system used on a factory floor, the cost is not dominated by building screens and reports. The largest single block of money, and the usual reason projects fail, sits in the integration interfaces to the existing core system (ERP), the production management system, and the equipment on the line. In the model calculations later in this article, that integration work accounts for 40.0% to 64.7% of the total investment, depending on whether you connect to one system or three. In our own published cost breakdown of a handheld terminal rollout, integration development was about 55.8% of the initial investment while the terminals themselves were about 26.3%. “The wiring costs more than the hardware” is not a metaphor here. It is measured data.
There is one more factor that cannot be ignored as of August 2026. Mainstream maintenance for SAP ERP 6.0 (ECC 6.0) enhancement packages EHP 6, 7 and 8 ends on 31 December 2027. At first glance this looks like a headquarters problem in Japan. But if the ERP at head office changes, then whatever your Thai plant’s shop-floor systems are connected to also changes. For an overseas site, this is a change to integration requirements that arrives from outside your control.
This article walks through how to break the cost into five layers, the structural reason Layer 3 (the integration interfaces) becomes the largest line item, two THB-denominated model calculations with sensitivity analysis, five points to settle on paper before you place an order, the tax and talent issues specific to Thailand, and a 90-day roadmap that ends with a frozen integration specification. Every calculation is shown in full. The goal is that by the end you know exactly which line of a quotation to ask about.
Why business system development goes wrong when the conversation starts with “what we want to build”
Let us start with the structural reason so many projects take a wrong turn in the first thirty minutes.
The requester speaks in screens, but the cost is decided by the wiring
Requests that come in from the factory floor are almost always written in the language of screens. “We want to enter production results on a tablet.” “We want to photograph defects and put them into a report.” “We want to do stocktaking on a smartphone.” These are legitimate requests. The people who do the work naturally describe it in the language of the work.
The people building the quotation, however, do not stack up money in units of screens. They stack it up in units of where the data comes from and where it goes. That one-line request, “enter production results on a tablet,” decomposes on the implementation side into the following.
- Where do the item master and the process master come from (the ERP? the production management system? Excel?)
- Where do the entered actual results go back to (nowhere? to the ERP once a day? in real time?)
- Are the actual results reconciled against equipment run signals (pulled from a PLC, or keyed in by a person?)
- When a transmission fails, who notices, and where?
Depending on the answers to those four questions, the man-hours for the same “tablet entry screen” can vary several-fold. The number of screens is identical; the number and direction of the connections is not. Most of the reason competing quotations vary by more than a factor of two is that each vendor priced a different set of assumptions about what gets connected. It is not a difference in skill. They are reading different specifications.
Investment trends in Japan have also shifted from “build” to “reconnect”
This is not just a gut feeling. In the JUAS *Corporate IT Trends Survey 2026*, supervised by Japan’s Ministry of Economy, Trade and Industry (fieldwork September to October 2025, preliminary figures released on 2 February 2026), the share of companies increasing their IT budget was 52.6%. What matters is the ranking of the reasons.
| Reason for increasing the IT budget | Share |
|---|---|
| Renewing, updating or reinforcing existing systems and infrastructure | 66.3% |
| Weak yen, rising personnel costs, vendor price increases | 46.6% |
| Growth in cloud services | 45.0% |
Number one is not new development. It is renewal and updating of what already exists. In other words, the main battlefield for corporate spending has moved from building something from zero to reconnecting things that are already running. It is equally important that vendor price increases sit at number two. When unit rates are rising, the accuracy of your man-hour estimate matters more than it used to. The same two person-month misjudgement now leaves a bigger hole, in proportion to how much rates have gone up.
For reference, the IT budget DI stands at 43.3 points in the FY2025 plan (a fifth consecutive year of increase) against a FY2026 forecast of 39.9 points, so a mild cooling is expected. Increases in AI-related investment and usage fees rise from 36.3% in the FY2025 plan to 43.7% in the FY2026 forecast, up 7.4 points. That said, on the specific theme of this article, factory business systems, the most frequently cited issue that companies want IT investment to solve is still “making business processes more efficient and faster,” at 34.6% overall. The centre of gravity remains one step before AI.
Starting with “what to build” inflates the number while nothing gets decided
When you start with what to build, the wish list grows and grows, because nobody objects to anything on it. Meanwhile the discussion of what to connect to gets deferred with “let us nail that down later.” Then later arrives, and suppose two more connection targets have appeared. That alone sends the number sharply upward, the internal approval process sends the proposal back, and the project stalls for six months.
So reverse the order. Fix the connection targets first, and only then talk about screens. That is the argument running through this whole article. How to select the company you place the order with is a separate question, covered in how to choose a system development company in Thailand, so we will not go into vendor selection here. What we cover here is the cost structure and the contractual decisions that matter regardless of which company you engage.
Business system development costs split into five layers
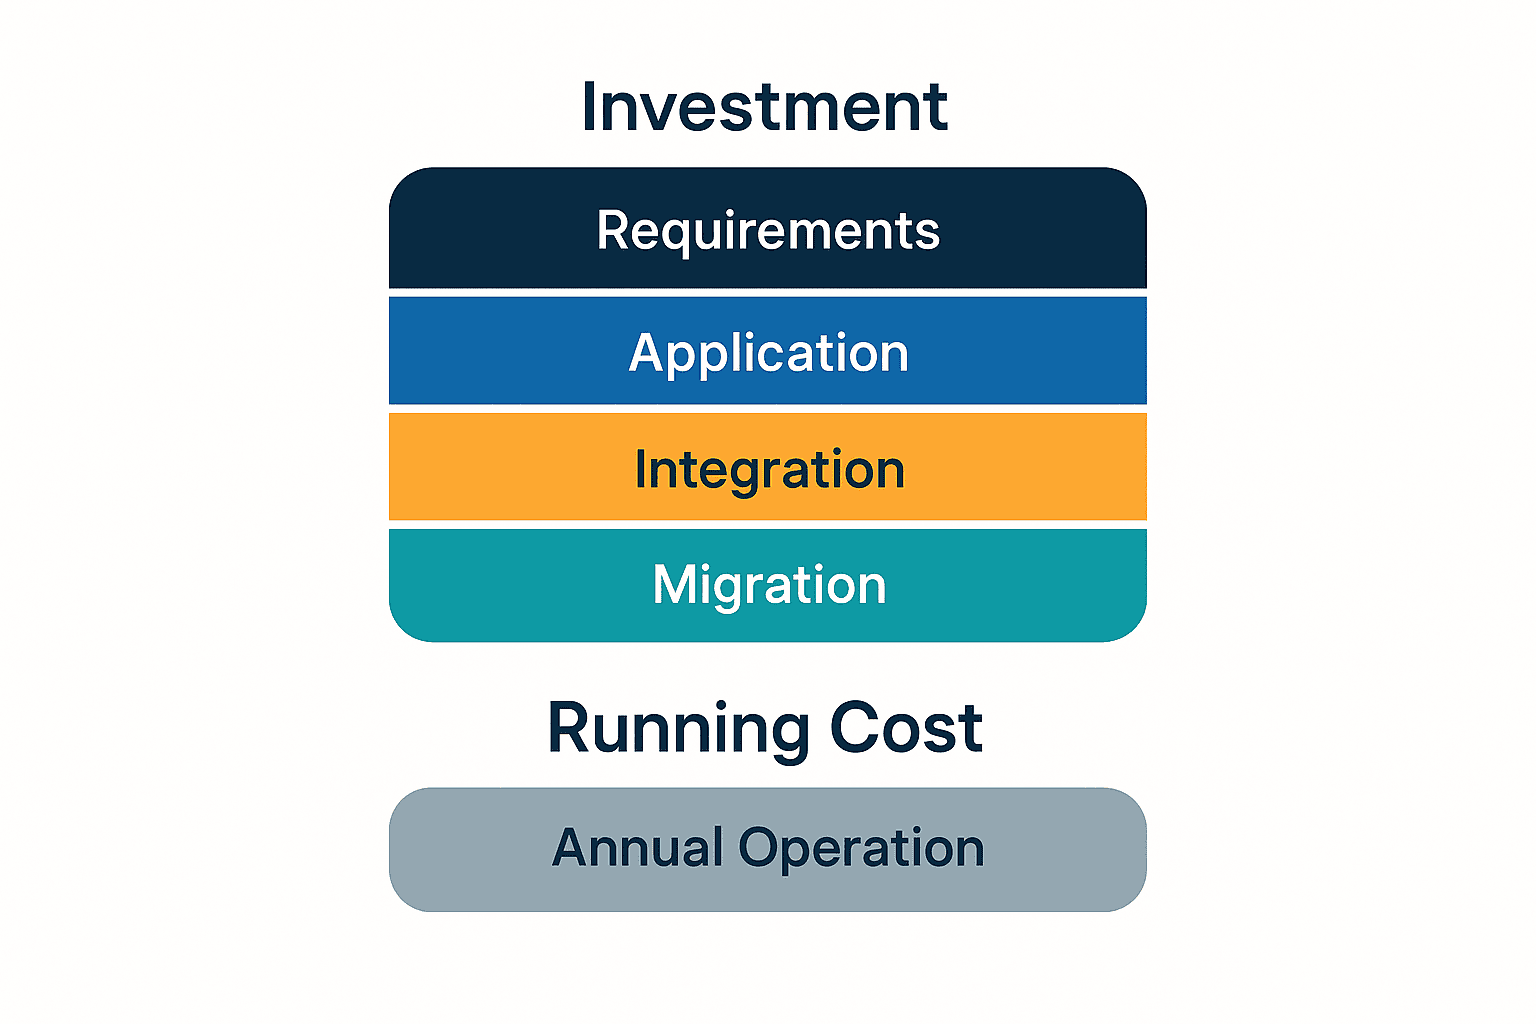
The fastest way to make quotations comparable is to redistribute the money into the same five layers. Vendors use wildly different line-item names, but once you push everything into these five layers you can compare them side by side.
Definition of the five layers
- Layer 1, requirements definition and business design | inventory of current operations, fixing the specifications for screens and reports, organising approval flows
- Layer 2, application development | implementation and testing of screens, data entry, reports and business logic
- Layer 3, integration interface development | connections to the ERP, the production management system, equipment and existing databases
- Layer 4, master data preparation and data migration | cleaning and migrating item, business partner and process masters (always include the monetary value of internal man-hours)
- Layer 5, maintenance, modification and support | annual running cost after go-live
For the rest of this article we hold the following definition fixed.
Investment = Layer 1 + Layer 2 + Layer 3 + Layer 4
Layer 5 is excluded from the investment and treated separately as an annual running cost
This is not a statement about capitalisation rules in accounting. It is a convention adopted to keep the denominator of the ROI to a single figure. In the ROI formulas later on, the denominator is this investment and the numerator is “annual benefit minus the Layer 5 annual running cost.” Putting Layer 5 into both the denominator and the numerator would be double counting, so we draw the line here.
A quotation that omits the monetary value of internal man-hours in Layer 4 is a warning sign
Of the five layers, the one most likely to fall out of a quotation is Layer 4. The reason is simple: the master data work is done by your own employees, not by the vendor. It does not appear on the vendor’s quotation, so it does not appear in the internal approval documents either. In reality, though, staff in production control and purchasing spend months eliminating duplicate item codes, aligning units and decimal places, and removing discontinued parts. That time is not free.
Industry commentary lists the cost items that are typically absent from a quotation but occur anyway: additional customisation, data migration, training, external system integration, and the opportunity cost of a project that drags on. The combined total of these is said to sometimes reach 50% to 100% of the quoted amount. This is not primary statistical data, so the figure itself should not be taken at face value, but as a warning that “an equivalent amount of cost can be hiding outside the quotation” it matches practical experience. In the same context, commentators note that cleaning and migrating master data consumes unexpected man-hours, and that it is not unusual for failed data migration to become the single largest cause of project delay.
The countermeasure is not difficult. Write the hours and their monetary value for internal man-hours into Layer 4. In the model calculations later on, we convert them at an hourly rate of THB 50 per hour (the upper end of Thailand’s provincial minimum wage, THB 400 per day, divided by 8 hours) and state the amount explicitly.
Over five years, Layer 5 exceeds 40% of the total
The other layer that is easy to drop is Layer 5. Post-go-live maintenance, modifications and support look small in monetary terms, and they land at a different point in the approval calendar, so they tend to fall outside the field of view at the moment of the investment decision.
In the calculations below we set Layer 5 at 15% of the investment per year. On that assumption, Layer 5 accounts for the following share of five years of total spending.
Five-year total for Scenario A = 3,600,000 + 540,000 x 5 = THB 6,300,000
Of which Layer 5 = THB 2,700,000 = 42.9% of the total
In Scenario B, where the investment is one third the size, the annual rate is the same 15%, so the share is the same 42.9%. Viewed over five years, roughly 40% of what you pay is post-go-live cost. Comparing quotations without asking “what is the annual maintenance figure” is the same as deciding while ignoring 40% of the money.
Why Layer 3, the integration interfaces, becomes the largest line item
This is the core of the article. Why does the cost of simply “connecting” exceed the cost of building screens? The explanation is not intuition. It comes from the structure of the standard itself.
What ISA-95 (IEC 62264) defines is precisely the boundary
Manufacturing IT architecture has an international standard: ISA-95, published as IEC 62264. The standard organises manufacturing IT into Levels 0 to 4 and defines four operational domains, namely production, quality, maintenance and inventory.
- Level 4 = ERP (business planning, finance, purchasing, sales)
- Level 3 = MES / manufacturing execution (production instructions, sequencing, actual results collection, traceability)
- Level 2 and below = supervisory control, PLCs, sensors and actuators
And what ISA-95 primarily specifies is neither the contents of Level 3 nor the contents of Level 4, but the boundary between Level 3 and Level 4, that is, the interface. The very fact that an international standard was written specifically for the boundary is evidence that this is where the difficulty lies.
Two supporting technologies are also defined. B2MML is an XML model for the data exchanged between ERP and MES, and OPC UA handles real-time communication between the OT side and the IT side. The part that pulls actual results from equipment overlaps with the territory covered in outsourcing PLC program development, which means responsibility for it tends to be split across different internal departments. Wherever responsibility is split is also where gaps in a quotation appear.
“Connecting” is not about communication, it is about agreement
Purely technical connection is not particularly expensive. What is expensive is the agreement-building and the exception handling that surround it. Connecting a single system means deciding and implementing at least the following.
| What has to be decided | What happens if it is not decided |
|---|---|
| The fields exchanged, with data type, length and unit | Decimal places for quantities do not match and rounding differences accumulate daily |
| Timing and granularity of transmission (per transaction / hourly / daily) | Cut-off times differ between the two systems and month-end always produces a mismatch |
| Which master is authoritative | The same item gets created on both sides and ends up with two codes |
| Retry and recovery on error | A failed transmission goes unnoticed and surfaces several days later |
| Authorisation and authentication (whose ID is used) | A job stops when the responsible employee leaves the company |
Every one of those five rows is a business decision, not a programming difficulty. That is exactly why they take time to settle, and why starting implementation before they are settled leads to rework. Integration becomes the largest line item not because of technical difficulty but because of the sheer volume of agreement required.
Commentary on manufacturing also notes that integration tends to grow more complex because every master change or new site concentrates requests on the IT department, and man-hours expand with each change. In other words, the structure is not “build it once and you are done”; cost recurs with every change.
This is why you place middleware in between | when the ERP changes, only the integration layer needs updating
Read this far and integration looks like unavoidable debt. But the ISA-95 way of thinking includes a design principle that confines that debt to a small area.
If you design with middleware or an API in between, a change on the ERP side does not significantly affect the MES side, and the only thing that needs updating is the integration interface.
This translates directly into money. If the shop-floor application (Layer 2) is built to read ERP tables directly, then an ERP upgrade forces you to rebuild Layer 2 as well. Conversely, if you concentrate the translation role in Layer 3, then when the ERP changes the only thing you touch is Layer 3. In terms of Scenario A in the model calculations below, that is the difference between rework spreading into the THB 1,050,000 of Layer 2, or being contained within the THB 780,000 of the ERP portion of Layer 3.
So Layer 3 is not merely “the expensive line item.” It is an investment that gathers future change costs into a single place. Cutting the price here and going for direct connections makes the quotation cheaper today and more expensive at the next upgrade.
Our own measured data also showed the wiring costing more than the hardware
In the handheld terminal cost breakdown we published, integration development was about 55.8% of the initial investment and the terminals themselves were about 26.3%. The connection cost more than twice as much as the device that looks like the main purchase. The same pattern comes up repeatedly in process management system costs and how to choose one and in our comparison of inventory management systems. In the model calculations below, the integration interfaces account for 40.0% to 64.7% of the investment. That measured 55.8% falls neatly inside the range.
The end of SAP ECC 6.0 mainstream maintenance in December 2027 lands on overseas sites from outside
Here we insert one time-bound issue. This is not intended as an article about SAP. We treat it strictly in terms of what an ERP upgrade at head office means for shop-floor systems at an overseas site.
The facts, organised
The following is consistent across the official SAP Community blog “Maintenance Timelines for SAP ERP 6.0” and several other sources.
| Scope | Maintenance deadline |
|---|---|
| Mainstream maintenance for SAP ERP 6.0 enhancement packages EHP 6 / 7 / 8 | Ends 31 December 2027 |
| Extended maintenance if the additional fee (+2% on the maintenance base) is paid | Until 31 December 2030 |
| Enhancement packages below EHP 6 | Already ended on 31 December 2025 |
One note on the cost of extended maintenance. Under an ERP Private Cloud contract, that +2% is included in the subscription. Beyond 2030 the option of paid Customer-Specific Maintenance remains, but it offers only limited coverage for new functionality and for changes in law or taxation. In a country like Thailand, where value added tax rules or electronic invoicing requirements may change, that single point about limited legal-change coverage carries considerable practical weight.
For an overseas site, this is a change to integration requirements
For the IT department at head office in Japan, this is an ERP upgrade project. For the manufacturing department at a Thai plant it looks like something else entirely: the system your shop-floor application connects to, whether it is already built or still being planned, is going to change, on a fixed date.
Exactly what changes depends on the content of the upgrade, but at minimum the following are affected.
- Connection method (from IDoc, RFC or file transfer to REST APIs or event-based integration)
- Fields and coding schemes (item code length, cost elements, how plants and storage locations are held)
- Cut-off timing and posting rules
- Authentication and authorisation methods
If “fields and coding schemes” change, the effect does not stop at Layer 3. Because the masters have to be reworked, the Layer 4 master preparation happens all over again. This is also why we keep repeating that the monetary value of internal man-hours belongs in Layer 4.
What this means in practice if you are planning a business system now
“We do not know what head office will do with the ERP, so we will wait before touching the shop-floor system” looks safe but usually turns out expensive. From 1 August 2026 to 31 December 2027 there are 517 days, roughly 17 months. While you wait, the deadline approaches and your options narrow.
There are three realistic moves.
- Narrow the connection targets to one system and build that first | start one-way and add two-way once head office has stated its direction
- Fix Layer 3 as a route through middleware | write into the contract that the application must not call the ERP directly
- Send head office a written enquiry asking for their direction, with a date attached | get “when, and to which connection method” on the record in writing
The third is a matter of process rather than technology, but it has the biggest effect. If an overseas site freezes its integration specification without holding head office’s ERP direction in writing, a single remark from head office can overturn that specification.
Choosing between full scratch, packaged software, and package plus add-ons
From here we look at how to build. We will not compare named products. Product-level comparison is covered in our comparison of production management systems and comparison of production schedulers; here we set out only the decision criteria.
There are three options.
| Option | Conditions it suits | Effect on Layer 3 |
|---|---|---|
| Full scratch build | the business process itself is a source of competitiveness / existing commercial practices cannot be changed / no suitable package exists | you can design the integration specification freely, but you must decide everything yourself, so the agreement cost in Layer 3 is at its maximum |
| Packaged software, standard functionality only | the business can be adapted to the product / the target operations are generic (inventory, purchasing, routine entry of actual results) | Layer 3 is minimal if a standard integration adapter exists, though what “connects out of the box” actually means should always be checked field by field |
| Package plus add-ons | 80% is covered by standard functionality and 20% is company-specific | on top of Layer 3, integration for the add-on portion is added, and revalidation occurs at every version upgrade |
The criterion is not “can we build it” but “can we change the way we work”
One practical question separates the three. Can you change the way this work is done so that it fits the product?
If you can, standard functionality is the cheapest, fastest and most robust choice. If you cannot, you need to separate whether the reason is “competitiveness” or “habit.” If it is competitiveness, it is worth protecting with a scratch build or an add-on. If it is habit, changing the way you work is usually cheaper.
What you must check before choosing add-ons
Package plus add-ons looks like the moderate middle path, so it is frequently chosen, but its cost profile over time differs from the other two. Revalidation of the add-ons and the integration is triggered at every version upgrade. That lands in Layer 5, the annual running cost.
So if you are considering add-ons, we recommend confirming these three points at the quotation stage.
- How many version upgrades occur per year, and does each one trigger a revalidation charge
- Is the revalidation charge included in the Layer 5 annual figure, or quoted case by case
- If the add-on functionality is later absorbed into the standard product, can the add-on be removed
We are also frequently asked whether it is possible to engage someone purely for packaged software implementation support. The answer is yes. Even then, however, Layers 3 and 4 do not disappear. Only who does the work changes; the volume of decisions to be made is the same.
Model calculations | comparing Scenario A and Scenario B on one baseline
Now to the numbers. All figures are in Thai baht only, with no conversion to yen or dollars. We state up front that these are model calculations built from assumed values and are not the amounts of any actual project.
Assumptions for the model factory
| Item | Assumption |
|---|---|
| Location and type | Japanese-owned manufacturer in Thailand (single site) |
| Employees | approx. 300 |
| Production lines | 3 lines x 2 shifts |
| Managed items | approx. 1,200 |
| Existing core system | SAP ERP 6.0 (ECC 6.0) at head office in Japan |
| Current shop-floor reality | production results and stock movements are written on paper, transcribed into Excel, then re-keyed into the ERP |
| Hourly labour rate | THB 50 per hour (upper end of Thailand’s provincial minimum wage, THB 400 per day, divided by 8 hours) |
| Operating days per year | 250 |
The THB 50 per hour rate is a common assumption across our articles, based on the fact that Thailand’s minimum wage was still not unified nationwide as of July 2026 and ranged from THB 337 to 400 per day by province. Actual personnel costs for indirect departments are higher than this, but we standardise on the conservative figure across all scenarios.
Only two scenarios
- Scenario A, full scratch in one go | build production results, inventory and shipping functionality all at once, with two-way integration to the ERP
- Scenario B, narrowed-scope first phase | cover only production results entry, using standard package functionality, sending one-way to the ERP

Five-layer costs | Scenario A (full scratch in one go)
| Layer | Content | Amount (THB) | Share of investment |
|---|---|---|---|
| Layer 1 | requirements definition and business design | 480,000 | 13.3% |
| Layer 2 | application development (screens, reports, logic) | 1,050,000 | 29.2% |
| Layer 3 | integration interface development (3 systems) | 1,620,000 | 45.0% |
| Layer 4 | master data preparation and data migration | 450,000 | 12.5% |
| Total investment (Layers 1 to 4) | 3,600,000 | 100.0% | |
| Layer 5 | maintenance, modification and support (annual running cost, separate) | 540,000 / year | 15.0% of investment |
The THB 1,620,000 in Layer 3 breaks down as follows.
| Connection target | Direction | Amount (THB) |
|---|---|---|
| ERP (SAP ECC 6.0) | two-way | 780,000 |
| Existing production management system | one-way | 420,000 |
| Equipment and existing database (actual results collection via OPC UA) | one-way | 420,000 |
| Total | 1,620,000 |
The THB 450,000 in Layer 4 is also shown explicitly.
Externally contracted portion (migration tooling, conversion, verification) THB 370,000 + internal man-hours valued at THB 80,000 = THB 450,000
Internal man-hours = 1,600 hours x THB 50 per hour = THB 80,000
(1,600 hours = 2 staff from production control and purchasing x 5 months x 20 days x 8 hours)
Against THB 1,050,000 in Layer 2, Layer 3 is THB 1,620,000, or about 1.54 times as much. A full scratch build produces a large application layer because there is a lot to build, and even so integration is still the largest line item.
Five-layer costs | Scenario B (narrowed-scope first phase)
| Layer | Content | Amount (THB) | Share of investment |
|---|---|---|---|
| Layer 1 | requirements definition and business design (limited to one process) | 180,000 | 15.0% |
| Layer 2 | configuration of standard package functionality and screen adjustment | 330,000 | 27.5% |
| Layer 3 | integration interface development (one-way to the ERP, 1 system) | 480,000 | 40.0% |
| Layer 4 | master data preparation and migration (item master only) | 210,000 | 17.5% |
| Total investment (Layers 1 to 4) | 1,200,000 | 100.0% | |
| Layer 5 | maintenance, modification and support (annual running cost, separate) | 180,000 / year | 15.0% of investment |
The THB 210,000 in Layer 4 consists of THB 170,000 externally contracted plus THB 40,000 of internal man-hours (800 hours x THB 50 per hour, being 1 person x 5 months x 20 days x 8 hours).
Scenario A’s investment of THB 3,600,000 is exactly 3.0 times Scenario B’s THB 1,200,000. The difference in the number of functions built is far larger than that, and the reason the money gap stops at 3.0 times is that Layers 3 and 4 do not fall to zero in B either. The pattern is clear when you look layer by layer: Layer 2 falls to 31.4% of A (330,000 / 1,050,000), whereas Layer 4 only falls to 46.7% (210,000 / 450,000). Narrowing the scope to one process does not reduce the cost in the same proportion. That is the first reality to face when you consider starting small.
Benefit assumptions | keep the baseline to a single line
This is where calculations most often go wrong. Even with no intention of inflating the benefits, the moment you write “reduced working time” and “reduced overtime payments” side by side, you have counted the same hour twice. This kind of double counting typically surfaces after the approval has gone through, when the actual results do not match the projection. To avoid it, we hold the counterfactual world we compare against to a single version.
Baseline = “we continue the current manual work and double entry exactly as it is”
Every benefit is recognised only as a difference against that baseline.
First we stack up the annual man-hours currently spent on entry, transcription and reconciliation.
| Task | Basis of calculation | Now (hours/yr) | After (hours/yr) | Saved (hours/yr) |
|---|---|---|---|---|
| Filling in and collating paper daily reports on the floor | 6 posts (3 lines x 2 shifts) x 1.5h/day x 250 days | 2,250 | 900 | 1,350 |
| Excel transcription and aggregation in the office | 3 staff x 3.0h/day x 250 days | 2,250 | 450 | 1,800 |
| Re-keying into the ERP | 2 staff x 2.0h/day x 250 days | 1,000 | 100 | 900 |
| Writing and checking material tags and issue slips | 2 staff x 2.0h/day x 250 days | 1,000 | 400 | 600 |
| Monthly reconciliation, variance investigation and head office reporting | 5 staff x 8h x 12 months | 480 | 144 | 336 |
| Preparing the twice-yearly physical stocktake and clearing variances | 10 staff x 10h x 2 times | 200 | 120 | 80 |
| Total | 7,180 | 2,114 | 5,066 |
The reduction rate is 5,066 / 7,180 = 70.6%. In a factory running on paper and Excel, a reduction of this magnitude is not unusual in itself. How to digitise daily reports specifically is covered separately in our guide to electronic forms system implementation.
Annual benefit | Scenario A
| Benefit item | Basis of calculation | Annual amount (THB) |
|---|---|---|
| 1. Reduced man-hours for entry, transcription and reconciliation | 5,066 hours x THB 50 per hour | 253,300 |
| 2. Fewer emergency shipments to recover from stock-outs | 18 per year to 6 per year, 12 avoided x THB 80,000 each | 960,000 |
| 3. Lower inventory holding cost from tighter safety stock | material stock 9,000,000 x 15% reduction = 1,350,000, x holding cost rate 20% | 270,000 |
| Total | 1,483,300 |
Double-counting check (do not skip this one). Item 1 is people’s time, item 2 is logistics cost and item 3 is inventory holding cost. The account codes and the underlying objects are all different. Item 2 concerns shipping recovery on the finished goods side and item 3 concerns how material stock is held, so no amount is counted twice. Note that penalties for late delivery and valuation losses from inventory variances themselves are not included. Those are precisely what item 2’s emergency shipments prevented, so adding them would double count the same effect.
The 18 occurrences per year at THB 80,000 each, the THB 9,000,000 of stock, the 15% reduction rate and the 20% holding cost rate are all assumptions made for this model. If you run the calculation for your own site, replace those four numbers with your own actual data. Since most of the money (64.7% of the benefit) comes from item 2, your actual figure for item 2 all but determines the accuracy of the calculation.
Annual net benefit (A) = 1,483,300 – 540,000 (Layer 5 annual running cost) = THB 943,300 per year
Single-year ROI (A) = 943,300 / 3,600,000 = 26.2%
Payback period (A) = 3,600,000 / 943,300 = approx. 3.8 years
Annual benefit | Scenario B
Scenario B covers only production results entry, so the scope of the benefit narrows accordingly. What is in scope is the top three rows of the man-hours table (paper daily reports on the floor, Excel transcription in the office, re-keying into the ERP), totalling 5,500 hours.
| Benefit item | Basis of calculation | Annual amount (THB) |
|---|---|---|
| 1. Reduced man-hours for entry, transcription and reconciliation | 3,175 of the 5,500 hours in scope removed (reduction rate 57.7%) x THB 50 per hour | 158,750 |
| 2. Fewer emergency shipments to recover from stock-outs | 18 per year to 12 per year, 6 avoided x THB 80,000 each | 480,000 |
| 3. Tighter safety stock | inventory is out of scope this time, so not counted | 0 |
| Total | 638,750 |
Here is how the 3,175 hours in item 1 are derived. In Scenario A those three rows are reduced in full, giving 4,050 hours (1,350 + 1,800 + 900), but B is one-way and covers only results entry, so Excel aggregation and monthly reconciliation remain in place. We therefore took 78.4% of the full amount, or 3,175 hours, as the reduction. The breakdown is 675 hours for paper daily reports on the floor (half of A), 1,600 hours for Excel transcription in the office, and 900 hours for re-keying into the ERP (this disappears entirely thanks to the one-way integration), totalling 3,175 hours.
One clarification on item 2. Item 2 is not the effect of how inventory is held (that is item 3); it is limited to the effect of actual results reaching the ERP the same day, so stock-outs are detected earlier. We conservatively assume that earlier detection prevents one third of the total and leave the remainder, which depends on how inventory is held, out of scope and out of the calculation.
Annual net benefit (B) = 638,750 – 180,000 (Layer 5 annual running cost) = THB 458,750 per year
Single-year ROI (B) = 458,750 / 1,200,000 = 38.2%
Payback period (B) = 1,200,000 / 458,750 = approx. 2.6 years
Reading the two side by side
| Metric | Scenario A (full scratch in one go) | Scenario B (narrowed-scope first phase) |
|---|---|---|
| Investment (Layers 1 to 4) | THB 3,600,000 | THB 1,200,000 |
| Of which Layer 3 | THB 1,620,000 (45.0%) | THB 480,000 (40.0%) |
| Layer 5 (annual running cost) | THB 540,000 / year | THB 180,000 / year |
| Annual benefit | THB 1,483,300 | THB 638,750 |
| Annual net benefit | THB 943,300 | THB 458,750 |
| Single-year ROI | 26.2% | 38.2% |
| Payback period | approx. 3.8 years | approx. 2.6 years |
| Five-year cumulative net (net benefit x 5 – investment, simple undiscounted total) | +THB 1,116,500 | +THB 1,093,750 |
Three things can be read from this.
- The payback period is 1.2 years shorter in B (3.8 years to 2.6 years). Narrowing the scope returns the money faster relative to what was put in.
- The five-year cumulative net is almost identical (a gap of THB 22,750, about 2.0% of A). A generates a larger absolute benefit, but that is offset by the weight of its running cost and its investment.
- Even so, B’s investment is one third the size. If the destination after five years is the same, moving less money makes the internal approval process easier and leaves a shallower wound if things go wrong.
None of this means “A is wrong.” Look beyond five years and there is every chance A overtakes B. But if you build the approval case on year six and beyond, you take on the responsibility of explaining that the same assumptions still hold in year six and beyond. In Thailand’s 2026 business environment, as discussed below, that is not easy to do convincingly.
Sensitivity analysis 1 | hourly labour rate from THB 50 to THB 100 per hour
Personnel costs in Thailand are rising. Let us see what happens if the hourly rate doubles. The important point here is that the hourly rate affects not only the benefit side (the value of man-hours saved) but also the cost side (the internal man-hours valued in Layer 4). Moving only one side produces a flattering result.
| Item (THB unless stated) | Scenario A (rate 50 → 100) | Scenario B (rate 50 → 100) |
|---|---|---|
| Internal man-hours in Layer 4 | 80,000 → 160,000 | 40,000 → 80,000 |
| Layer 4 total | 450,000 → 530,000 | 210,000 → 250,000 |
| Investment | 3,600,000 → 3,680,000 | 1,200,000 → 1,240,000 |
| Benefit 1, man-hours saved | 253,300 → 506,600 | 158,750 → 317,500 |
| Total annual benefit | 1,483,300 → 1,736,600 | 638,750 → 797,500 |
| Annual net benefit | 943,300 → 1,196,600 | 458,750 → 617,500 |
| Payback period | 3.8 years → approx. 3.1 years | 2.6 years → approx. 2.0 years |
The Layer 5 annual running cost (A: 540,000 / B: 180,000) is an external service contract value, so we have not linked it to the internal hourly rate. What increases in this sensitivity analysis is only the internal man-hours in Layer 4; the external contract value does not change. (In sensitivity analysis 2 below, what increases is external development cost, so Layer 5 is recalculated there at 15% of the investment.) For completeness, even if we did recalculate Layer 5 here at 15% of the investment, A would come to THB 552,000 with payback in 3.1 years and B to THB 186,000 with payback in 2.0 years, so the conclusion is unchanged.
In conclusion, a higher hourly rate does raise the investment slightly (+THB 80,000, or +2.2%, in A), but the increase in benefit is far larger and the payback period shortens. When personnel costs are rising, the investment case for systemisation improves. That is an unsurprising conclusion, but the point is that we can say it having moved the Layer 4 cost side at the same time.
Sensitivity analysis 2 | number of connected systems from 1 to 3
This is the part that puts a number on the central argument of this article. Taking Scenario B as the base, we leave the application scope completely unchanged and increase only the connection targets from one system to three. What we add is the existing production management system (THB 420,000) and equipment plus the existing database (THB 420,000).
The benefit side is fixed at THB 638,750 per year. The reason is to keep the assumption conservative. In theory more connections should produce more benefit, but experience on the shop floor is that benefit almost never scales in proportion to the number of connections. Benefit is produced by the work on the floor changing, not by the number of links between systems.
| Connection targets | Layer 3 | Investment | Layer 3 share | Layer 5 (yr) | Annual net benefit | Payback |
|---|---|---|---|---|---|---|
| 1 system (one-way to ERP) | 480,000 | 1,200,000 | 40.0% | 180,000 | 458,750 | approx. 2.6 years |
| 2 systems (+ production management system) | 900,000 | 1,620,000 | 55.6% | 243,000 | 395,750 | approx. 4.1 years |
| 3 systems (+ equipment and existing DB) | 1,320,000 | 2,040,000 | 64.7% | 306,000 | 332,750 | approx. 6.1 years |
Simply going from one connected system to three stretches the payback period from 2.6 years to 6.1 years, about 2.3 times. Not a single application function has been added. The screens and the reports are unchanged. The only thing that grew is the number of connection targets.
The claim at the top of this article, that a business system development quotation is decided not by what you build but by what you connect it to, is pointing at this table. What belongs in your approval document is not a list of functions but the number of rows here.
Five items to settle on paper before you place the order
Building on everything above, we narrow down to five items that belong on paper in the contract or memorandum. Verbal or email agreement is not enough, because it evaporates the moment the responsible person changes.
1. The requirements freeze date, and how post-freeze changes are handled
Write the date by which requirements are frozen. Then decide in advance how changes raised after that date will be handled. “Changes are quoted separately” is not sufficient on its own. We suggest also writing down the deadline for submitting a quotation per change (for example, within five business days) and who has authority to decide. Without this, the whole project stops at every change.
2. The granularity of the integration specification
This is the most important item. The single sentence “it integrates with the ERP” is not a specification. At minimum, the following granularity is needed.
| Unit to be documented | Example of content |
|---|---|
| Per interface | IF-001 send production results, IF-002 receive item master |
| Per field | field name, type, length, decimal places, unit, mandatory or optional, default value |
| Timing | per transaction / every 5 minutes / daily at 21:00 / after monthly close |
| Direction and authority | send only / receive only / two-way, and which side owns the master |
| Exception handling | retry count on send failure, retry interval, who is notified, manual recovery procedure |
| Expected volume | maximum records per day, concurrent executions at peak |
When you compare quotations, lining up on price alone a quotation where these six rows are filled in and one where they are not is meaningless. Distributing the same integration specification, at the same level of granularity, to every vendor before requesting quotations is the only way to obtain quotations that can actually be compared.
3. Who prepares the test data, and by when
Only you can create the test data. The vendor does not know your item codes or your business partner codes. If this is not agreed, you end up in the stall where development is finished but testing cannot begin.
What to decide: how many production-equivalent records, by when, and prepared by whom. The masking policy where personal data or commercial terms are involved. Who creates the exception test cases (zero quantity, negative stock, discontinued items, wrong units).
4. Who owns the master
Write in one line whether the item master is owned by the ERP or by the new system. If both are authoritative, it will break, without exception. Where authority differs field by field (for example, the ERP owns item codes while the new system owns standard man-hours), set it out in a table at field level.
Along with this, we suggest also deciding which department maintains the master and what the lead time is for new registrations. Support enquiries after go-live along the lines of “we registered a new item but it does not appear on the tablets on the floor” almost always trace back to the absence of this agreement.
5. Source code delivery and the right to modify
Write these three points into the contract.
- Whether the source code is delivered (delivered or not, when, and where it is stored)
- Copyright and scope of use (can it be used at your other sites, can it be modified)
- Whether third-party modification is permitted (is a vendor other than the original developer prevented from working on it)
The third matters most. As discussed below, IT talent in Thailand is highly mobile and the engineers assigned to you turn over within a few years. A contract stating that nobody but the original developer may touch the code freezes your own asset the moment the original developer’s assigned engineer moves on.
Issues that only apply when you develop a business system in Thailand
There are four points you will get wrong if you proceed with purely Japanese assumptions. Three concern regulation and talent; the fourth concerns the investment environment.
BOI 8.1.1 is an incentive for the developer, not for the factory placing the order
Thailand’s BOI (Board of Investment) has an activity category 8.1.1 (Software / Digital Platform / Digital Content, Category A2). It works as follows.
- Corporate income tax exemption for up to 8 years
- The exemption cap is determined by actual expenditure each year
- The cap is calculated on 100% of the salaries of Thai IT personnel newly hired after application, and 200% of training costs
- As a condition, the software development processes (coding, testing, deployment) must be carried out in Thailand by an IT team based in Thailand
- IT and tech businesses may be 100% foreign owned (an exception to the usual foreign ownership restrictions)
- Import duty exemptions apply to project equipment, R&D raw materials and raw materials for export production
Because this is easily misread, we state it explicitly. This is an incentive received by the business that develops the software (the vendor), not something the factory placing the order can receive. Even if your own company holds BOI incentives as a manufacturer, ordering a business system does not add any 8.1.1 benefit.
Does that make it irrelevant to the buyer? Not at all. It matters for vendor selection and for deciding where development happens. The fact that performing development work inside Thailand is a condition of the incentive means that a vendor holding the incentive has a development team inside Thailand. That aligns neatly with the very practical question of whether the people assigned to you are local and can come to your site.
The depa 200% deduction faces a double barrier for BOI companies
Thailand has one more mechanism encouraging digital investment: the 200% expense deduction (Royal Decree No. 802) connected with depa, the Digital Economy Promotion Agency. The conditions are strict, however, and the number of Japanese-owned factories that can actually use it is limited.
| Condition | Content |
|---|---|
| Deduction cap | THB 300,000 per accounting period |
| Eligible vendors | limited to vendors registered in the depa Thailand Digital Catalog |
| SME requirement | paid-up capital of THB 5 million or less and revenue of THB 30 million or less |
| Exclusion | not available to businesses receiving corporate income tax exemption under BOI, targeted industries or the EEC |
| Eligible spending period | until 31 December 2027 |
Many Japanese-owned manufacturers in Thailand operate under BOI incentives. So the first barrier is that holding BOI incentives already rules out the depa 200% deduction. And even where it is available, the cap is THB 300,000 per year. Against Scenario B’s investment of THB 1,200,000 in this article, using the cap in full still only covers a THB 300,000 deduction allowance. Moreover, THB 300,000 is an allowance for deduction, not the reduction in tax itself. What you actually save is that allowance multiplied by the corporate income tax rate. Always confirm this double barrier before writing “tax incentives reduce the effective burden” into an approval document.
As an aside, the deadline for depa’s eligible spending period (31 December 2027) is exactly the same date as the end of SAP ECC 6.0 mainstream maintenance mentioned above. It is a coincidence, but it does no harm to notice that the same wall at the end of 2027 stands on both the regulatory side and the technical side.
Mobility and pay levels for IT talent in Thailand
Thailand is said to be short of roughly 70,000 digital professionals. On pay, the 2026 salary increase trend is around 4.7% per year, while changing employer delivers a 15% to 30% increase in a single move.
Those two numbers are of different dimensions, so let us convert to years to compare them. Compounding a 4.7% annual increase takes about 3.0 years to reach 15% and about 5.7 years to reach 30%. In other words, one job change is worth three to six years of internal pay increases. The economic logic of an engineer choosing to move is overwhelming.
How this affects business system development comes down to three points.
- Structure the contract on the assumption that the vendor’s assigned staff will turn over within a few years | this connects directly to “whether third-party modification is permitted” above
- Knowledge that lives only in one person’s head, with nothing written down, becomes fatal | this is another reason to specify the granularity of the integration specification at the time of ordering
- Your own local IT staff are in the same market | knowledge that stays inside the company and is never written down is lost when the person leaves
This is precisely why the Layer 3 specification needs to survive as “a readable document,” not as “working code.”
The Thai economy in 2026 | large one-shot investments are hard to get approved
A word on the external environment for investment decisions. For Thailand’s GDP growth in 2026, government-linked forecasts stand at 3.0% to 3.5% while private think tanks and financial institutions have revised down to around 1.8% to 2.0%. Automotive production fell 11.4% year on year in May 2026, a second consecutive monthly decline, with export-bound production reported at minus 25.8%. On the other hand, the capital investment DI for Japanese companies recovered to plus 1 in the first half of 2026, so the appetite for investment has not disappeared.
These figures are secondary information compiled by industry media and should be read as ranges. The practical implication, however, is clear. Appetite for investment is not zero, but large one-shot investments are hard to get through the internal approval process. Getting Scenario A’s THB 3,600,000 approved in one go is less realistic in the 2026 environment than starting with Scenario B’s THB 1,200,000 and producing actual results.
A 90-day roadmap to freezing the integration specification
Finally, here are steps you can start tomorrow. These 90 days are not the period for choosing a vendor; they are the period for freezing the integration specification. Vendor selection comes after this.
First, confirm the deadline. From 1 August 2026 to the end of SAP ECC 6.0 mainstream maintenance on 31 December 2027 there are 517 days, roughly 17 months. If you spend 90 days freezing the integration specification, the freeze date is 30 October 2026 and 427 days (about 14.0 months) remain. A 90-day plan and the end-2027 deadline are not in conflict.

Days 1 to 30 | inventory of connection targets
There is one task: draw on a single sheet of paper where information flows from and to today. This is not a system architecture diagram. It is the flow of information, including paper, Excel and verbal handovers.
- List every record generated on the floor (daily reports, defect tickets, material tags, issue slips, inspection sheets)
- Draw lines showing whose hands each one passes through, into which system, and when
- Mark every place where the same number is entered two or more times
- Measure the annual volume and the time per occurrence at each marked place
That last measurement is the most important thing in the whole 90 days. You are building your own equivalent of the man-hours table above (7,180 hours) from your own real data. The numbers you measure here become the numerator of your ROI.
Days 31 to 60 | first draft of the integration specification and the interface list
Slice the flows revealed by the inventory into individual interfaces. Number them IF-001, IF-002 and so on, and fill in the six rows described earlier (per interface, per field, timing, direction and authority, exception handling, expected volume).
Two things run in parallel during this period.
- Confirmation with head office in Japan | ask in writing about the direction, timing and planned changes in connection method for the ERP upgrade. Replies take time, so send it on the first day of this period
- Provisional decision on master authority | provisionally decide which side owns items, business partners and processes. Where authority splits field by field, put it in a table
It is normal for some items to remain undecided at this stage. Record the undecided items in the specification as “open,” and attach who will decide them and by when. If you send it out with blanks, vendors will price against whichever assumptions suit them.
Days 61 to 90 | freezing the specification and obtaining quotations on identical terms
Consolidate the deliverables from day 30 and day 60 and freeze them as the integration specification. Then distribute the same integration specification to every vendor and request quotations. Only now does comparing prices mean anything.
When the quotations arrive, redistribute them into the five layers used in this article. Whatever the vendor’s line-item names, you can determine which of Layers 1 to 5 each belongs to. If, after redistribution, one quotation shows an extremely low Layer 3, there is a good chance the vendor either has not read the integration specification carefully or has designed a direct connection (the application calling the ERP directly). The former grows later. The latter has to be rebuilt at the next upgrade.
Day 91 onwards | development duration and the end-2027 deadline
From the freeze date (30 October 2026), 427 days remain, about 14.0 months. The relationship with development duration is as follows.
| Approach | Assumed development duration | Indicative go-live | Slack before end-2027 |
|---|---|---|---|
| Scenario A (full scratch in one go) | 9 to 12 months | end July to end October 2027 | approx. 2 to 5 months |
| Scenario B (narrowed-scope first phase) | 4 to 6 months | end February to end April 2027 | approx. 8 to 10 months |
Scenario A does fit within the 14.0-month window, but with only 2 to 5 months of slack. If it coincides with the head office ERP upgrade, that slack may not be enough to absorb the overlap. Scenario B leaves 8 to 10 months of slack, which allows you to decide on a second phase (two-way integration or additional connection targets) once head office has settled its direction.
For reference, greenfield MES implementations at mid-sized sites are described internationally as taking 12 to 24 months and costing EUR 1 million to 5 million. Those are European figures and cannot be applied to Thai amounts, but as a sense of duration they are not greatly at odds with the 9 to 12 months above.
Frequently asked questions
What is the going rate for business system development?
Answering “the going rate” with a single number invites misunderstanding, because the same functionality can vary several-fold in price depending on the number and direction of the connections. In the model calculations in this article, one process with one-way integration to one system came to THB 1,200,000, and full functionality with integration to three systems (two-way for the ERP only) came to THB 3,600,000 (both are Layers 1 to 4, built up from assumed values). If you want a sense of the going rate, look less at the absolute amount and more at what percentage of the investment Layer 3 represents. In our calculations it is 40.0% to 64.7%, and in our measured handheld terminal rollout it was about 55.8%. Where a quotation shows a Layer 3 far below that range, treat it as a sign that the assumptions about connection targets are different.
How much of the core system integration should we do ourselves?
The work itself can be left to the vendor. However, keep these three things in-house. First, deciding which fields are exchanged, at what timing, and which side is authoritative. Second, reading and approving the content of the integration specification. Third, preparing test data and checking the results of exception testing. These three are business decisions and cannot be outsourced. Conversely, selecting the communication method, building the middleware and implementing error retries are specialist areas, and it is safer to leave them to the vendor.
Can we engage someone for packaged software implementation support only?
Yes. Buying the licence through a separate route and contracting only configuration, migration, integration and training as a support engagement is a common arrangement. There is one caveat. Choosing a package does not make Layers 3 and 4 disappear. If you are told that “it connects with standard functionality,” verify field by field that the standard integration adapter supports your ERP version and your fields. In most cases, a standard adapter means “a connection mechanism exists,” not “your data will flow with no configuration.”
Is developing a business app for tablets or smartphones charged separately?
How a vendor slices the quotation varies, but in terms of cost structure it falls within Layer 2 (application development) in this article. When a tablet-based business system is used in a factory, what drives the price is the operating environment rather than how the screens are built. Specifically: whether there are wireless LAN blind spots, whether entries are held offline and sent later, dust and splash resistance and operation with gloves on, and how the devices are managed (locking a lost device, distributing app updates). The same applies to smartphone business app development, where man-hours change depending on whether both iOS and Android need to be supported. Fix all of this during requirements definition (Layer 1).
Should we use a Japanese-owned or a local system integrator for manufacturing?
Do not decide on size or language alone. What matters is who can actually run Layers 3 and 4. Concretely, that means three things: whether they can deal directly with the ERP team at head office in Japan, whether they can work through the specification in Thai with your staff on the floor in Thailand, and whether they can go as far as the equipment side (PLC and OPC UA). Meeting all three within one company is not easy, whether Japanese-owned or local, so if you split the work across several companies, state the interface demarcation of responsibility in the contract. The specific checkpoints for choosing a company are set out in detail in how to choose a system development company in Thailand.
If we outsource development, does the source code become ours?
Not automatically. Unless the contract says otherwise, copyright generally remains with the developer. As set out in item 5 of the five points above, write three things into the contract: whether and when the source code is delivered, copyright and scope of use (use at other sites, whether modification is allowed), and whether third-party modification is permitted. Given the mobility of IT talent in Thailand, the third has the greatest practical impact.
How long does development take?
In the model used in this article, freezing the integration specification takes 90 days, followed by 4 to 6 months of development in Scenario B and 9 to 12 months in Scenario A. In total that is roughly 7 to 9 months for B and 12 to 15 months for A. A common misconception is that development cannot be compressed because programming takes time. What actually consumes the time is agreeing the integration specification and preparing the master data, and neither of those goes faster by adding people. If you want to shorten the schedule, the only reliable lever is reducing the number of connection targets, not adding headcount.
Summary
Reduced to one line, the argument of this article is that a business system development quotation is decided not by “what you build” but by “what you connect it to.” The key points, organised.
- Break the cost into five layers. The investment is Layers 1 to 4; Layer 5 sits separately as an annual running cost
- Always write the monetary value of internal man-hours into Layer 4. A quotation that omits it leaves part of the cost outside the approval document
- Over five years, Layer 5 accounts for 42.9% of total spending. Do not compare quotations without checking the annual figure
- Layer 3, the integration interfaces, becomes the largest line item because of the volume of agreement required, not because of technical difficulty. What ISA-95 (IEC 62264) standardises is likewise the boundary between Levels 3 and 4
- With middleware in between, a change on the ERP side means updating only the integration layer. Layer 3 is an investment that gathers future change costs into one place
- In the model calculations, Layer 3 accounts for 40.0% to 64.7% of the investment, consistent with our own measured figure of about 55.8%
- In the sensitivity analysis, without adding a single application function, increasing the connection targets from one system to three stretched the payback period from 2.6 years to 6.1 years, about 2.3 times
- Mainstream maintenance for SAP ECC 6.0 (EHP 6/7/8) ends on 31 December 2027. For an overseas site, treat this as a change to integration requirements arriving from outside
- BOI 8.1.1 is an incentive for the developing vendor, not for the factory placing the order. The depa 200% deduction is unavailable to BOI companies
- The 90 days are for freezing the integration specification, not for choosing a vendor. A freeze on 30 October 2026 leaves 427 days to the end of 2027, so there is no conflict
If you take away only one thing, make it the inventory of connection targets in the first 30 days. That single sheet of paper becomes the foundation for every later quotation comparison, approval document and contract negotiation.
If a business system project is already moving inside your company and you want to start by organising what it connects to, you are welcome to get in touch through our contact form. We are equally happy to help with the inventory of connection targets alone, or simply to redistribute a quotation you have received from another company into the five layers used in this article. Working together before the conversation reaches the money tends to reduce rework in the end.
References
- SAP Community, “Maintenance Timelines for SAP ERP 6.0” https://community.sap.com/t5/enterprise-resource-planning-blog-posts-by-sap/maintenance-timelines-for-sap-erp-6-0/ba-p/13524564
- Natuvion, “SAP ERP 6 end of maintenance: is the deadline in 2025, 2027, or 2030?” https://www.natuvion.com/newsroom/sap-erp-6-end-of-maintenance/
- JUAS, “Corporate IT Trends Survey 2026” https://juas.or.jp/activities/research/it_trend/
- i Magazine, “JUAS releases preliminary figures for the Corporate IT Trends Survey 2026” (2 February 2026) https://www.imagazine.co.jp/juas-report-on-20260202/
- ISA, “ISA-95 Standard: Enterprise-Control System Integration” https://www.isa.org/standards-and-publications/isa-standards/isa-95-standard
- Siemens, “ISA-95 framework and layers” https://www.siemens.com/en-us/technology/isa-95-framework-layers/
- Symestic, “ISA-95: The Standard for MES Architectures and ERP Integration” https://www.symestic.com/en-us/blog/mes/isa95
- Emerhub, “Thailand’s Renewed BOI Incentives for 2026 & 2027” https://emerhub.com/thailand/thailands-renewed-boi-incentives-for-2026-2027/
- AIM Bangkok, “Thailand BOI Incentives for Software, Digital Platforms, and Content Businesses” https://aimbangkok.com/boi-incentives-software-digital-platforms-content-businesses/
- PwC, “Thailand – Corporate – Tax credits and incentives” https://taxsummaries.pwc.com/thailand/corporate/tax-credits-and-incentives
- Syusodo (秋霜堂), “ERP Implementation Guide: 7 Steps for SMEs to Avoid Failure, Cost Benchmarks and Product Comparison (2026 Edition)” https://syusodo.co.jp/blog/articles/erp-introduction
- Magic Software, “Why System Integration in Manufacturing Tends to Become Complex” https://www.magicsoftware.com/ja/magic-blog/majisemi03/
- Kurasu Asia (暮らすアジア), “Complete Guide to the Thai Economy Outlook 2026” https://kyujin.careerlink.asia/blog/thailand-economy-outlook-2026/


