


By 2026, putting AI cameras on a factory floor is no longer a question of whether the technology works. Missing PPE, entry into a restricted zone, a person walking under a live crane — computer vision picks all of it up reliably. And yet injury numbers barely move. The reason is not detection accuracy. It is that almost nobody designs what happens after the detection, or whose decision it is supposed to feed. This article breaks AI safety management in a factory into three layers — detection, triage and correction — and shows where the project actually stalls.
What AI safety management in a factory actually covers
It is worth fixing the scope of the term before anything else. When this stays vague, internal discussion drifts while the budget moves anyway.
In this article, AI safety management means any system that interprets camera or sensor signals by machine in order to reduce events where a person gets hurt, and then connects that interpretation to human behaviour or to equipment behaviour. The object is people, not product.
That line matters in practice, so it is worth separating two adjacent fields explicitly.
The first is visual inspection and quality AI. It finds scratches, missing parts and dimensional defects. The underlying computer vision algorithms overlap heavily with safety use. The purpose does not. Inspection AI protects shipped quality, and the cost of failure is a defect escaping to the customer. Safety AI protects a human body, and the cost of failure is an injury. Even when the same vendor sells both, the required response time, the record-keeping obligations and the approving department are all different. Do not put them in the same approval request.
The second is predictive maintenance. Reading vibration or current draw to catch the early signs of equipment failure gets described with the same phrase — anomaly detection AI — but what it prevents is unplanned downtime, and what it protects is output. Different purpose from safety. One line of separation is enough.
Detection, triage and correction — the three layers
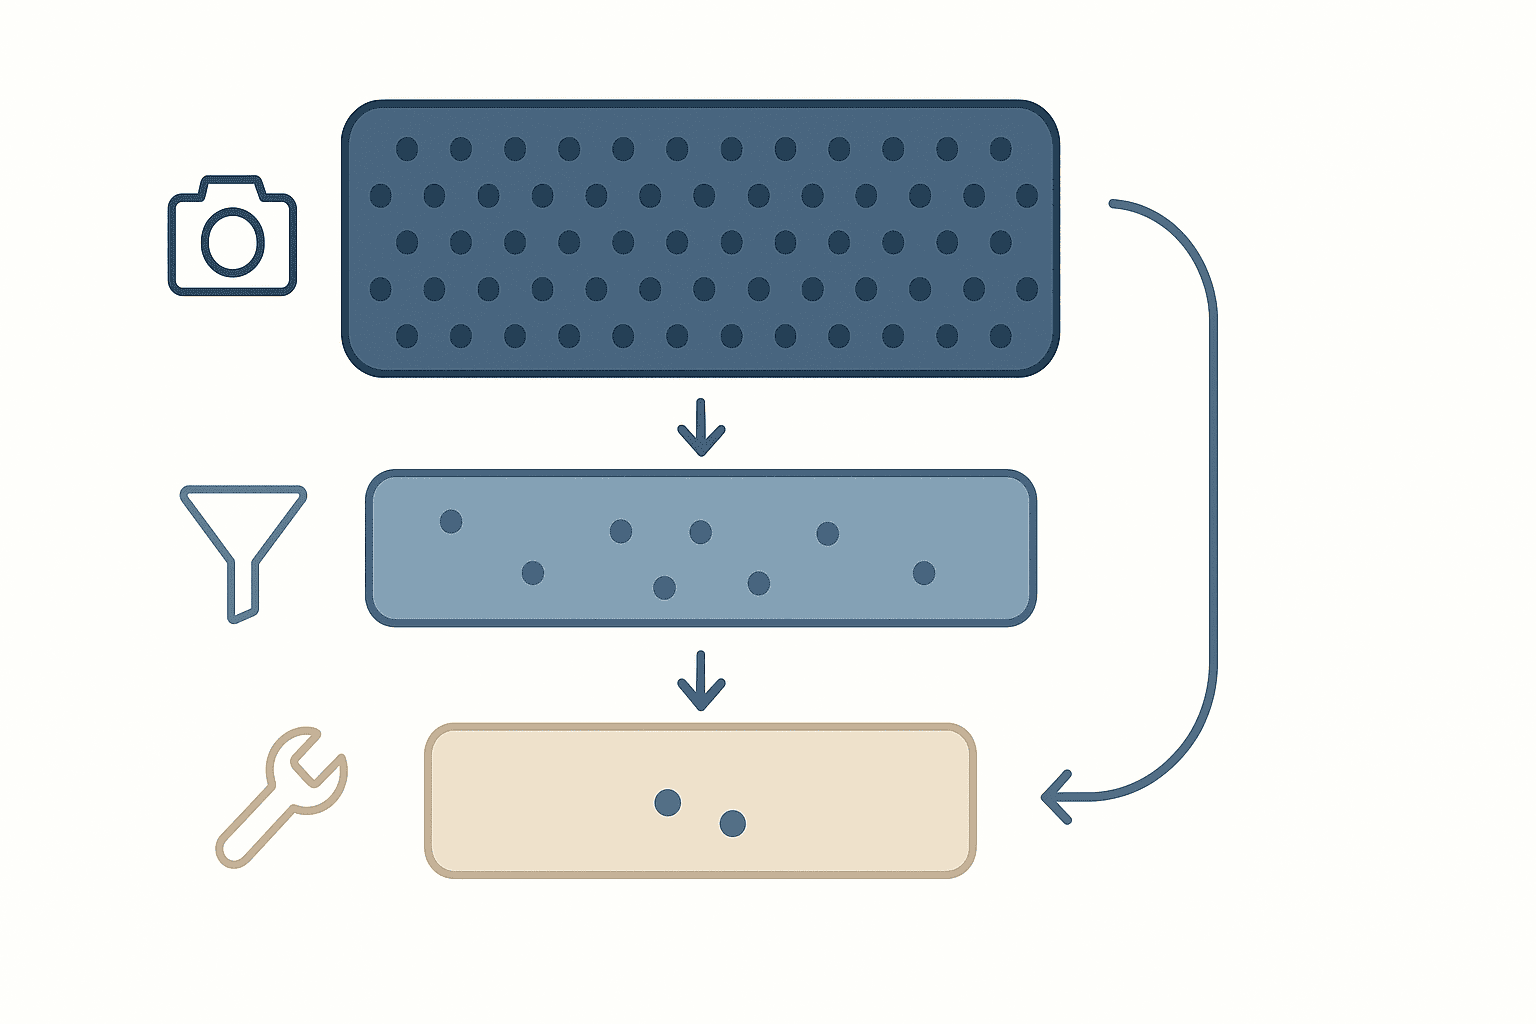
If you think of hazard detection AI in manufacturing as “a camera system,” you will get the design wrong every time, because the camera only covers the bottom of three layers.
| Layer | What it does | Who typically owns it | Symptom on the floor when it fails |
|---|---|---|---|
| Detection | Cameras and sensors pick up an unsafe state through computer vision and emit it as an event | Vendor, AI model | In 2026 this layer almost never fails |
| Triage | Narrows detections down to events that require a response, and assigns priority and a recipient | EHS lead, production engineering | Alert flood. The floor mutes or ignores notifications |
| Correction | Turns an event into who does what by when, and records that it was done | Line management, maintenance | Detection logs pile up while equipment and procedures stay exactly the same |
The key property of this model is that spend and failure probability run in opposite directions. The detection layer eats most of the budget in cameras and edge hardware, and at 2026 technology levels it almost never fails. The triage and correction layers cost close to nothing, and that is where the overwhelming majority of projects die.
So the expensive part of the quotation and the part that kills the project are not the same part. For whoever has to write the internal approval, this is an awkward structure. The detection layer has a big number attached, is easy to explain, and gets signed off. The triage and correction layers look like “operational detail,” so they get one line in the document and no owner after go-live.
The question to take away is not which camera to buy
Which is why the question worth carrying out of this article is not “which AI camera do we buy for factory safety.” It is “who owns our triage layer and our correction layer.”
If you request camera quotations before you can answer that with people’s names, the project follows a very predictable arc. Month one, everyone looks at it because it is new. Month two, someone notices how many alerts there are. Month three, people start muting the notifications. At six months the system is running and nobody opens the screen. At twelve months the renewal request is rejected because the benefit cannot be explained.
That arc is not a technology problem. It is the inevitable consequence of the triage and correction layers having no owner. The rest of this article takes those layers apart.
Accuracy is already good enough. Four disconnects that keep injuries flat
First, the numbers behind why this is worth discussing now.
Japan’s Ministry of Health, Labour and Welfare reported that in 2025 the number of workers killed or injured badly enough to lose four or more working days was 135,333. Manufacturing accounted for 26,371 of those, down 305 people or 1.1% year on year. It is going down. But manufacturing alone is about 19.5% of the total, and at 250 operating days a year that works out to roughly 105 lost-time injuries a day happening somewhere in manufacturing.
One note on why a Japanese statistic appears in an article written for plants in Thailand and the rest of ASEAN. It is not a benchmark to hit. It is a long-running, consistently compiled dataset, and the risk profile of a plant tends to carry across when production is transplanted over a border, because the machines, the line layout and the work standards usually travel with it. Treat these numbers as a reference point for the shape of the problem, not as a target. If you need local figures, read them alongside the statistics published by the workers’ compensation authority in the country you operate in.
The number that should carry the most weight is inside the fatality breakdown. Fatalities from being caught in or between machinery numbered 117, up 7 people or 6.4% year on year. Caught-in and caught-between happens when a person gets close to a moving part of a machine. Which means one of the categories an AI camera detects most reliably is the one that is increasing.
The detection technology is there. For PPE detection AI, accuracy in the range reported for production deployments in 2026 is high across helmets, high-visibility vests and gloves. And still the floor-level numbers do not move. Here are the four disconnects, in order of how often they appear.
Disconnect 1 — nobody has decided where the alert goes
The most common and the most fatal.
Ask in a scoping meeting who the alerts go to, and the usual answer is “the EHS officer, and then the line supervisors as well, I suppose.” That answer is already the problem. Every recipient added by “and then also” creates a structure in which each person assumes somebody else is looking.
There are three things to settle in the recipient design. A single primary owner who is guaranteed to look. An escalation path that fires when the primary owner has not acted within a defined window. And an explicit list of people who do not receive notifications. The third is the one that gets skipped. Copying the plant manager on everything starts as a courtesy, and the plant manager becomes the first person to turn notifications off.
There is one more thing to settle alongside the recipient list, and it bites harder in Thailand than in Japan. What happens when the primary owner is absent. Between Songkran, Chinese New Year, and leave patterns that differ from the Japanese norm, a design with exactly one named primary owner produces days with nobody watching. Either build a duty roster or bind the recipient to a shift group, and do it before go-live rather than after.
The test for this disconnect. Can someone answer, without checking, “the alert that fired during last night’s shift — what time this morning did someone look at it, and who was it?” If not, the recipient design does not exist.
Disconnect 2 — the definition of “unsafe” does not match the floor
The model detects a person without a helmet. No argument there. The problem is that whether that state is actually dangerous cannot be judged without knowing the process.
A worker who has taken their helmet off to read a drawing at a desk at the end of an assembly line may be in breach of the rule, but the injury risk is close to zero. A worker crossing under a live overhead crane without a helmet for three seconds is in a potentially fatal state. To the model these are both one instance of “not wearing.” To the plant they are completely different events.
Deploy without reconciling this and you get a double failure. First, low-risk violations arrive in volume and the system loses credibility. Second, in reaction to that, the rules get loosened until genuinely dangerous moments fall outside the detection scope too.
The workable answer is not to try to define “dangerous” inside the model. Let the model output states only — not wearing, entered, approached — and decide whether that state is dangerous using a combination of zone, time window and equipment state. In other words, make it the triage layer’s job.
- Zone — under the crane, the front face of the press, forklift traffic lanes, hazardous material storage
- Time window — normal running, changeover, cleaning and maintenance work
- Equipment state — is that specific machine running or stopped, taken from the PLC or an IoT gateway
Multiplying just those three narrows the event set dramatically. If the plant has already deployed equipment-status visualisation, the equipment-state feed can be reused. On how to get signals off the equipment side in the first place, Thailand manufacturing IoT case studies works through the options configuration by configuration.
The test for this disconnect. Put the EHS lead and the line supervisors in the same room and have them judge 20 consecutive clips as “needs a response” or “does not.” If they disagree on more than 30% of them, the definition is not shared yet. This exercise should happen before any model training, and it costs essentially nothing.
Disconnect 3 — correction stops at talking to the worker and never reaches the equipment
A great many plants close out a detected event with “spoke to the operator.” The record says corrected. The same detection appears in the same place the following week.
This is not an attitude problem among operators. It is the result of skipping levels in the hierarchy of controls. Occupational safety has long held that countermeasures have an order of effectiveness. From the top down — eliminate the hazard, substitute it, engineering controls such as guarding, isolation and interlocks, administrative controls such as procedures, training and signage, and finally PPE. The further down you go, the more the outcome depends on human attention and the less it persists.
“We spoke to them” sits second from the bottom. The single largest value an AI camera delivers is not the detection itself. It is the data on where, when and under what conditions an unsafe state keeps recurring. That data exists to be spent on the upper levels of the hierarchy.
Concretely, a deployment has succeeded when transitions like these start happening.
- The same walkway generates 20 intrusion detections a month, so the aisle layout gets changed or a physical barrier goes up — engineering control
- PPE non-compliance concentrates during one specific changeover, so the changeover procedure itself is redesigned so it can be done with the PPE on — substitution
- Approach detections cluster at the front face of one machine, so a light curtain or an interlock is added — engineering control
Conversely, if three months of detection logs have produced no change to any machine, jig, layout or work instruction, the system is functioning as a recording device and contributing nothing to safety.
The test for this disconnect. Count the number of changes to equipment, jigs, layout or work procedures made since the system went in. Zero means the correction layer is not working.
Disconnect 4 — the KPI has become the detection count
The most common line in a post-deployment report is “the system detected N unsafe behaviours this month.” On its own, that number reads equally well in both directions. A high count might mean there is a lot of danger, or it might mean the threshold is loose. A falling count might mean the plant got safer, or it might mean people learned to walk around the camera.
Worse, once detection count becomes the KPI, the floor learns which behaviours are not detected. This is not cheating or laziness. It is a rational response to the measure. Routes through camera blind spots emerge on their own, and actual risk goes up.
So what should be measured. The metrics that work in practice split into three tiers.
| Tier | Example metrics | What it tells you | When you can start measuring |
|---|---|---|---|
| Is the operation running | Primary-owner response rate, mean time to first response, number of items left unhandled | Whether the triage layer works. If this collapses, nothing above it means anything | Day one |
| Is correction accumulating | Number of conversions to engineering controls, recurring zones eliminated, days to close a corrective action | Whether the correction layer works. This is where the benefit story gets built | From month two or three |
| Did the outcome move | Near-miss reports, lost-time injuries and frequency rate, non-lost-time injuries | The final result, but the counts are small and only move on a yearly scale | From year one onward |
The reason to hold all three tiers separately is that the headline metric — injury count — takes far too long to become statistically meaningful. A single plant typically records a handful of lost-time injuries a year, and a year-on-year move of one or two is well inside noise. Any attempt to write the first-year report using injury counts alone will run out of things to say.
So write year one from the top two tiers. “Mean time to first response went from 48 hours to 4 hours.” “Two of the three recurring zones were eliminated through barriers and a layout change.” If you can write those two sentences, the investment is explainable. If you cannot, then a lucky year with fewer injuries is not a result.
Near-miss report counts need one special caveat — rising immediately after deployment is normal and healthy, because attention is elevated and reporting gets easier. Report a decrease as an achievement and the reporting culture will thin out the following year.
The test for this disconnect. Before deployment, draft the one-page report you intend to write twelve months after deployment. If you cannot draft it, the metrics are not settled.
Five types of factory safety AI, and where each one fits
Now the concrete part. Safety AI in a factory sorts, in practice, into five types, and designing around those five is much easier than designing around “AI cameras” as a single thing. Detectability, floor acceptance and the available corrective action are completely different for each type. Talking about it as one undifferentiated purchase is the single biggest cause of slow evaluation.
Here is the overview.
| Type | Detectability | Floor acceptance | Corrective action available | Processes it suits |
|---|---|---|---|---|
| PPE non-compliance detection | High | Medium (feels like surveillance) | Revise wearing rules, redesign donning and doffing points, training | Welding, grinding, forklift areas, work at height |
| Restricted-zone intrusion detection | High | High (the line is unambiguous) | Barriers, aisle rerouting, door interlocks | Around presses, robot cells, hazardous storage, under cranes |
| Unsafe posture and motion detection | Medium to low | Low (false positives generate complaints) | Add jigs, change work height, move to two-person work | Heavy lifting, awkward-posture assembly, stepladder work |
| Forklift and AGV proximity detection | Medium | High (the people involved feel the risk) | Separate traffic lanes, speed limits, mirrors and signals at crossings | Warehouse, shipping yard, material supply routes |
| Equipment interlock integration | High | High (no judgement required) | Design stop conditions, define restart procedures | Presses, moulding machines, industrial robots, conveyors |
The thing to notice in that table is that unsafe posture detection is the only type rated poorly on both of the two rated columns — detectability and floor acceptance — and it is also the type that demos best in a vendor presentation. Start there and you will almost certainly struggle. Each type in turn.
PPE non-compliance detection
The most widely deployed type and the most technically mature. Helmets, high-visibility vests, safety glasses, gloves, safety shoes and ear protection are judged in combination with person detection.
Where it fits. A bounded target area. Judging at a transit point such as an entrance or a corridor keeps both accuracy and operations stable. Trying to watch an entire work area continuously makes judgement unstable because of posture and occlusion, and pushes the event count up sharply.
Where it does not. Any plant where the PPE rules themselves are unsettled. If there are grey areas — “this process does not really need it but the rule says wear it” — then every detection reopens the argument about whether the rule is right, and nothing moves forward. Finish the rule audit before the AI goes in, not after.
A note on acceptance. This is the type that generates the strongest “we are being watched” pushback, because what is being detected is a human body rather than a machine. That connects directly to the Thai PDPA discussion later in this article. Whether the design can avoid identifying individuals matters more operationally than it does technically.
Corrective action. If you want to get past “we spoke to them,” go back to where PPE is put on and taken off. The donning point is too far from the entrance, the storage is dirty, only the wrong sizes are left. Investigate the zones where non-compliance concentrates and physical reasons like these usually surface.
Restricted-zone intrusion detection
Detecting that a person has entered a defined region. Technically this is person detection plus region logic, and it is the most mature of the five.
Where it fits. Anywhere “do not enter” is physically unambiguous. The stroke range of a press, the working envelope of an industrial robot, under a suspended load, hazardous material storage. If there is already a line painted on the floor, that line is usually the configuration.
Where it does not. Where maintenance or changeover requires legitimate entry. Fail to design for that and every maintenance job generates an alert storm. Linking to equipment state or the work order becomes mandatory, and the integration cost goes up accordingly.
Why acceptance is high. “Do not enter” leaves no room for interpretation, so detections do not turn into arguments. As a first deployment that is worth a great deal. If you are picking a first type, this one or interlock integration is the safe choice.
Corrective action. Repeated intrusion in one place almost always means going that way is shorter. Put up a barrier, redraw the traffic route, add an electric lock to the door — engineering controls work cleanly here.
Unsafe posture and motion detection
Pose estimation used to judge awkward lifting, leaning into a machine, one-handed work. The gap between expectation and reality is widest here.
Three reasons it is hard. First, the ground truth is fuzzy — there is no objective threshold for how many degrees of forward lean is dangerous. Second, it is fragile under occlusion — behind equipment, overlapping with another worker, blocked by a trolley, and the skeleton breaks. Third, the same posture carries a different risk in a different process. Disconnect 2 hits hardest in this type.
Where it still earns its keep. Analysis of repetitive work that leads to back injury. If you do not turn individual events into alerts and instead use it as an aggregate over a period to drive process improvement, the accuracy noise averages out. The useful question is “how many awkward-posture events per day does this process generate,” compared across processes.
The design conclusion. Do not use this type for real-time alerting. Use it as a daily or weekly report. Settle that split up front and complaints about false positives largely disappear.
Forklift and AGV proximity detection
Detecting people and vehicles getting close to each other. Some configurations combine cameras with vehicle-mounted sensors or positioning tags.
Where it fits. Warehouses, shipping yards, material supply routes — anywhere pedestrian and vehicle paths cross. It is also the type where the people involved feel the risk most keenly, so pushback from the floor is minimal. Forklift incidents skew severe, and that matches what the floor already believes.
Where it does not. Narrow aisles where people and vehicles are permanently in close proximity. Proximity is the normal state, so detecting it carries no information. Separate the traffic first, then add the AI — get that order backwards and you build a system that never stops beeping.
Corrective action. Mirrors and signals at crossings, slow-down zones configured on the vehicle side, physically separated pedestrian walkways. Proximity detection is most efficiently used as a measurement instrument for redesigning traffic flow, not as an alarm.
Equipment interlock integration
Connecting the detection result not to a human notification but to the behaviour of the machine itself. A person enters the hazardous region and the machine slows or stops.
The most certain effect and the heaviest design. The effect is certain because no human judgement sits in the loop. Disconnect 1 (recipient) and disconnect 3 (correction) structurally cannot occur in this type, because the triage and correction layers are embedded into the machine at design time.
Why the design is heavy. A false positive stops the machine and stops production. A missed detection injures someone. If computer vision is going to stop equipment as a safety function, whether it meets functional-safety requirements has to be examined. In general, the final stopping function for protecting people uses rated safety devices — light curtains, safety mats, safety relays. The realistic place for an AI camera is one stage earlier, in a supplementary tier such as “slow down on approach” or “trigger a warning beacon.”
The design conclusion. Do not position an AI camera as a replacement for an existing safety device. Position it as an additional layer. Put that in writing for both the internal safety function and the equipment maker before anything else is agreed.
Which of the five to start with
There is a practical rule for the first move. Start with the type that has high acceptance, an unambiguous boundary, and a corrective action that lands on a physical countermeasure. In practice, that is restricted-zone intrusion detection.
PPE detection AI comes up first in most discussions because it has the most reference deployments, but it forces you to handle a rules audit and a personal-data question simultaneously, which makes it a heavy first step. Unsafe posture detection is unsuited to real-time use, as above. Interlock integration is highly effective but the coordination with the equipment side takes time.

How to read “95% accurate” — converting a number into daily alert volume
The figures in a vendor deck — 95% accuracy, mAP 96% — are not usable as a decision input in that form. What you need is the conversion of that accuracy into how many alerts per day it produces. Skip this calculation and the alert flood from disconnect 1 arrives exactly as described.
Precision and recall are not the same thing
Two metrics behave differently in safety use.
Precision is, of the things flagged as dangerous, the proportion that actually were. Low precision means a lot of false alarms. This is the one that destroys credibility on the floor.
Recall is, of the events that actually were dangerous, the proportion that got detected. Low recall means misses. This is the one that injures people.
The two trade off. Lower the threshold and recall rises while precision falls, and vice versa. The phrase “95% accuracy” usually does not say which of the two it refers to. And a composite detection metric like mAP does not map directly onto either.
The questions to ask during evaluation. “Is that number precision, recall, or something else?” “Under what conditions was it measured?” “Can you re-measure it on footage shot in our plant?” A vendor who cannot answer the third question has given you a reference value, not a specification.
Calculation 1 — reading it as overall judgement accuracy
Start with the naive reading. One camera runs eight hours a day and produces one judgement per minute.
- 480 minutes times one judgement = 480 judgements per day per camera
- Reading 96% accuracy as the correct rate over all judgements, the error rate is 4%
- 480 times 0.04 = 19.2, meaning roughly 19 errors per day
- Across ten cameras, 19.2 times 10 = 192, meaning roughly 190 per day
Divide 190 across eight hours and you get 24 an hour, or one every 2.5 minutes. That is what “nobody looks at it any more” actually consists of. Nobody, however diligent, watches a notification that fires every two and a half minutes for three months.
Calculation 2 — reading it as precision makes it worse
In reality it is worse than that, because genuinely unsafe events are rare. Detecting a rare event drives precision far below what the headline number suggests. Same 480 judgements.
- Set the true rate of genuinely unsafe states at 2% — 480 times 0.02 = 9.6 per day per camera are truly unsafe, and the remaining 470.4 are normal
- Recall of 95% — true unsafe states detected = 9.6 times 0.95 = 9.12. Misses = 0.48 per day per camera
- If 3% of the normal states are wrongly flagged as unsafe — 470.4 times 0.03 = 14.112 false alarms per day per camera
- Total alerts raised per day = 9.12 plus 14.112 = 23.232 per day per camera
- Precision = 9.12 divided by 23.232 = 0.3926, or about 39%
Recall is 95%, and yet about six in ten of the alerts that actually arrive are false alarms. That is not an arithmetic error. It is what always happens when you detect a low-prevalence event.
Scale to ten cameras and alerts become 23.232 times 10 = roughly 232 per day, of which roughly 141 are false alarms. Divided across eight hours that is 29 an hour, or about one every two minutes. On the miss side, 0.48 times 10 = 4.8 per day, which over 20 working days is roughly 96 a month.
Three things follow from these two calculations. First, however high the accuracy figure, a high judgement rate puts the absolute number of false alarms into three digits. Second, the rarer the event, the lower the precision. Third, this problem is not solved by improving the detection layer further. Lifting precision from 39% to 60% would require pushing the false-positive rate from 3% down into the low 1% range, and the improvement is not worth what that effort costs.
How far the triage layer can filter
The solution lives in the triage layer. Apply the zone times time-window times equipment-state combination from disconnect 2, then deduplication, in sequence. The figures below are an illustration of how filtering compounds — the actual reduction rates vary by plant.
| Filtering stage | Condition applied | Assumed reduction | Alerts remaining per day |
|---|---|---|---|
| Raw detection events | None (raw output from ten cameras) | — | 232 |
| Restrict to target zones | Only the four cameras covering the three high-risk zones | 0.4x | 93 |
| Duration condition | Only events persisting 10 seconds or more for the same person in the same zone | one third | 31 |
| Deduplication | Collapse detections in the same zone within 5 minutes into one | one half | 15 |
| Match against equipment state | Only when the relevant machine is running | one half | 8 |
232 becomes 8. At eight a day, one EHS officer can review the lot before the morning meeting. That is what triage-layer design actually is. There is no clever algorithm anywhere in it — just zone definitions, a duration threshold, a deduplication rule, and the equipment running signal.
One critical caveat. Filtering pushes misses up. In the table above, the moment you restrict to target zones, hazards in every other zone are outside the detection scope by construction. So the filtering rules must be applied to notification only, with every event still recorded. Keep the full log and you can review monthly whether anything that needed a response was sitting inside the filtered-out events. Confuse filtering the notifications with filtering the records and that review becomes impossible.
The thinking behind how to hold that data mirrors the design used on the quality side to keep lots and process conditions traceable. On what to hold as an aggregate and what to keep as detail, the structure worked through in quality data management system design transfers directly.
Breaking the cost into six layers
Cost gets much easier to compare and much easier to approve when it is split into six layers — cameras, installation, edge inference, model tuning, integration, and operation. Installation gets a row of its own because it is easily absorbed into the camera line and then underestimated. The figures are a rough guide for a Japanese-affiliated plant starting at around ten cameras. They are given in Japanese yen, and local quotations in baht will vary with the vendor and the rate at the time. They also swing widely with configuration and site conditions, and they are not a basis for a firm budget.
| Layer | What it includes | Rough guide | What makes it swing |
|---|---|---|---|
| Cameras | Industrial network cameras, lenses, whether dust-proof or explosion-proof housings are needed | JPY 30,000 to 150,000 per unit | Outdoor, explosion-proof or high resolution pushes this up sharply |
| Installation | Mounting frames, cabling, PoE power, network runs, scaffolding | JPY 20,000 to 100,000 per unit | Ceiling height, whether cable routes exist, whether production must stop |
| Edge inference | GPU-equipped hardware running inference on site, sized by channel count | JPY 150,000 to 800,000 per unit | Determined by how many cameras run concurrently and how heavy the model is |
| Model tuning | Collecting site footage, annotation, additional training, threshold tuning | JPY 500,000 to 3,000,000 | Number of types, lighting conditions, whether an off-the-shelf model suffices |
| Integration | Implementing triage rules, notification, connecting to existing systems and PLCs, recording | JPY 500,000 to 4,000,000 | Whether equipment signals are taken, whether existing safety devices are linked |
| Operation | Maintenance, retraining, connectivity, cloud, licences | 15 to 25% of initial cost per year | Retraining frequency and how long records are retained |
The two layers most often overlooked here are installation and operation. Camera unit prices have come down. The cost of building mounting frames in a factory roof and pulling cable to them has not. Once explosion-proof areas or outdoor yards enter scope, installation can cost more than the hardware.
Operation deserves the same care. Get approval on initial cost alone and year two becomes a problem. AI models degrade when the site changes. A layout change, a switch to LED lighting, a different work-uniform supplier, seasonal changes in how sunlight enters the building — all of them change what the model sees. Assume retraining and threshold review at least annually, and secure that budget from the start.
There is one more line that is systematically underestimated — implementing the triage rules, which sits inside integration. This is exactly the design work described in disconnects 2 and 4, and it is a mix of what can be outsourced and what cannot. Zone definitions and duration thresholds cannot be decided by a vendor. Estimate that effort separately, as internal headcount cost.
If you are phasing it, the pattern that fails least often is to build one type across four to six cameras all the way through the triage-layer design, and only then widen the count and the type coverage. Put 30 cameras in at once and the alert flood starts before the triage design exists.
Three issues that get added in a Thai plant
Everything above applies to factories generally. For a Japanese-affiliated plant in Thailand, three more issues attach. The first one can be shrunk substantially just by changing the design.
PDPA — design your way out of handling faces
Under Thailand’s Personal Data Protection Act, biometric data falls under sensitive personal data as defined in Section 26. Processing that identifies individuals through facial recognition requires, as a general rule, explicit consent. Consent obtained from employees also carries the familiar argument about whether consent given inside an employment relationship can be considered freely given.
The most effective answer in practice is not to restrain the technology but to change the design.
Specifically, push toward these three.
- Human detection only. Judge that a person is present and that a helmet is absent, but do not judge who it is
- Blur faces, or do not retain face regions. Where footage is retained, retain it with face masking already applied
- Do not link to individual identity. Do not join to employee numbers, time-and-attendance data or access-control records
Meet those three and the data being handled moves away from being biometric data that identifies a specific individual. And from a pure industrial safety standpoint, there is almost never a need to identify individuals anyway. What is needed is which zone, in which time window, in which state — not who did it. If anything, a design that can identify individuals pulls the operation back toward the “we spoke to them and closed it” pattern described in disconnect 3.
None of which means the legal review disappears. Even with a non-identifying design, employee notification, stating the purpose, setting a retention period and managing access rights are all still required. Final confirmation of the policy should be taken from local counsel. What is written here is a design approach for practitioners, not legal advice.
Three things to settle internally first. The retention period for footage (30 days or 90 days). Which roles may view it. And a written rule prohibiting secondary use of the records for anything outside the stated purpose, such as performance evaluation or disciplinary action. Those three shape floor trust well before anyone gets to the legal interpretation.
CCTV operating guidelines are being developed
Work is under way in Thailand on guidelines covering CCTV operation. Reporting indicates that guidelines are expected to be published within roughly eight months from 23 March 2026. Neither the timing nor the content is settled at this point, so do not write it into an approval document as established fact.
The practical response comes down to two points.
- Do not hold the deployment waiting for the guidelines. The practical risk of an injury occurring during the wait is larger
- But build it so that added requirements can be met later. Concretely — retention period changeable by configuration, deletion of footage executable, access logging retained, and face masking able to be switched on afterwards
Confirm those four as specifications during vendor selection and they can usually be met at no extra cost. Requested after deployment, they become a design change and get expensive.
Communicating with a multinational workforce, and the compensation levy
Thai factory floors commonly combine Thai staff with workers from Myanmar, Cambodia and Laos. Safety communication has to be designed around that composition.
Plenty of plants make do with notices in Japanese and English. That does not constitute communication. In practice, the design looks like this.
- Make Thai the base language for notices, adding others according to who is actually on the floor
- Lead with pictograms rather than text. Literacy levels vary, so a message that works as a picture is the most reliable form
- For the AI camera deployment itself, communicate what is being recorded, what it is used for, who can see it, and that individuals are not identified — through both posted notices and a briefing session
The third point is less about legal compliance and more about floor acceptance. Cameras that appear without explanation are received as surveillance. A system received as surveillance will always be worked around.
The Workmen’s Compensation Fund is worth understanding too. In Thailand the employer bears the full contribution, and the rate is set by industry risk, broadly in the range of 0.2 to 1%. There is also a mechanism by which the rate is adjusted according to the establishment’s own accident experience.
So the effect of a safety programme can come back through the P&L as a lower levy. That said, do not build the payback case on it. The adjustment band is small relative to the order of magnitude of an AI deployment. One line in the approval document as a secondary benefit is about right.
What actually works as a payback argument is the modelled cost of a single injury. A lost-time injury costs far more than the direct compensation. The line stops, the cause investigation and report have to be produced, the authorities have to be dealt with, replacement staff arranged, the customer briefed, and countermeasures implemented. Stack those up in hours and elapsed time and the figure becomes substantial. Build that model first and the internal argument shifts from “is the AI expensive or cheap” to “how does it compare with one injury.”

How to run the first 90 days
Plan in a 90-day block. The reason is that whether you can get as far as the triage-layer design within 90 days largely determines the outcome. Put the other way, a plan that has only got as far as equipment selection after 90 days will keep drifting.
| Period | What you do | What you decide | What comes out |
|---|---|---|---|
| Days 0 to 30 | Audit two to three years of near-miss and injury records by location and category. Walk the floor and identify candidate zones. Run the 20-clip “needs a response or not” alignment exercise with the EHS lead and the supervisors | Narrow to one type. Narrow to three zones or fewer. Name the owners of the triage and correction layers | Target zone map (three zones or fewer), a one-page definition of hazardous events, an org chart covering primary owner, escalation and duty roster |
| Days 31 to 60 | Shortlist two or three vendors and require validation on footage shot in your own plant. Make them produce precision, recall and an estimated alerts-per-day figure. Draft the PDPA approach and the notices | Set the filtering conditions numerically (zone times time window times equipment state times duration). Set retention period and access rights. Write the go or no-go criteria as numbers | Vendor comparison with measured values on your own footage, filtering rule specification, notice and announcement drafts, the six-layer cost estimate |
| Days 61 to 90 | Install across four to six cameras and collect data for two weeks with notifications switched off. Feed the measured alert volume back into the filtering conditions. Then switch notifications on and run first response | Reset thresholds based on measurement. Fix the metrics that will appear in the twelve-month report. Decide the scope of the next type and camera count | Measured alert volumes, first-response records, a corrective action list, the expansion plan and budget |
The single most important item in that plan is the two weeks of data collection with notifications switched off, in days 61 to 90. Skip it and turn notifications on from day one, and the raw pre-filtering volume lands on the floor and the system loses credibility immediately. The alert volume the floor receives on the first day very nearly determines how the system is judged from then on.
The 20-clip alignment exercise in days 0 to 30 is the other item that gets skipped. It costs nothing and it is the only way to detect whether disconnect 2 is present. If the judgements diverge, close that gap before vendor selection, not after.
If a vendor declines the “validate on our own footage” request in days 31 to 60, that is itself a data point. How far catalogue figures diverge from your own site depends heavily on lighting, layout, work clothing and camera angle. Sign without that check and the post-deployment conversation becomes “this is not what we expected,” followed by a negotiation over additional cost.
The structure of this 90-day plan has a lot in common with other AI projects. On the principle of settling the decision point before selecting the technology, how to approach AI agent adoption works through the same sequence.
Frequently asked questions
What is AI safety management?
It is the general term for any system that interprets camera or sensor signals by machine in order to reduce events where a person gets hurt, and connects the result to human behaviour or equipment behaviour. It has a different purpose from visual inspection AI, which finds product defects, and from predictive maintenance, which forecasts equipment failure.
In practice it is best understood as three layers — detection (the camera picks it up), triage (narrow to events requiring a response), and correction (turn it into who does what, and record it). As of 2026 the detection layer almost never fails, and yet a very large share of deployments go in with the triage and correction layers blank.
How much does an AI camera factory safety deployment cost?
There is no single answer because it swings so widely with configuration. Estimating in six layers — cameras, installation, edge inference, model tuning, integration and operation — is the practical approach. As a rough guide, cameras run JPY 30,000 to 150,000 per unit, installation JPY 20,000 to 100,000 per unit, edge inference hardware JPY 150,000 to 800,000 per unit, model tuning JPY 500,000 to 3,000,000, integration JPY 500,000 to 4,000,000, and operation 15 to 25% of the initial cost per year.
All of those are guides only, and they move substantially with whether explosion-proof areas are in scope, ceiling height, whether cable routes already exist, and whether equipment signals are being taken. The two most commonly overlooked are installation and operation — estimate from the camera unit price alone and the numbers will not hold up later.
Can we reuse our existing security cameras?
It depends, and there are four things to check.
Resolution and field of view. Security cameras are usually positioned to cover a wide area, so the subject appears small in frame. Judging whether a helmet is present requires the subject to occupy a minimum size.
Mounting angle. A steep downward view from a ceiling corner shows the head from directly above, which makes PPE judgement difficult. Intrusion detection works fine from a high downward angle. PPE detection often does not.
How the video comes out. Whether the stream can be pulled through a standard protocol such as RTSP. If it is locked inside a proprietary recorder format, external inference cannot be applied.
Frame rate and compression. For types that judge motion, a low frame rate or heavy compression degrades accuracy.
The short version is that restricted-zone intrusion detection has a reasonable chance of running on existing cameras. PPE non-compliance detection and unsafe posture detection usually require cameras to be added or relocated. The most reliable way to check is to export a week of existing footage and have a vendor validate against it.
Is employee consent always required under Thailand’s PDPA?
It depends on how the data is designed. Processing that identifies individuals through facial recognition constitutes biometric data, falls under sensitive personal data, and as a general rule requires explicit consent.
A design that performs human detection only, blurs faces, and does not join to employee numbers or attendance data moves away from handling biometric data that identifies a specific individual. From a safety standpoint there is almost never a need to identify individuals. Shrinking the issue through design is the practical answer.
That said, even with a non-identifying design, employee notification, a stated purpose, a defined retention period and access-rights management remain necessary. Guidelines covering CCTV operation are also being developed. Take final confirmation of the policy from local counsel. What is written here is a design approach, not legal advice.
Which metrics should we use to measure the effect?
Not detection count. A high count might mean there is a lot of danger, or that the threshold is loose. And once detection count is the KPI, the floor starts walking through camera blind spots.
Hold three tiers. Tier one covers whether the operation is running — primary-owner response rate, mean time to first response, backlog. Measurable from day one. Tier two covers whether correction is accumulating — conversions to engineering controls, recurring zones eliminated, days to close a corrective action. Measurable from month two or three. Tier three is the final outcome — near-miss reports, lost-time injuries and frequency rate.
Write the year-one report from the top two tiers. Injury counts have too small a base per plant and only move on a yearly scale, so they cannot carry a first-year result. Note also that near-miss reports rising immediately after deployment is normal, and reporting a decrease as an achievement will thin out the reporting culture the following year.
Summary
The points worth carrying away about AI safety management in a factory.
- Treat safety AI as three layers — detection, triage, correction. Most of the cost sits in detection, but projects die in triage and correction. Understand up front that spend and failure probability run in opposite directions
- Japan’s 2025 occupational injury figures show
135,333workers killed or injured with four or more lost days, of which manufacturing accounted for26,371(down 305 people, 1.1% year on year). Fatalities from being caught in or between machinery were117, up 7 people or 6.4% — meaning the category AI detects most reliably is the one that is rising. Read it as a reference point for the shape of the problem in any overseas plant safety management programme - There are four disconnects. No decided recipient for the alert. A definition of “unsafe” that does not match the floor. Correction that stops at talking to the worker. A KPI that has become the detection count
- There are five types. Restricted-zone intrusion detection is the safe first move. Do not use unsafe posture detection for real-time alerting — use it as a daily or weekly report. Position interlock integration as an additional layer, never as a replacement for existing safety devices
- Convert “95% accurate” into alerts per day before deciding anything. A ten-camera configuration can produce 190 to 230 alerts a day. Improving detection accuracy further does not solve this — only triage-layer filtering does. Apply filtering to notifications only, and record every event
- Estimate cost across six layers — cameras, installation, edge inference, model tuning, integration and operation. Figures swing widely with configuration. Installation and operation are the two most often underestimated
- Three issues are specific to Thailand. PDPA shrinks substantially if you design your way out of handling faces. Because CCTV operating guidelines are being developed, specify that retention period, deletion, access logging and face masking are all configurable after the fact. Communicate to a multinational workforce primarily through pictograms
- For the first 90 days — days 0 to 30 narrow to one type and three zones and name the owners, days 31 to 60 validate on your own footage and put numbers on the filtering rules, days 61 to 90 collect two weeks of data with notifications off before switching them on
One last time. Detection is a solved problem. Injuries are not falling because nothing is connected behind the detection. Spending three months selecting cameras is a worse use of time than spending an afternoon writing one page that answers “the alert that fired during last night’s shift — what time this morning does someone look at it, and who.”
TOMAS TECH supports Japanese-affiliated manufacturers in Thailand locally, all the way through to connecting shop-floor data to the decisions it is supposed to feed. It is fine to come in at the stage of “we do not know which of the five types fits us” or “we just want to know whether our existing cameras are usable.” If anything, sorting that out before selecting equipment saves a great deal of rework later. We can start by walking the floor with you and working through the target zones and the triage-layer design together. To discuss where you are, get in touch through our contact page.
References
- Ministry of Health, Labour and Welfare (Japan), Publication of occupational accident statistics for 2025 https://www.mhlw.go.jp/stf/newpage_73382.html
- JRW Innovation platform, on preventing serious accidents with camera AI and safety management DX at UACJ manufacturing sites https://media.jrw-ip.jp/case/6575/
- Visionplatform.ai “AI-powered PPE detection in manufacturing” https://visionplatform.ai/ppe-detection-in-manufacturing/
- Securiti “Thailand Data Protection Framework’s Consent Requirements” https://securiti.ai/blog/consent-requirements-under-thailands-data-protection-framework/
- Chambers and Partners “Data Protection & Privacy 2026 — Thailand” https://practiceguides.chambers.com/practice-guides/data-protection-privacy-2026/thailand/trends-and-developments
- ALG & Associates, on Thailand’s workers’ compensation insurance system https://www.avance-lg.com/thailand/column/workers-compensation/
- Pertama Partners “Thailand AI Regulations 2026” https://www.pertamapartners.com/insights/thailand-ai-regulations-2026
- NSK Inc., on AI camera use cases for factories https://n-sk.jp/blog/ai-camera-factory-safety-and-defect-detection


