


A bearing or bushing can reach its specified final force and depth yet cause noise or play after assembly. If you plan to introduce AI anomaly detection for press-fit force–displacement curves, start with synchronized measurements, a clear definition of defects, and a comparison against your existing limit rules. Choosing a model comes later. This guide covers data collection, model validation, physical control of held parts, procurement requirements, and FAT/SAT for Thai factories, whether the press is new or retrofitted.
Why the complete press-fit curve matters
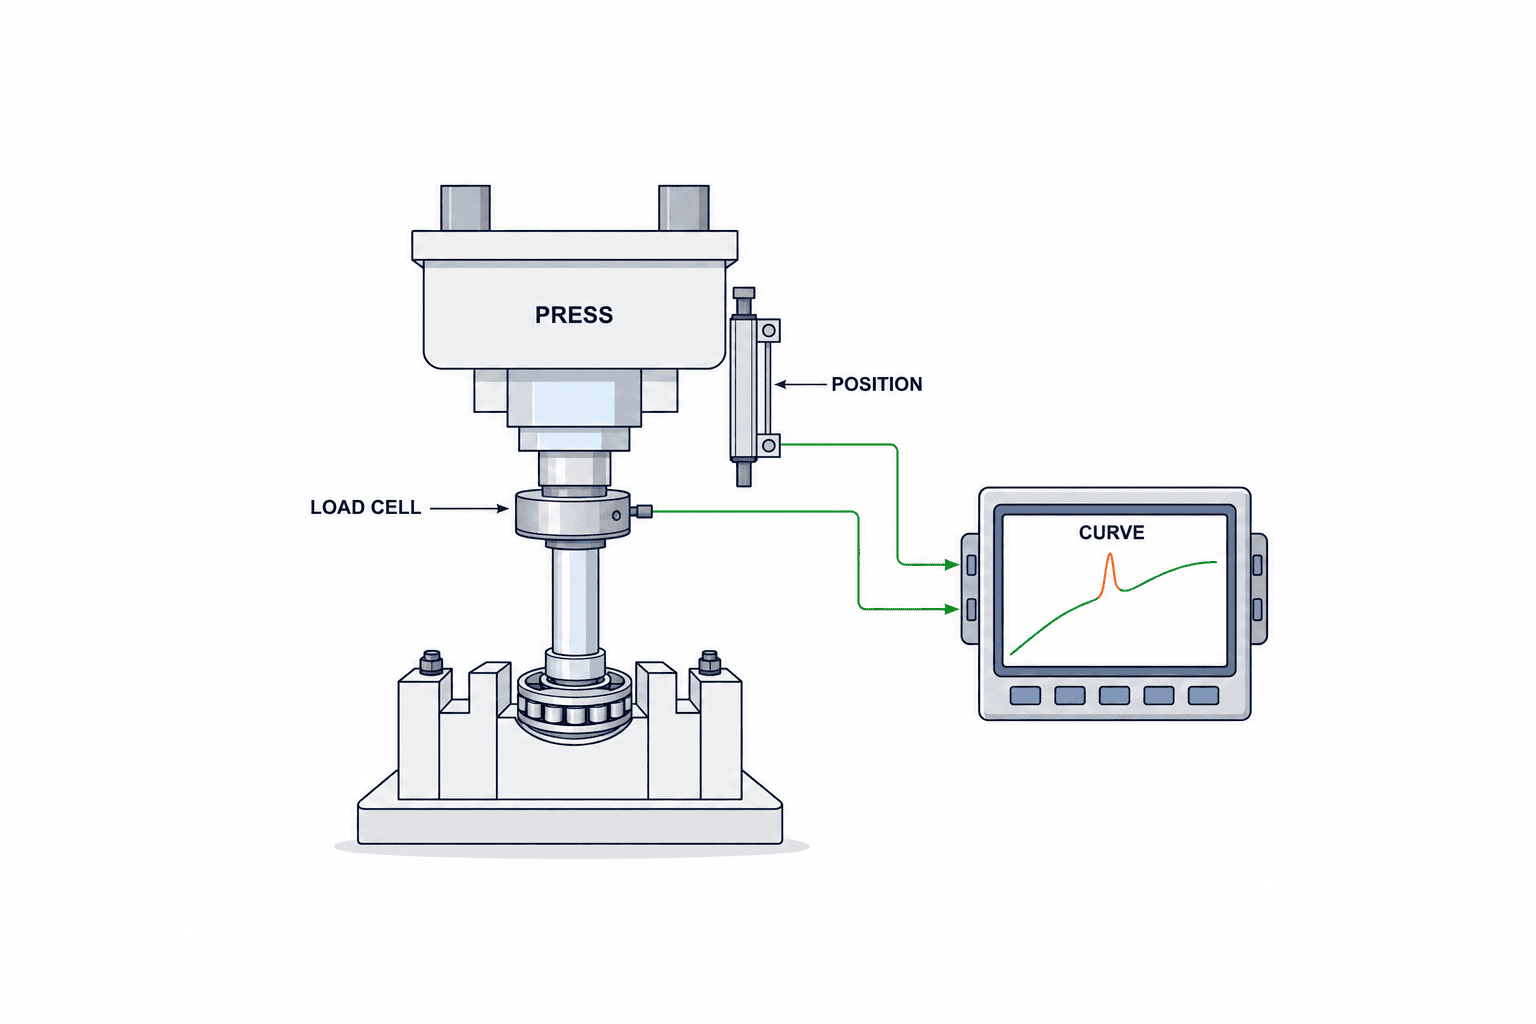
Force changes relative to displacement between first contact and final seating. Kistler explains how force and displacement sensors form a curve that can be evaluated for a joining operation. Promess describes recording the force-versus-position signature and evaluating it against upper and lower envelopes. These are established process-monitoring methods, independent of AI. See Kistler and Promess.
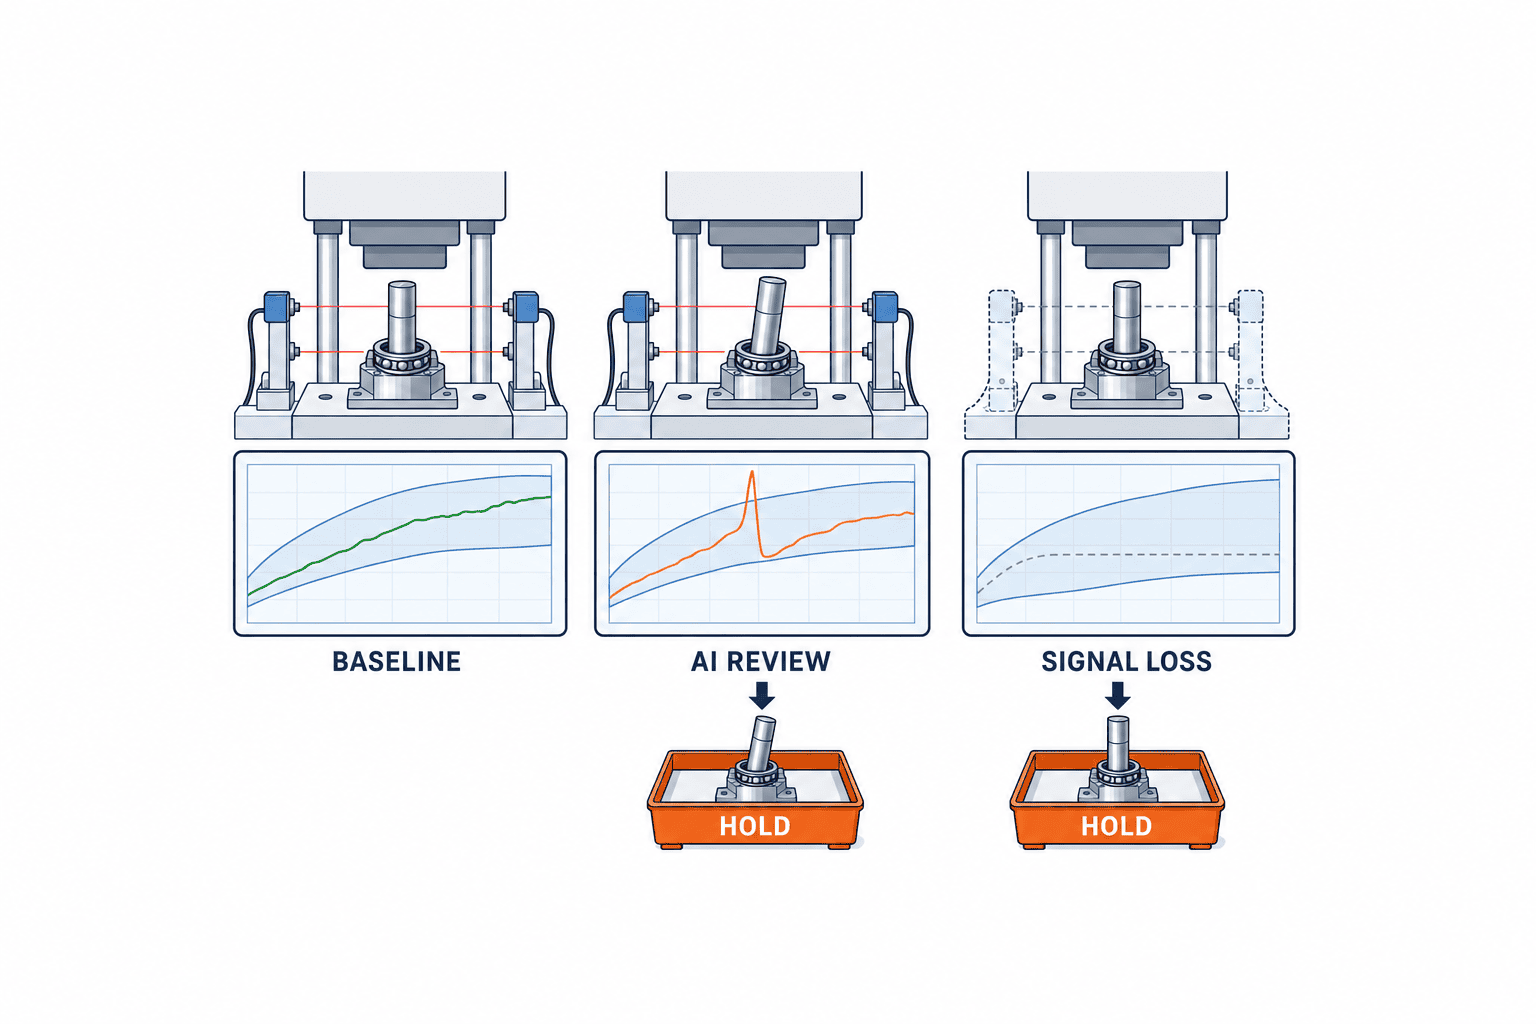
Two parts can have the same final force but different paths: one may rise smoothly; the other may spike, release, and rise again. The unusual shape is a reason to investigate misalignment, contamination, an out-of-tolerance combination, or a loose fixture or sensor. It is not proof of a particular cause. Confirm with dimensional checks, downstream testing, or disassembly. Promess lists tight and loose fits, wrong or absent parts, and misalignment as possible detection targets; this is not a performance guarantee for every application.
Our servo-press selection guide covers capacity, stroke, tooling and machine acceptance. Here the question is narrower: when does AI add measurable value beyond that press’s existing force–displacement limits, and how do you turn its output into a defensible product decision?
Define the loss before defining the AI metric
Map the defect to the process. Examples include a tilted bearing that later makes noise, an incompletely seated sleeve, excessive interference force caused by a dimensional mismatch, an empty press cycle, and a false alarm caused by a loose fixture. “Reduce defects” is too vague to choose labels or test samples. Separate product defects that must not escape from unusual conditions that may justify investigation without stopping every cycle.
Use three outcomes. OK means the specified process checks pass. HOLD means a human must check the part. NG means a defined stop or segregation condition is met. Decide in advance what happens when model confidence is low, the network fails, or sensor calibration expires. Depending on product risk, HOLD or a stop may be appropriate. An AI score must never replace a machine safety circuit.
Error costs are asymmetric. A good part held in error consumes inspection capacity and blocks work in progress. A missed defect can lead to a later line stop, customer sorting or returns. Report recall for each targeted defect, false-hold rate among confirmed good parts, undecidable rate, and time to release a hold. Overall accuracy is deceptive when defects are rare: a system that labels every part OK can look accurate and still be useless.
What data does press-fit curve AI need?
Link curves, results and parts with a cycle ID
At a minimum, record timestamp, machine, part and component type, lot, recipe revision, fixture, force, displacement, existing-machine result, AI score, disposition and reinspection result. Separate force CSV files and MES pass/fail records are of limited value if a curve cannot be joined unambiguously to its part. Use a unit-level or assembly-cycle identifier if possible. If individual serialization is impractical, design a PLC cycle counter and detect missing sequence numbers rather than relying on a loose timestamp match.
Store sampling interval, units, zero reference, filter settings and force/position synchronization method with each curve or dataset. A change in sampling or smoothing changes apparent peaks. Mixing N and kN, or machine absolute position and displacement after first contact, can mislead engineers before it misleads the model. The published overview of ISO 10012:2026 explains why measurement-process control is needed to have confidence in results. The measurement system is the foundation for AI, not an optional later check.
Align contact points without hiding defects
If the approach stroke before contact remains in a curve, a small difference in part placement may look like an anomaly. Teams may align curves at a specified contact-force threshold or process event. Fix the method before comparing models. Overaggressive alignment can erase the very shift caused by tilted insertion or incomplete seating. Preserve both raw and aligned curves and version the alignment routine.
Do not put different part designs, interference tolerances, materials, temperatures, fixtures and press speeds into one undifferentiated “normal” class. Establish a baseline for each physically comparable condition. If a variant lacks enough data, mark it outside the AI’s approved scope and continue with the validated conventional rule. A new part or fixture requires fresh validation, even if an older part looks similar. The NIST AI RMF Measure Playbook calls for documenting limits of generalization and reviewing metrics when operating conditions or data drift.
Label observed outcomes, not merely the old machine result
Calling every old-machine NG a true defect teaches the AI the old rule’s mistakes. Link curves to dimensional inspection, downstream functional test, disassembly evidence and disposition. Distinguish confirmed defective, confirmed good, under investigation and inconclusive. Do not silently merge unresolved parts with good ones. If a part is pressed again, preserve both cycles and their relation to the final product result.
Keep “high peak force” as an observation, “oversize bearing” as a possible verified cause, and “quarantine this lot” as a disposition. Mixing those concepts in a single label makes training inconsistent. Start with one or two defect types for which the factory has examples and confirmation methods. Where confirmed defects are scarce, compare a normal-only anomaly detector that routes unusual curves to HOLD with a classifier for known defects; do not treat every unusual curve as confirmed scrap.
Compare AI with the existing envelope on the same samples
Never assume AI will outperform conventional limits. The baseline can include upper/lower signature envelopes, final depth, peak force, and slopes or areas within selected curve windows. Promess describes such force-position limits and final-feature measurements. If they solve the problem at lower operating cost, an AI layer may have no business case.
Use the same parts, period and independently established downstream outcomes for both methods. A random train/test split can leak curves from the same lot, fixture and wear condition into both sets, making field performance look better than it is. Split at least by time; where feasible, reserve other lots, fixtures and shifts as holdouts. Test on later production lots before enabling automated holds. NIST recommends documenting test sets, metrics, methods and tools so evaluation can be repeated. NIST AI RMF Measure
The comparison table should show, for each defect type, confirmed examples, detections, misses, good-part holds, undecidable cases and how ground truth was established. “Five of five detected” is not strong evidence of reliable 100% detection. State the denominator and conditions, especially when samples are few. Artificially induced defects can prove the interface works, but they may differ from naturally occurring defects.
Possible methods range from transparent engineered features and thresholds through unsupervised anomaly scoring to supervised classification of known failures. Choose according to curve complexity and label supply. A proposal that specifies a deep model but omits explainability to engineers, cycle-time limits, and safe fallback for an unknown recipe is incomplete.
Hold preprocessing constant when comparing models
Contact-point detection, units, missing-value handling, resampling, smoothing and peak extraction should be fixed for all candidates. If the envelope reads raw data while the AI receives heavily smoothed data, the source of an apparent improvement is unclear. Store preprocessing version and parameters with the model version, and retain raw signals for replay.
An “anomaly score” is not the same as nonconformity. A model may identify a new but good fixture or temperature condition. Route unexplained scores to HOLD and investigate them against product requirements before redefining NG. Conversely, a known dangerous overforce limit must still apply even when the AI assigns a low score. AI is a supplementary decision layer, not a substitute for approved safety and quality limits.
Use honest denominators when defects are rare
If the factory confirms only ten target defects in 100,000 cycles per month, a one-week site test will not provide enough naturally occurring examples of every failure mode. Use induced samples to verify functions and a longer shadow-run to observe real defects. Size the observation period from the event rate and target defect categories; a short FAT result cannot certify future detection.
Calculate miss rate over confirmed target defects, and false-hold rate over confirmed good parts. Do not count parts later confirmed defective as false holds. Keep undecidable cases separate. Report exclusions and their reasons so a model cannot improve its apparent accuracy by declining difficult cases. If a low-volume part type has too few examples, mark its performance “not yet evaluated” instead of hiding it in a pooled metric.
Consider a fictional comparison set containing 40 confirmed target defects and 19,960 confirmed good parts. Suppose the existing rule detects 30 defects, misses ten and holds 120 good parts. The AI detects 36 defects, misses four and holds 220 good parts. Target-defect recall rises from 75% to 90%, while false-hold rate among good parts rises from roughly 0.60% to 1.10%. The factory gains six detections but creates 100 extra inspections in this set. Compare the value of those six prevented escapes and the cost and capacity of the extra holds over the same period; do not adopt on recall alone.
If many of the 40 defects were deliberately induced, their 40/20,000 share is not the natural production defect rate. The enriched set can compare detection, but staffing needs and payback must be recomputed using the actual field prevalence. Ask vendors for a table of missed defects, good-part holds and undecidable cases across several score thresholds. Raising recall often increases holds; the plant should approve the operating point against quality risk and inspection capacity.
Break acceptance results down by part type, lot, fixture, shift, defect type and recipe revision. Show counts beside percentages, especially for small groups. Create a unit-ID list of cases caught only by AI and cases caught only by the conventional rule. That makes it possible to preserve a valuable legacy rule while fixing the specific gap AI addresses. Establish ground truth independently where possible: an inspector who sees the AI verdict before deciding “defective” can unintentionally bias the label. Disputed cases should be adjudicated by quality and process engineers against prespecified dimensional or functional evidence, with unresolved cases reported separately.
Control model changes as you control fixtures and recipes
Tool wear, material changes, fixture replacement and speed revisions alter the normal waveform. Track not only anomaly counts but alignment shifts, contact points, peak-force distributions, hold rate and downstream outcomes. When holds suddenly rise, inspect sensors, recipes and incoming material before retraining. Training on a drifting measurement system can absorb a fault into the new definition of normal.
Run a proposed model beside the current version on saved and recent field curves. Compare escapes and false holds. Record who approved the change, training period, exclusions, preprocessing, threshold, deployed machines, deployment time and rollback package. Link the model and process recipe versions to lot history. NIST recommends monitoring deployed-system behavior and revisiting metric validity as conditions change. NIST AI RMF Measure
The broader factory AI anomaly-detection guide discusses equipment signals and maintenance. This article concerns product quality in each press cycle. Equipment alarms and the disposition of a pressed part can share a sensor but have different owners and acceptance evidence.
After the score: who controls the held product?
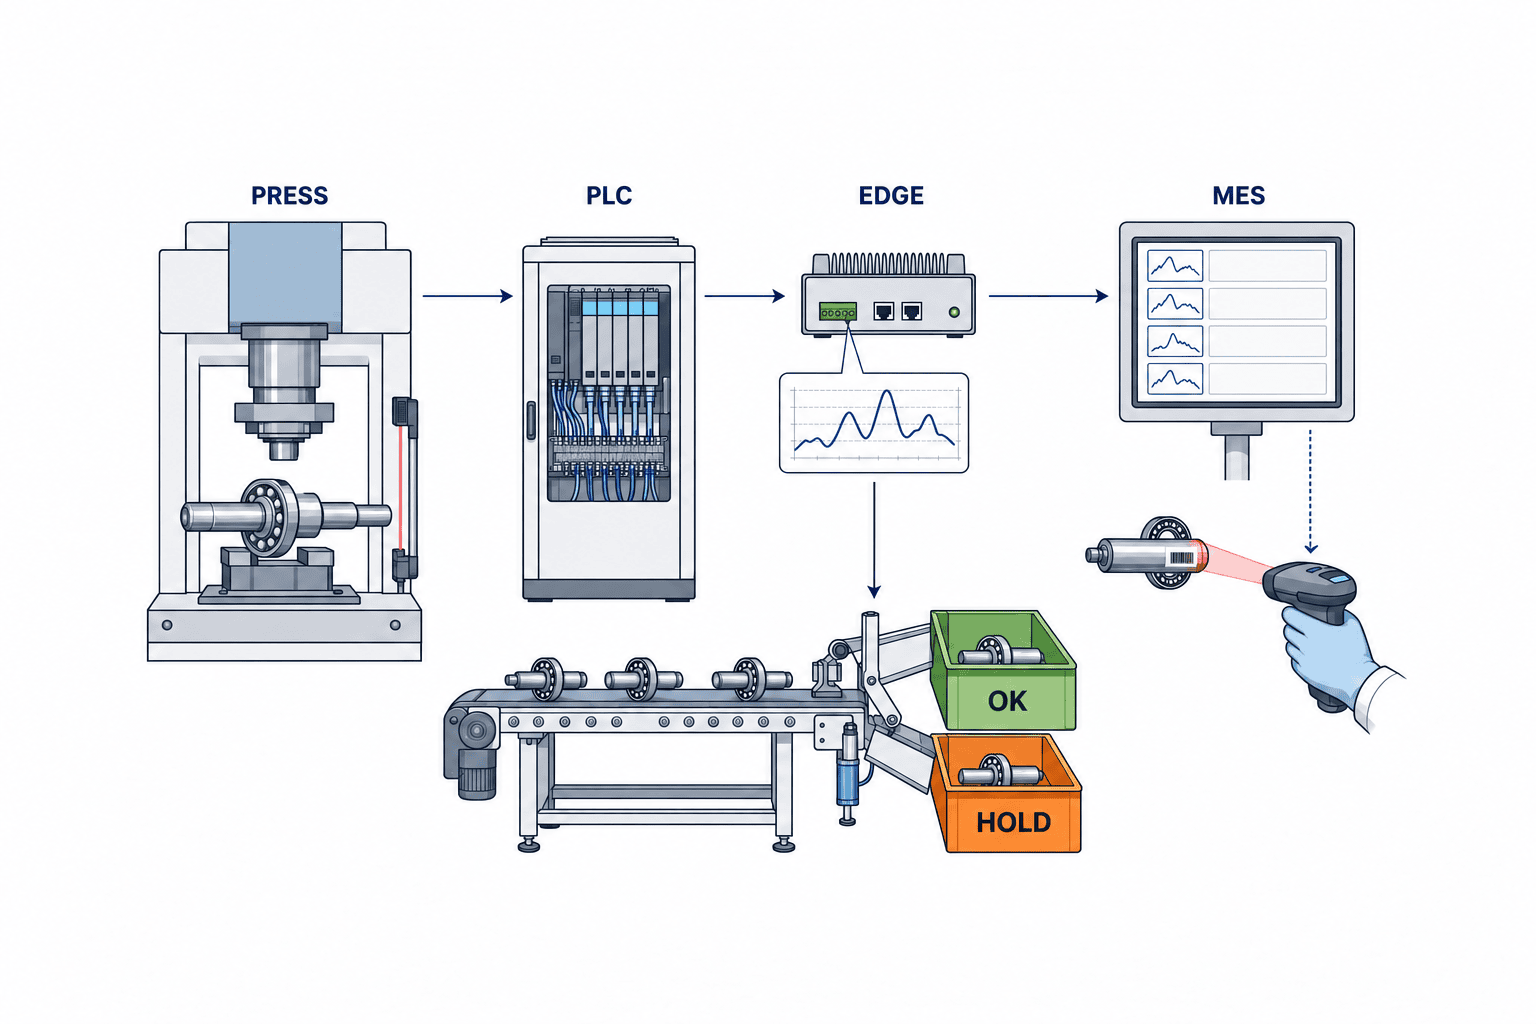
A practical flow is load cell and position sensor → PLC or monitoring unit → curve store and model → OK/HOLD/NG result → physical diverter and MES record. A PLC need not retain all raw curves long term, but it must not lose the disposition or allow an unclassified part into the good stream. The OPC Foundation Result Transfer specification provides a standard way to describe machine results; implementation still requires mapping actual machine and MES fields.
Give HOLD parts a physical route distinct from approved product. An alarm lamp with a shared chute does not prevent mixing. Set barcode checks, access permissions, reinspection responsibility, release authority and rules for repressing or scrapping. The AI’s output and a release-for-shipment decision are separate permissions. Record the person, reason and evidence for each release.
Choose a defined state for lost network or server. A high-risk line may stop; another may run temporarily under the previously validated envelope with added inspection. If limited running is approved, specify part types, duration, additional checks and reconciliation after recovery. Treat sensor failure and model failure as distinct alarms. A cycle with no valid curve can never become OK because a software service returned a default value.
Assign routine ownership: zero checks each shift, calibration history, reference curves after fixture changes, and revalidation when recipes change. ISO 17359:2018 gives general guidance for machine condition-monitoring programs, including how to think about measurement and recording. It does not define press-fit product acceptance limits.
A useful RFP for Thai plants
Avoid “detect anomalies with AI” as the whole specification. Describe the machine controller and sensors, acquisition rate, part variants, annual volume, target failure modes, current rule performance, and how downstream or customer failures are confirmed. Protect drawings and curves under the relevant agreements, and give competing vendors the same anonymized evaluation set.
Ask each supplier to specify signal access and synchronization, raw-data format, network and offline architecture, operator interface, model update and rollback, decision latency, failure behavior, support ownership, and rights to data and model artifacts. Break out sensors, PLC changes, MES mapping, tooling, labeling, commissioning, training and maintenance rather than comparing AI license fees alone. Retrofittable monitoring systems exist, but machine-specific mechanical, electrical, downtime and safety checks remain necessary. Kistler process-monitoring examples
| RFP area | Specify | Evidence at acceptance |
|---|---|---|
| Measurement | Units, calibration, sampling, synchronization | Raw curve and calibration/sync records |
| Identification | Part, lot, cycle ID, recipe revision | Curve-to-MES reconciliation log |
| Decision | Envelope, AI and HOLD precedence | Side-by-side result table |
| Segregation | Diverter, release permissions, reinspection | Test with actual parts |
| Failures | Stop or limited-run conditions | Disconnection and restart trials |
| Updates | Approval and rollback | Version history and rollback trial |
An attractive PoC screen is not acceptance evidence. Look for confirmed failures represented in curves and an end-to-end hold process. The servo-press selection guide supplies the complementary machine requirements.
Design FAT and SAT around failure modes
At FAT, compare the old rule and AI on the same frozen dataset and parts. Record part type, lot, fixture and process conditions. Include adverse conditions selected before seeing the result. Label purpose-made misalignment or wrong-part samples as *induced defects* and report them separately from natural failures. Test a part that passes final force but has a different mid-curve, missing force or position signals, an unapproved recipe, server loss and clock mismatch. Where a condition cannot safely be produced on the real press, use simulation or recorded-signal replay.
At SAT, use the plant’s machine, network and people. Check the first cycle after startup, shift and fixture changes, brief power loss, LAN loss, MES outage, and reconciliation of unsent results after recovery. Verify that a part awaiting a decision cannot enter the good chute, and that release records include the responsible person. For Thai operator displays, English maintenance screens and Japanese headquarters reports, verify that each language explains the *same state code* rather than merely translating a screenshot.
Gate the transition from shadow mode to automatic holds
In shadow mode, record AI decisions while product routing and shipment continue under the approved process. This gathers real lots, temperatures, shifts and fixture changes without suddenly stopping large numbers of good parts. But an AI “miss” during shadow mode may remain unknown when no downstream test examines the part. Agreement between AI and the old rule is not sufficient: specify how target defects become confirmed and which failures are outside the observation window.
Quality, production, maintenance and IT owners should approve a documented changeover gate. Check that (1) the authorized part and recipe list is frozen; (2) missing signals route to HOLD or stop; (3) evidence shows no increase in misses relative to the existing rule; (4) added holds fit within inspection capacity per shift; (5) release actions are traceable; and (6) a return to the previous model and operating mode has been tested on the machine. If an item is unproven, limit the part scope or extend shadow running. A few quiet days cannot demonstrate recall for rare defects.
During the first week after cutover, reconcile approved part types and recipes daily, and compare holds by cause with inspection capacity. Avoid automatically loosening the score threshold when the hold rate rises. With quality approval, narrow the scope, add review capacity, or inspect preprocessing and measurement. Loosening the threshold may improve apparent machine availability while increasing escapes. Keep change dates for models, thresholds and release permissions so before/after trends can be compared under like conditions.
Production monitoring continues after acceptance. Review misses, false holds, undecidable cases and recovery-related data gaps by part type every month. Mark fixture and material changes on trend plots. If no defects occur in a month, do not call it “100% detection”; report the cumulative observation period and approved scope. This is how a PoC result becomes a controlled shipment decision.
Acceptance thresholds depend on the product and its risk. A sound template is: do not increase misses of confirmed target defects relative to the current rule; keep extra holds of confirmed good parts within an agreed cap; return a decision before the diverter; and allow no curve-to-part-ID mismatch. Where natural defect evidence is scarce, extend production observation in shadow mode before enabling automatic HOLD. Freeze model and preprocessing versions during acceptance and keep a log of every tuning change.
Calculate the business case with both escapes and false holds
Begin with measured baseline quantities: escaped target defects times the cost per event, extra good-part holds times reinspection cost, and downtime times its loss per hour. Add sensors, PLC and data integration, model development, and recurring calibration, storage, maintenance and revalidation. Do not count the same incident both as an avoided defect cost and as avoided downtime unless its cost components are explicitly separated.
Here is an illustrative calculation, not measured Thai-plant performance or a supplier guarantee. Assume 600,000 cycles per year; target-defect escapes fall from 0.15% to 0.06%; and handling each escape costs THB 2,500. That is 540 fewer escapes and THB 1,350,000 avoided cost. Assume extra false holds equal 0.6% of cycles, with THB 45 inspection cost each: 3,600 holds and THB 162,000. Subtract THB 350,000 in annual maintenance, calibration and revalidation, and the net annual benefit is THB 838,000. For THB 1,800,000 initial spending, simple payback is about 2.15 years. This simplified example excludes downtime, customer compensation and time value of money.
Do not put the assumed improvement from 0.15% to 0.06% into an RFP as if it were proven. Measure both methods against the same field outcomes. With rare failures, extend the evaluation or use a conservative lower-bound benefit scenario. More false holds quickly extend payback. Customer requirements for traceable process evidence may add value, but list them separately rather than hiding them in a claimed detection-rate improvement.
Frequently asked questions
Is press-fit AI always more accurate than envelope limits?
No. Final values and a force–position envelope may already separate the relevant defects. Add AI only when a same-data comparison demonstrates useful mid-curve information that current rules miss. Account for false holds, latency and model maintenance along with recall.
Can a factory proceed with very few defect examples?
A normal-curve anomaly PoC is possible, but not every outlying curve is a defective part. Start in shadow mode, route suspicious cases to review, and confirm outcomes using dimensions and downstream tests. Do not guarantee production recall based only on a handful of induced samples.
What must be checked when retrofitting an old press?
Confirm that force and displacement can be captured in the same cycle, the PLC can control physical segregation, and calibration and machine safety review are feasible. Direct sensing in the force path and indirect sensing from frame strain require different interpretation. Available retrofit hardware does not guarantee a fit with this press, tooling, wiring or allowable downtime.
Which RFP and FAT/SAT requirements matter most?
In the RFP, define target failures and the curve-to-part join. At FAT, compare AI and existing rules under the same conditions. At SAT, prove segregation, failure fallback and release audit records in the local line. A polished demo or generic AI benchmark cannot establish protection against actual product escapes.
Must the Thai factory send raw curves to Japanese headquarters?
No. An on-site edge system can make decisions while sending only agreed results or summaries. Decide storage location, offline behavior, maintenance access and customer-contract restrictions first, then share only the signals needed for the agreed purpose.
Conclusion
For press-fit AI, first establish trustworthy measurement, link each curve to the part and recipe, test its incremental value against the existing envelope, and finish the physical HOLD process. Improving the envelope alone may be the right decision if AI adds no measured benefit. Procurement should prioritize data definitions, a defensible evaluation table, safe failure behavior and FAT/SAT evidence over a model name.
If you are still deciding whether your current press can export usable curves or what to validate before adding AI, contact TOMAS TECH. We can review the current machine, sensors, PLC and MES and scope an acceptance test before a larger commitment.
References
- Kistler: Force-displacement measurement — force/position curve measurement and evaluation.
- Promess: UltraPRO Monitoring — stored signatures, envelopes and target conditions.
- Kistler: Process monitoring in production — press-fit monitoring and retrofit examples.
- ISO 10012:2026 — public overview of measurement-management requirements; the full paid standard was not consulted.
- ISO 17359:2018 — general machine condition-monitoring guidance, not a press-fit acceptance standard.
- NIST AI RMF Measure Playbook — evaluation, documentation and drift.
- OPC UA for Machinery Result Transfer 1.01 — machine-result exchange specification.
*The investment example is fictional and illustrates the calculation method. It does not guarantee performance, cost or payback.*


