


Adding voltage and harmonic fields to an energy meter does not necessarily explain why a factory machine stopped. A power quality monitoring system must record where and when voltage or current changed on each phase and how the equipment responded. This guide covers a practical rollout in an existing Thailand plant: selecting measurement points and records for voltage sags, short interruptions, harmonics and imbalance, then carrying the evidence through an RFP, FAT and SAT. Set equipment limits and responsibility at the utility boundary from the supply agreement, equipment documentation and site measurements.
Separate power quality monitoring from energy-cost monitoring
Energy monitoring answers how many kWh a machine used, when it used them and how to improve demand or energy intensity. Power quality monitoring asks whether voltage deviations, brief interruptions, waveform distortion or phase imbalance affected a process. A meter may support both, but the time resolution and evidence are different. Minute averages or monthly consumption cannot reconstruct every short event that restarted a PLC or tripped a drive.
Our factory power monitoring guide covers consumption by machine and time band, architecture and cost scope. This article focuses on events needed for stop investigations. The measurement-point and installation considerations in our energy monitoring system guide remain useful, but an energy meter does not necessarily store the waveform of a voltage sag. Mixing purposes can leave the very phenomenon of interest out of the instrument specification.
Start with past stop reports: equipment, timestamp, fault code, recovery action, affected product and other machines that stopped simultaneously. Treat an operator’s “probably a sag” as a hypothesis. Loose connections, low air pressure, PLC communication problems, drive overload and supply-voltage changes can all look like “machine stopped,” yet require different remedies. The objective is to compare the presence or absence of an electrical event with the equipment response on one timeline.
Narrow the initial questions to three
First, can the system record a voltage event at the time of a stop? Second, was it observed near the incoming supply, near the equipment, or on both sides of a branch? Third, if similar events stopped one machine but not another, what explains the different response? These answers guide whether to add metering, correct wiring, protect a control supply, examine equipment immunity or discuss evidence with the electricity supplier.
Do not buy a filter or UPS solely because a dashboard shows a “bad” power quality number. If harmonics are observed, the relevant load, affected equipment, measurement location and intended improvement still need definition. Plan the pre-change baseline and a comparable post-change verification before selecting the remedy.
Turn a stop ticket into a measurement plan
Suppose a forming machine stops several times and maintenance notes only “main power fault.” Separate a timestamp recorded by its controller from the time an operator submitted the ticket. Use the single-line diagram to see whether the main circuit, control supply and nearby machines share a feeder. Measurements at the incoming supply and just before the forming machine can then distinguish a common event from a local one. If the drive reports no undervoltage but the PLC restarted, investigate the control supply wiring and hold-up behavior as well. This is a hypothetical investigation sequence, not a claim about any plant’s root cause.
If an inspection machine stops when adjacent welding equipment operates, compare welding current, voltage on their shared feeder and the inspection fault code at the same time. Coincidence does not prove the welder caused the stop. Shared-wiring voltage drop, a poor connection, the inspection power supply’s tolerance and other simultaneous loads are candidates. The event record narrows the remedy and lets the plant check whether the relationship disappears after a change.
Work backward to measurement points, required waveforms, equipment logs and clock accuracy. Metering every board at once can delay the project. Start with a high-impact machine whose stop times are recoverable and where evidence gives a credible electrical hypothesis. A portable recorder can test a hypothesis before permanent installation. Choose a measurement period that includes representative product and seasonal load conditions, and record the reason for that period.
Do not compress sags, interruptions, harmonics and imbalance into one “abnormal” value
IEC 61000-4-30:2025 defines measurement methods for AC power quality phenomena including voltage dips and swells, interruptions, transients, voltage imbalance, harmonics and interharmonics. It supersedes the 2015 edition and describes Class A and Class S methods. It supports comparable measurement; it does not give a universal trip threshold for every factory machine. State the standard edition and the phenomena to be measured in the RFP.
A sag is a short reduction in supply voltage. Which phase was affected, the depth and duration all matter to the equipment response. A short interruption, voltage swell and sharp transient are distinct events. Store not only an event name but the start time, pre-event state, minimum or maximum, duration, phase and voltage and current waveforms where required. If IEC classifications are used, retain the actual trigger thresholds, hysteresis, reference voltage and meter configuration.
Harmonics occur at integer multiples of the fundamental frequency; interharmonics fall between them. Voltage distortion and current distortion mean different things. A nonlinear load such as a drive can distort its current without the incoming-supply voltage being distorted by the same proportion. Current THD can appear large at light load, so examine the fundamental current, actual current and operating state as well as the ratio. IEC 61000-4-7 addresses measurement instrumentation and methods for harmonics and interharmonics. Do not assume meters showing “THD” use identical calculations or aggregation periods.
For three-phase imbalance, distinguish line-to-line from phase voltage, voltage from current, and the calculation used. Large single-phase loads, connections and upstream supply conditions are among the possible causes. Do not diagnose from the imbalance number alone; inspect phase currents, load operation and board configuration. IEC 61000-2-4:2024 provides compatibility levels for low-frequency conducted disturbances at in-plant points of coupling in industrial locations. These levels are not an automatic equipment guarantee or one plant-wide acceptance threshold.
Preserve the measurement conditions needed for comparison
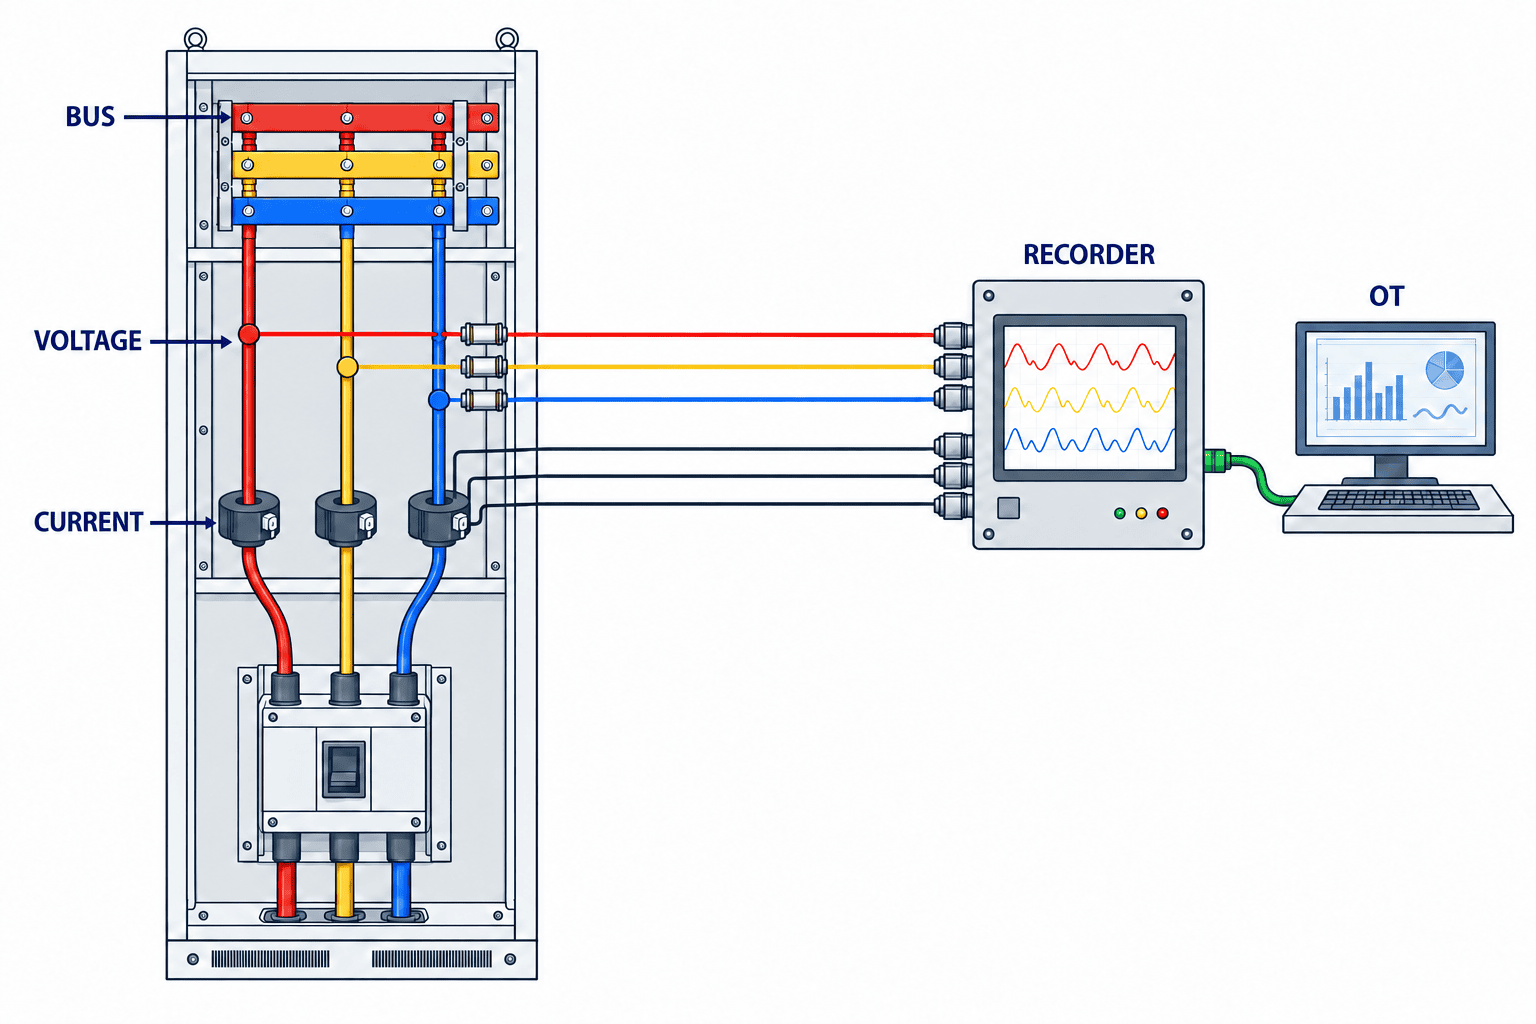
Record whether the system is three-phase three-wire or four-wire, nominal voltage and frequency, VT/PT and CT ratios, polarity, ratings and positions, wiring mode, clock synchronization and firmware version. Retrofitting split-core CTs still requires verification of conductor direction and phase mapping, CT applicability, board space, secondary wiring and work safety. Being able to clamp a CT around a conductor is different from having a safe voltage tap for waveform measurement. A qualified electrical team must decide whether work can be done energized and establish isolation and testing procedures.
A catalog claim of “Class A” does not prove that every needed feature, configuration, transducer and data path has identical performance. Check the instrument’s declared scope, calibration, voltage and current inputs, event memory and behavior on power loss. IEC 61000-4-30 specifies measurement methods, while IEC 62586-2 addresses functional tests and uncertainty. State which parameters use which class and which checks will be performed at acceptance, rather than merely listing standards.
Select the instrument backward from required events
Compare candidate meters on more than kWh accuracy, displayed fields and protocol. Ask which phases support sag and interruption detection, whether voltage and current waveforms are captured together, whether pre-event samples remain, whether triggers are configurable, and what survives a power failure. For harmonics ask whether voltage and current are measured, the supported range and the measurement and aggregation methods. For imbalance ask whether the instrument provides only a present number or also history and event information.
Data extraction matters too. A waveform view on the meter is of limited use if a central system cannot link it to the event ID; maintainers then visit every board. Identify special software, licenses or support contracts needed for export. Compare internal buffer capacity with likely network recovery time and event rate. If auxiliary power disappears with the disturbance, verify whether the meter can retain the end of the event. Choose by whether the required evidence reaches the investigator, not by product name.
Treat a manufacturer’s automated “upstream/downstream” indication as an investigation clue, not a final allocation of fault or approval for a modification. Transformers, multiple supply paths, capacitor equipment and simultaneous load changes complicate interpretation. Combine waveform, single-line diagram and electrical inspection. In a demonstration, ask the supplier to explain its direction judgment for a case resembling the plant network.
Place meters at the incoming supply, key branches and sensitive machines
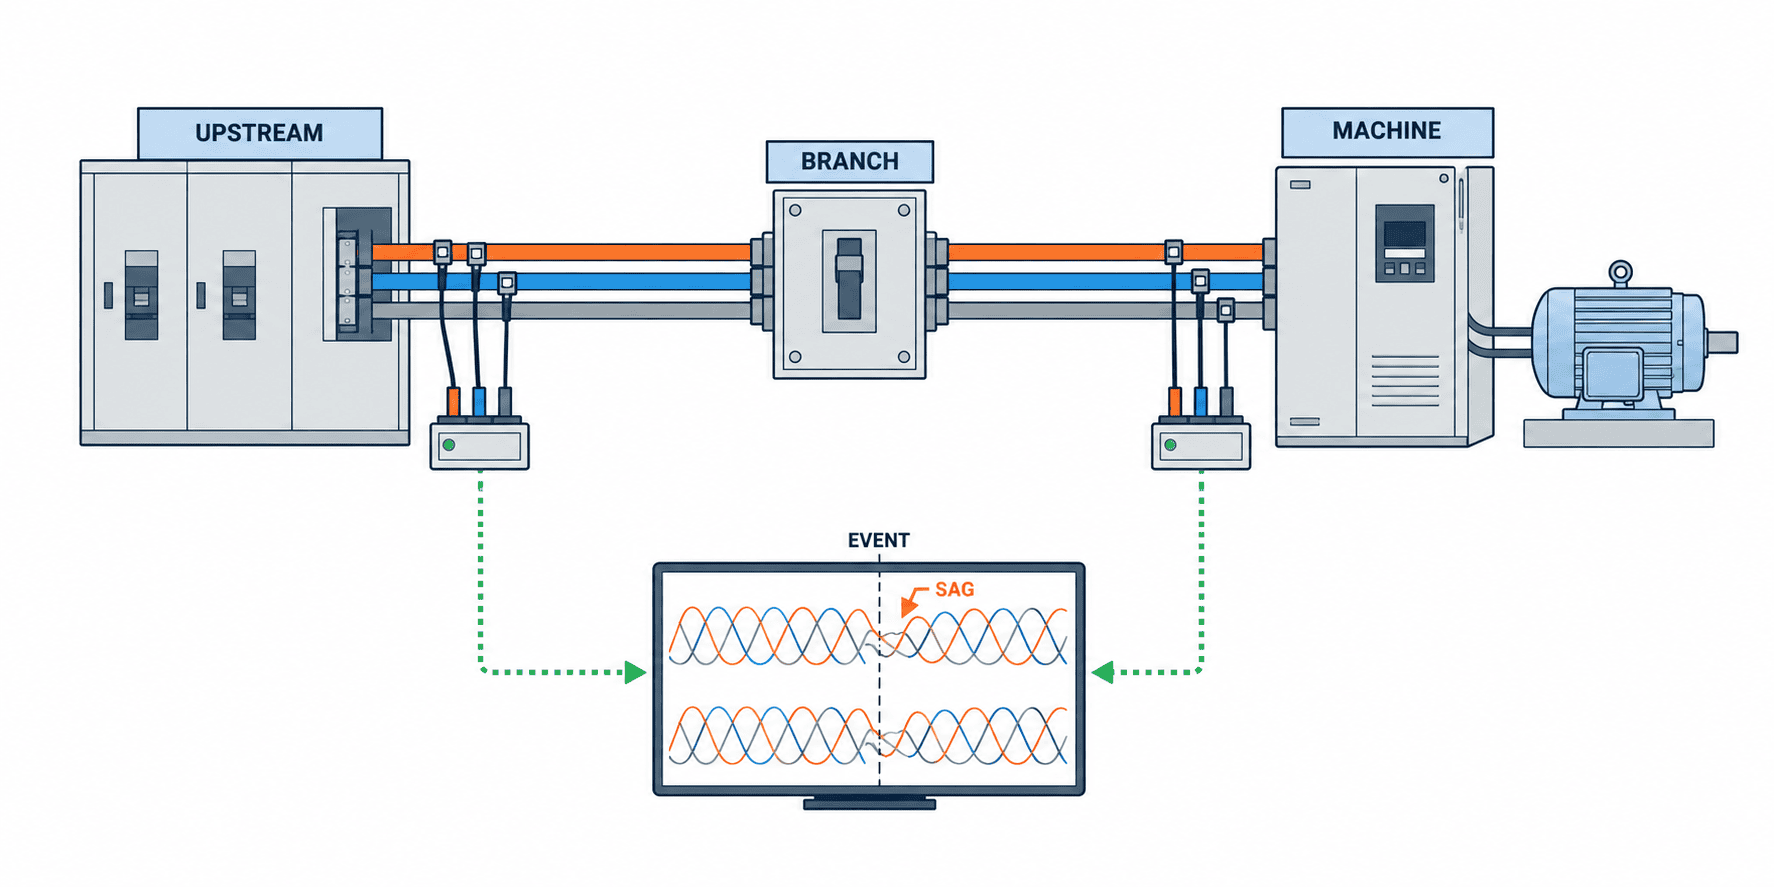
An incoming-supply meter is useful for a plant-wide common event. A disturbance at one internal feeder or poor connection may be weak or absent there. A meter only at one machine cannot readily distinguish an upstream event from current drawn by the machine itself. Overlay the incoming point, transformer secondary, major branches and recurring-stop equipment on a current single-line diagram. Select the smallest set of points that answers the investigation question.
The first layer, at incoming supply or a main board, establishes whether a common voltage event arrived and provides a long-term view. The second layer, at critical feeder entries, separates buildings, transformers, drive-heavy circuits or feeders with recurring stops. The third layer, just before a sensitive machine or control supply, shows what that equipment actually received for comparison with PLC and drive logs. Not every feeder needs the same high-spec permanent meter; fixed and portable recorders can be combined.
Link a meter name to the drawing revision, bus, breaker, CT/PT and terminals, not just a label such as “MCC-1.” If a board is modified, update a date-effective mapping instead of rewriting historical meter names. Otherwise, after an outage no one can show which voltage fed which PLC. If needed, record UPS or 24 V control-supply status as a separate signal rather than mixing it with the main circuit.
Do not declare “upstream” or “downstream” from one meter alone
Simultaneous sags at the main board and several feeders support investigating a shared upstream event. A sag on only one feeder, coupled with a current change on that feeder, supports investigating its own load or connection. Yet unsynchronized clocks, different triggers, transducer characteristics, wiring or missing pre/post waveforms weaken direction inference. Confirm an electrical-source conclusion with multiple points and physical inspection.
The site survey should record spare board space, conductor access, VT/PT availability, CT fit, cabinet temperature, auxiliary supply, communications route, network segmentation and possible isolation dates. Electrical design must address protected voltage taps, fuses, terminals, test points and board safety zones. Set the modification safety plan before purchasing meters; discovering that a board has no safe connection point after purchase changes both schedule and cost.
Design averages, RMS events and waveforms as distinct records
Trend averages, RMS event records and pre/post waveforms have different size and purpose. Averages support comparisons across days but may hide a short trip. An RMS event gives start and end, affected phase, depth and duration. A waveform shows voltage and current around the event in more detail. Choose triggers and retention according to the investigation need.
Schneider Electric’s PM8000 waveform documentation illustrates capturing pre- and post-event samples and configuring waveform length and sample count. That is a product example, not a feature or resolution guaranteed in all meters. Portable products such as HIOKI’s PQ3198 and Fluke’s 1770 series can be candidates; verify phenomena, input and safety rating, power, storage and export for the exact model.
If a waveform is required, specify which voltage and current channels, how many cycles before and after a trigger, and at what resolution. Test what happens when memory fills or the network is down. If COMTRADE is required, specify that separately from a numeric CSV. Schneider Electric’s ION9000 configuration documentation shows why nominal values, VT/PT and CT ratios, clock and trigger thresholds matter. Some configuration changes clear stored records, so backup and change history belong in the operating procedure.
Clock errors can destroy the correlation
Synchronize the power meters, PLCs, SCADA, MES and drives to a common reference and document time zone behavior. A plant can display ICT while storing UTC, as long as the representation is consistent and failed synchronization is visible. A clock several minutes wrong reverses the apparent order of a stop and a sag. Define the correlation accuracy from the process risk in the RFP and choose NTP, PTP or GPS as appropriate, rather than imposing one maximum-precision network on every meter.
Keep event ID, measurement point, phenomenon, start and end, phase, key values, waveform file, meter health and configuration version together. Keep equipment ID, PLC alarm, drive fault, operating state, product lot, affected quantity and recovery time as a separate event, then join them by time and electrical topology. A voltage event alongside a stop does not automatically prove causation. Compare other machines, current changes and inspection findings. Neither a waveform without equipment logs nor equipment logs without electrical evidence fulfill the purpose.
Explain periods in which no event was recorded
A day with no event notifications supports “no detected event” only if the meter ran, inputs were valid, clocks and communications were healthy and memory had capacity. Store online state, broken-input diagnostics, settings version, clock status and last successful retrieval. Mark outages in the monitoring system as missing data rather than zero events; a blank graph may otherwise look like a quiet normal day.
Waveforms are larger than ordinary numeric series. Choose retention from investigation needs, quality-record linkage, storage cost and restore time. Link important files to investigation tickets and apply a defined archive rule to ordinary events. Use an event ID, file hash, retrieval time, meter ID and version instead of relying on filenames alone. Control access and deletion history where needed.
When analyzing a later stop, distinguish “below trigger threshold,” “meter was offline,” and “record lost in communication.” An absence of a file is not proof that no electrical phenomenon occurred. Include data-quality status in reports so people can judge the strength of a causal conclusion.
Keep OT monitoring separate from control commands
The core data path reads events and waveforms from meters and displays them to investigators. Writing commands into PLC control is not a necessary feature. When connecting to an existing OT network, set read-only scope, meter and gateway identities, clock source, outage buffering, authentication and update procedures. Even if data goes to the same platform used by factory power monitoring, waveform files differ greatly from kWh readings in size and frequency. Store event metadata separately from the files rather than forcing both into numeric database fields.
NIST SP 800-82 Rev.3 gives guidance for securing OT in light of reliability, performance and safety needs. Before exposing meter communications to an office network, agree on route, privileges, monitoring and backup with OT owners. Consider cloud export authorization and continuity during communication loss separately from the electrical equipment’s stop behavior. Meter-side recording should continue when a dashboard is unavailable, with gaps and duplicates detectable after recovery.
A dashboard should connect event depth and duration, location, affected equipment, simultaneous stops, investigation status, suspected cause, action and recurrence check. Electrical maintenance needs waveform and topology; production needs stop impact; energy staff need trends and evidence for utility discussions. The common event ID lets these teams investigate the same event.
Put the question and acceptance evidence into the RFP
Open the RFP with goals such as recording voltage events with stops, separating incoming and internal events, and investigating harmonics or imbalance trends. Supply the single-line diagram, candidate points, target machines, existing meters, VT/PT and CT conditions, communications infrastructure and isolation constraints. Require bidders to show which measurement point and recording method answers each goal, not only a model number.
| RFP item | Buyer defines | Supplier evidence |
|---|---|---|
| Phenomena | Need for dips, interruption, swell, harmonics, imbalance | Standard edition, method class, output fields |
| Installation | Diagram, board, voltage, CT/PT, outage date | Wiring, protection, installation and test method |
| Recording | Event, waveform, pre/post duration, retention, clock | Memory, sample export, behavior under gaps |
| Integration | Equipment ID, alarms, MES/SCADA, access | Interface, rights, buffering and replay test |
| Acceptance | FAT/SAT phenomena, result rule, owner | Cases, calibration, result and correction log |
Do not score an offer by “IEC compliant” alone. Confirm whether IEC 61000-4-30:2025 Class A or S applies to the specified parameters, the system conditions including transducers, and configuration versions. Select the method needed for the comparison or contractual purpose. For initial stop investigation, test whether waveform, time and meter placement answer the question before choosing the highest class everywhere. A measurement method and a plant-specific supply-quality or equipment-immunity requirement are different documents.
Split cost into meters, transformers and sensors, board changes, protection, wiring, communication, storage, analysis, calibration, installation and shutdown work, FAT/SAT, training and support. If reusing a meter, verify that its actual firmware and settings save and export the required event and waveform; a “harmonics” display is insufficient. A short portable survey before permanent metering can be an option when stops are concentrated. State communication capacity and licenses for future measurement points.
Set thresholds from equipment and investigation goals, not a standard name
The same dip can affect machines differently because of power architecture, load and control-supply hold-up. Adopting an IEC measurement method does not set one trip limit for every machine. Examine historical events and logs, then assess how many events an initial threshold catches or misses before changing it. Keep the configuration version, reason, approver and before/after comparison. Fewer alarms after raising a threshold do not prove improved supply quality.
For harmonics, align voltage versus current, location, operating mode, load and aggregation period. If the plant has an impact, relate readings to heat, faults, protection trips or product defects. A filter selected solely to improve one number will not resolve a stop caused elsewhere. Require a proposed remedy to state the phenomenon-impact relationship and a comparable measurement before and after.
Use FAT to test simulated events and SAT to prove real wiring
At FAT, combine meter and software, using simulated instrument inputs or documented test data for the in-scope dips, interruptions, harmonics and imbalance. Attach event start/end, phase, key values, time, storage, export, alarm, network-loss and recovery results to test IDs. IEC 62586-2 concerns instrument functional tests and uncertainty; it does not mean a plant FAT must repeat every test in that standard. Keep supplier conformity evidence separate from the acceptance tests required for this installation.
At SAT, match CT/PT ratios, polarity, phase sequence, wiring, meter topology labels and clocks against drawings. Agree safe tests with electrical staff; use appropriate secondary injection or known operating changes to prove recording where possible. Do not create a real outage or fault casually. Set test-set scope, equipment protection, work permits and production impact first. Verify voltage/current orientation at each point and replay of records after a communications outage without duplicates.
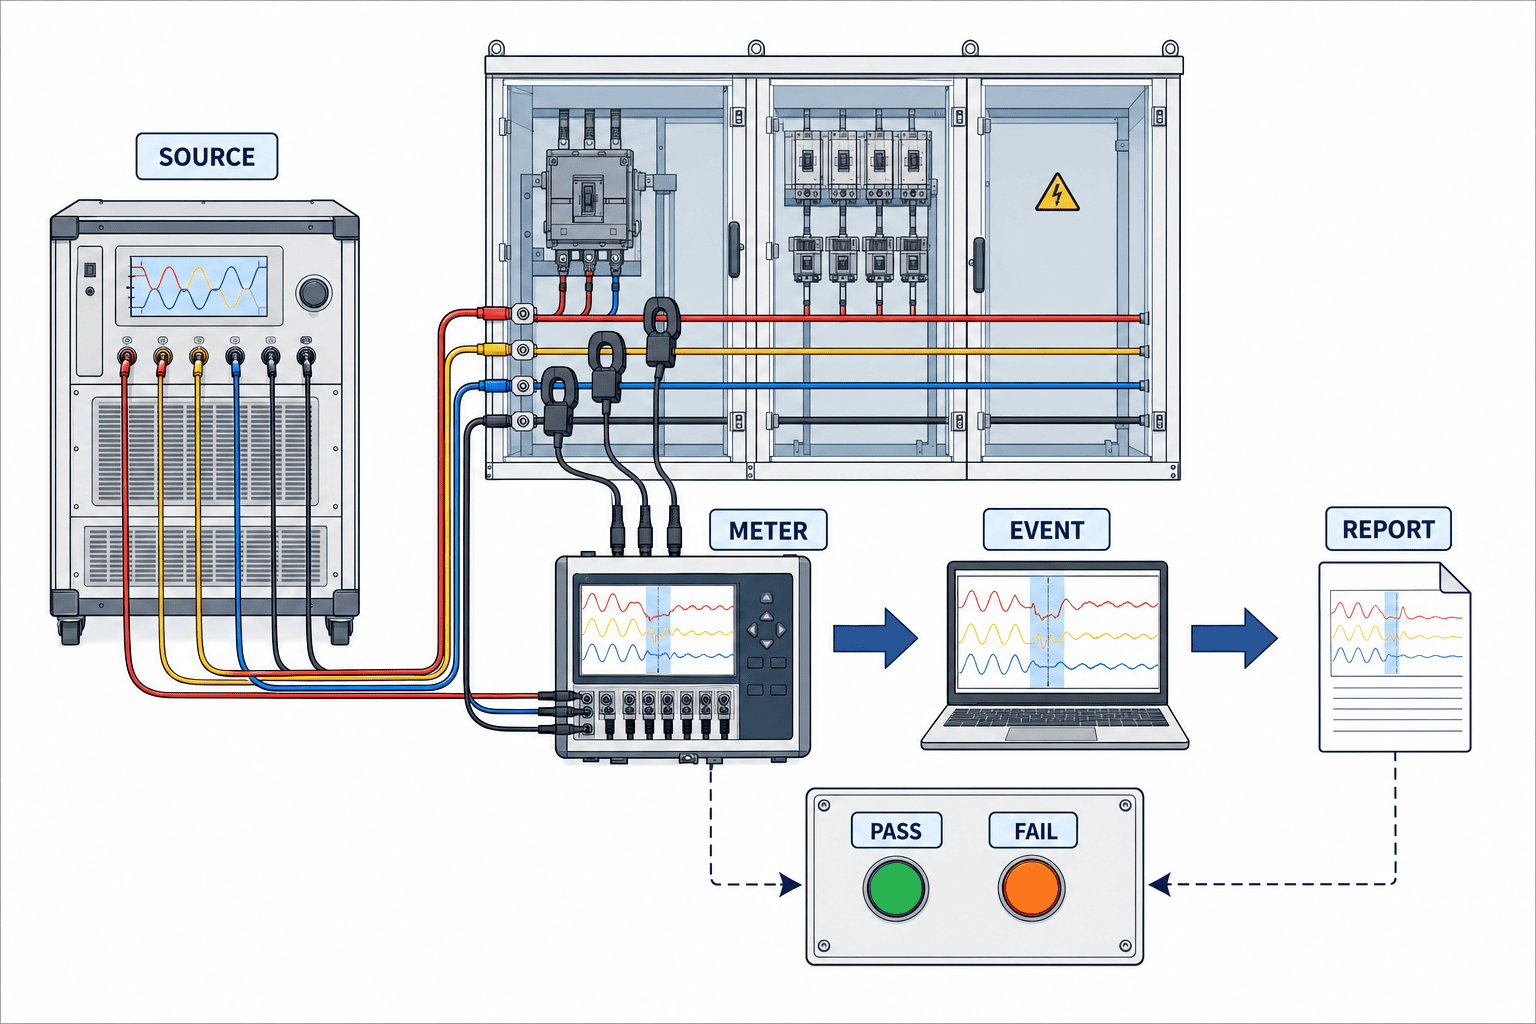
An event on a FAT screen does not meet the objective if SAT cannot link it to the right machine and feeder. Walk the equipment-to-meter mapping physically and display a sample PLC alarm on the same timeline. Deliberately test clock errors, missing values, missing waveforms, overwritten files and crossed phases. Assign which acceptance outcome is guaranteed by the meter versus the plant’s electrical work, network and MES configuration. For open issues, state owner, deadline, workaround and retest instead of calling a nonfunctional investigation path “provisionally accepted.”
Make acceptance results reproducible
Each case should list meter ID, channel, wiring-drawing revision, CT/PT ratios, test set and calibration, applied event, threshold, expected record, actual result, evidence file and reviewer. For a dip, note the phase varied, start/end and whether the event and waveform identify the same phase. For a harmonic test, compare the applied component with display and export, accounting for aggregation and method. This article cannot prescribe an arbitrary error tolerance: decide using the selected standard class, calibration evidence, supplier conformity data and contract.
For communications testing, create an event, disconnect the network, confirm local retention, and check duplicate-free delivery after recovery. Test alarm on clock-sync failure and correction after resynchronization. Back up waveforms before a software or configuration change and retain its history. A usable test document can later support periodic maintenance and fault recovery.
Coordinate site work permits among electricians, production planning and equipment owners. If testing stops a line, plan work in process, restart and any quality reassessment. Do not force unsafe phenomena on live power because a test cannot be simulated; distinguish what supplier FAT proved from what can be verified on site. Record untested effects and alternative checks rather than signing an unperformed test as complete.
In operation, treat an event as the start of a diagnosis
After launch, review whether alarms coincide with stops and whether repeated events have caused no visible stop. If a sag precedes one machine stop but peers on the same feeder continue, control-supply hold-up or equipment logic may differ. If no electrical event is recorded, verify meter and data health and investigate non-electrical failure modes. Both outcomes are useful. Do not equate time correlation with causation; revise conclusions using waveforms, drive codes, PLC logs and maintenance inspection.
Regularly check meter clocks, inputs, CT/PT settings, memory, communications, calibration dates and diagram revisions. Update equipment-to-meter mappings after board modifications or machine moves. Review recurring events, process impact, post-remedy confirmation and unresolved cases with electrical maintenance, production, equipment maintenance, IT/OT and quality as needed. For a discussion with the electricity supplier, organize the contractual measurement point, timestamps, method and evidence from multiple locations.
Do not calculate ROI on the assumption that monitoring alone eliminates stops. It may shorten diagnosis first; stops may fall only after wiring or equipment changes. Separate current stop counts, investigation labor, scrap and recovery time, then distinguish benefits delivered by measurement from those requiring a remedy. There is no universal payback or reduction rate; use the plant’s records and test results.
Summary: keep waveforms and read them beside equipment stops
Select incoming, feeder and equipment measurement points from a defined question. Specify the appropriate IEC method, keep events and waveforms separately from averages, and connect them to PLC and drive logs. Define evidence in the RFP, test instrument and software behavior at FAT, then verify actual wiring and equipment mapping at SAT. This turns terms such as “sag” and “harmonics” into evidence for a fault investigation.
At the stage of reviewing existing boards or drafting an RFP from stop history for a Thailand plant, you can discuss the single-line diagram and target equipment with TOMAS TECH. Share timestamps, machine alarms and diagrams to the extent your organization allows.
Frequently asked questions
Will an existing energy monitoring system identify voltage sags?
It depends on the product and configuration. Minute energy or average-voltage data may miss short events. Confirm event capture, affected phase, depth and duration and, if needed, accessible pre/post waveforms.
Does a high harmonic THD mean a filter should be installed immediately?
No. Check whether it is voltage or current THD, load, location, operating mode and actual impact. A current THD ratio alone does not determine a cause or solution. Define a comparable post-change test first.
What is the difference between IEC 61000-4-30 Class A and Class S?
The standard defines two classes of measurement methods. Choose for the parameters, comparability and survey or contractual purpose. A “Class A” label alone does not guarantee performance of installed transducers, wiring and data path.
Is adding CTs enough for power quality monitoring?
CTs measure current. Voltage-dip and voltage-waveform investigation also need appropriate protected voltage inputs and wiring. Plan existing-board modification, safety and isolation with qualified electrical staff.
What belongs in FAT and SAT?
FAT uses simulated inputs to test detection, storage, export and communications recovery in the instrument/software. SAT verifies local wiring, CT/PT ratio, phases, clocks, equipment mapping and the actual record path.
Does a sag just before a machine stop prove the cause?
No. Compare depth, duration, multiple measurement points, fault code, peer equipment and clock health. Select a remedy after electrical and equipment evidence agrees.
Sources
- IEC 61000-4-30:2025, Power quality measurement methods: https://webstore.iec.ch/en/publication/71611
- IEC 61000-2-4:2024, Industrial compatibility levels: https://webstore.iec.ch/en/publication/98734
- IEC 61000-4-7:2002+AMD1:2008, Harmonics and interharmonics: https://webstore.iec.ch/en/publication/4228
- IEC 62586-2:2017+AMD1:2021, Functional tests and uncertainty: https://webstore.iec.ch/en/publication/71255
- Schneider Electric, PM8000 waveform recording: https://product-help.schneider-electric.com/PowerLogic-PM8000/en-us/content/11-logging/waveform-recording-overview.htm
- Schneider Electric, ION9000 power quality configuration: https://product-help.schneider-electric.com/PowerLogic-ION9000/en-us/content/09-pq/power-quality-configuration.htm
- HIOKI, PQ3198: https://www.hioki.com/global/products/pqa/power-quality/id_6735
- Fluke, 1770 Series: https://www.fluke.com/en/product/electrical-testing/power-quality/1773-1775-1777
- NIST SP 800-82 Rev.3: https://csrc.nist.gov/pubs/sp/800/82/r3/final
Standards, instrument specifications and contracts change. Verify current editions and scope before procurement. This guide does not guarantee a plant’s supply quality, equipment immunity, legal compliance or return on investment.


