


If a Thai factory wants AI to reduce compressor electricity use, the first question is not model accuracy. It is how demand and pressure change across the plant, which compressor carries base load, and which absorbs variation. An AI compressor operating optimization project should be designed as an investment in measurement, coordinated sequencing, storage, demand-side correction and, only then, the incremental value of prediction. This guide helps plant engineers write an RFP for a central controller and verify performance and safety through FAT and SAT.
Why examine multi-compressor operation before buying AI?
Compressed air passes through compressors, dryers, filters, receivers, distribution piping and end-use equipment. A constant discharge pressure is insufficient if a critical user loses pressure. Yet raising the whole system’s setpoint to compensate for one remote loss can increase unnecessary demand. The US Department of Energy’s control strategies tip sheet recommends studying supply and demand together and preparing pressure and demand profiles before investing in controls. Although the document is older, its engineering points about coordination, storage and varying load remain useful.
When three machines each respond only to their own pressure sensor, two can load together on the same pressure drop and unload together as pressure rises. Another machine may consume power at part load while a dashboard reports only the number of machines running. DOE identifies conflicting operation, short cycling and blow-off as symptoms of poor coordination. Compare input kW, actual flow, loaded and unloaded time, pressure limits and starts on a common timeline, not just the count of stopped compressors.
This article focuses on how multiple machines are dispatched. Our guides to compressed-air leak detection and dew-point monitoring address separate issues. Leaks and air quality still matter, but record their effects separately from savings attributed to sequencing.
Measure the baseline before comparison
Start with a single-line diagram. Record each compressor’s rated flow, control type, age, operating range, communication interface, emergency stop and backup arrangement. Add receiver capacity, pressure loss across dryers and filters, pressure at the header and remote users, and each critical process’s minimum pressure. Consistent equipment and sensor identifiers keep later trends traceable.
Log ordinary production, changeovers, cleaning, breaks, night shifts, weekends and startup. There is no universally correct number of days: the period must cover a complete demand cycle. Daytime-only data can misstate the available benefit if night demand is low. In Thailand, season, product mix, holiday shifts and drying conditions may change the pattern; document whether the sample is representative.
At minimum collect each machine’s real input kW and load state, header pressure, critical remote pressure, total flow and receiver pressure with synchronized timestamps. Add production line, product, shift and good output where possible, so air or energy per unit of production can be compared. Do not infer air flow from kW alone when no flow meter is installed; otherwise supply and demand causes cannot be separated. The DOE compressed-air sourcebook emphasizes pressure and demand profiles and time-series logging.
The meters themselves need a specification. State whether the power boundary includes auxiliaries. For flow meters, record actual versus normalized flow, range, installation straight lengths and calibration date. Compare pressure instruments in the same units and reference condition. A several-minute log interval cannot resolve a pressure dip lasting seconds, so retain high-resolution control data as well as monthly KPI data. Missing samples, communication outages and unsynchronized clocks can invalidate acceptance before they affect any AI model.
Avoid savings that only reflect a lower production day
Total kWh falls easily when holidays, outages or low-output days enter the after-period. Compare equivalent operating conditions or adjust for output, product mix, shift hours and baseline pressure. If leaks were repaired simultaneously, do not assign the full saving to AI. The same applies to compressor replacement, pipe modification or dryer replacement. A declared measurement boundary prevents inflated ROI.
The foundation of compressor sequencing AI: base and trim
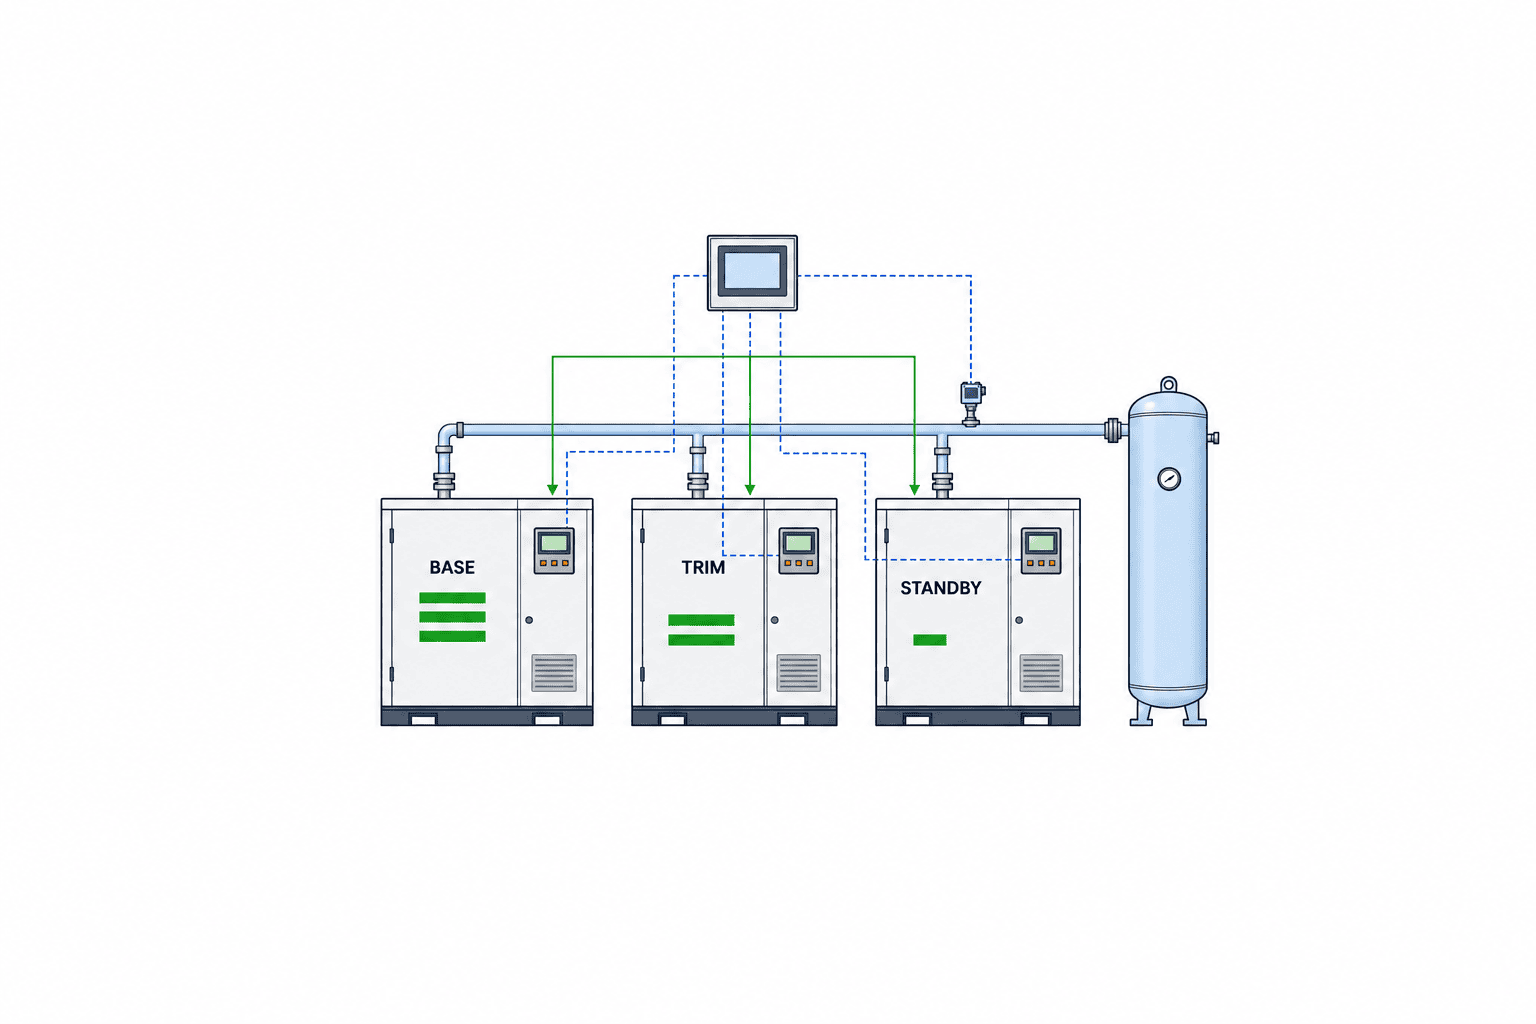
The usual multi-machine pattern is to let efficient machines carry stable base flow while one trim machine tracks the remaining variation. DOE describes coordinated systems that place an appropriate number of machines at full load with one machine trimming. This is an engineering pattern, not a universal fixed rule. Centrifugal surge limits, minimum variable-speed capacity, part-load efficiency and standby requirements all affect the combination.
Making the largest compressor the permanent base can be inefficient if it unloads frequently at low demand while a variable-speed machine sits near its minimum speed. Conversely, stopping a large efficient unit to run two smaller ones may be worse. Compare measured kW and delivered flow at actual operating points, rather than only nameplate values. For mixed manufacturers, verify exactly how load, unload and stop commands reach each local controller.
Dispatch priority should be a table conditioned on demand band, efficiency, maintenance restrictions, permitted starts and redundancy, rather than a permanent machine 1–2–3 order. Exclude a machine awaiting repair until an operator approves its return; reserve a standby machine where production requires it. Equalizing hours may simplify service, but can increase energy use if it forces an inefficient unit to run. Make the weighting between energy and maintenance visible.
The DOE Better Plants PLENCO case describes a fixed-speed base compressor and variable-speed trim compressor. It illustrates a real design choice, not a guaranteed configuration or saving for another factory. Ask bidders for comparisons based on your flow bands and efficiency curves.
Design the pressure band and storage together
Central control often promises a narrower pressure band and avoidance of unnecessary high pressure. Lowering header pressure is not an improvement if remote processes fall below their minimum. Determine the process requirement first, then account for pressure drops through dryers, filters, piping and local regulators. Only then define the lowest suitable supply pressure. Where one process needs a much higher pressure, a separate circuit or local booster may be better than raising the whole network.
The DOE sourcebook gives a rule of thumb for systems near 100 psig: a 2 psi increase in discharge pressure raises full-output energy use by about 1%. Unregulated users and leaks may add further demand. This is a condition-dependent guide, not a promised saving for a Thai plant. The proposal must specify not only the proposed pressure reduction, but the fraction of time remote minimum pressure is maintained, peak pressure drops and any production stops or defects.
A receiver buffers short demand peaks. Where storage is insufficient, a new compressor may not start fast enough after the sensor detects a pressure dip. More storage does not automatically save energy: receiver volume, usable pressure band, pressure/flow controller location, dryer position and piping loss must be designed together. DOE explains how controlled storage can absorb transients while the demand side receives the lowest stable pressure.
A DOE Better Plants case study reports a staged project combining controls, primary storage, demand correction, machine replacement and metering. Across those measures, the plant lowered pressure by 22 psig and compressed-air energy costs by 11%. That is one plant’s combined result. It cannot be reported as “11% from AI” or attributed to storage alone.

What demand prediction adds, and where AI stops
Conventional central control sequences machines according to pressure bands, priorities, schedules and equipment status. That alone can fix poor coordination. Prediction can add value when demand changes repeat often enough to be learned and advance action reduces pressure excursions or wasted standby power. Batch changeovers, timed blow-off steps or simultaneous line startups may justify preparing storage or starting capacity shortly before a predictable peak.
Inputs may include past flow, pressure and kW, production schedules, shift and day, batch information and machine availability. “AI” on a brochure does not describe the function. Does it predict five-minute flow or pressure-excursion risk? How often is the forecast renewed, how far ahead does it act, and how is uncertainty displayed? What happens when error rises? Are minimum remote pressure and machine-start limits hard constraints? Put these questions in the specification.
Atlas Copco’s central-control page distinguishes coordinated control, pressure and running-hour functions, and an AI-driven optimization add-on. A manufacturer describing an add-on is not proof that every plant needs it. Compare rule-based and AI-enabled operation within the same measurement boundary, then test whether the incremental saving justifies the incremental cost.
Prediction has limits. Changing leaks, saturated flow meters, production schedules that diverge from reality, clock drift and frequent changes in machine condition produce unstable training data. Historical data cannot reliably foresee every irregular event. On power recovery, communication failure or abnormal pressure, safe local manufacturer-defined control must take over. AI must not override machine protection.
An advertised “90% prediction accuracy” does not by itself mean lower energy or reliable air supply. A model may miss one major peak and still have a high average score. Measure minimum pressure during peaks, excursion duration, switching frequency, input energy and maintenance burden. Examine forecast errors by process and shift, and record why outlier days occurred.
A transparent hypothetical calculation
The following values are illustrative assumptions, not an industry saving rate or product performance claim. Suppose the compressor group averages 300 kW in the baseline, operates 6,000 comparable hours per year, and measured control changes reduce mean input by 12 kW. The energy difference is 12 kW × 6,000 h = 72,000 kWh/year. At an assumed energy rate of 4.0 THB/kWh, the energy-charge difference is 72,000 × 4.0 = 288,000 THB/year. This excludes fixed charges, demand charges, power factor, tax, maintenance and capital expenditure. Replace the tariff with the plant’s actual contract and bills.
Assume initial equipment, meters, installation and commissioning cost 900,000 THB, with annual maintenance of 60,000 THB. Annual net benefit is 288,000 − 60,000 = 228,000 THB; simple payback is 900,000 ÷ 228,000 = 3.95 years. If the measured mean difference is only 6 kW, the energy difference is 36,000 kWh/year, the energy charge difference 144,000 THB/year, net benefit 84,000 THB/year and simple payback about 10.71 years. A proposal that states “AI saves 10%” without sensitivity is difficult to compare.
Accepting a 12 kW difference requires comparable production volume, product mix, shifts, leak repairs, supply pressure and air quality before and after. If safe, alternate rule-based and AI control in comparable periods. If switching is unsafe, agree in advance on statistical adjustment and uncertainty. Never use an unmeasured “up to X%” as the numerator of ROI. DOE MEASUR includes tools for compressed-air baselines and improvement scenarios; its modeled result must remain separate from site acceptance measurements.
How to write an RFP for a central compressor controller
“AI included” is not a sufficient scope. Supply the equipment list, piping and instrumentation diagram, trends, minimum pressure and air-quality requirements, permitted operating windows and interface boundaries to PLC or SCADA. If the data does not exist, request a separately priced measurement phase. Divide scope into baseline study, coordinated sequencing, sensors and communication, predictive AI, commissioning and training, and support. This exposes the incremental cost and benefit of AI.
Specify control for fixed-speed, variable-speed and centrifugal machines; who guarantees cross-brand compatibility; start/stop limits; minimum loaded and unloaded time; pressure band; authority to change priorities; and how remote pressure affects decisions. For the model, require the prediction target, training and retraining conditions, approval of updates, data ownership, cloud requirements, offline behavior and retention. When external plant-network access is restricted, ask for a comparable edge-only option.
Safety requirements should say that local protection remains final, air supply continues on communication loss, manual takeover works, emergency stops take priority and standby units start under defined conditions. AI must never bypass protective devices. The operator screen should explain why a machine was selected, current constraints, excluded units and the next switching condition. Include remote-service access and configuration-change logs in acceptance.
Compare bidders on upfront and recurring cost, instrumentation, warranty boundary, downtime, estimated kWh under identical assumptions, excursion definition, FAT/SAT effort, training and maintenance. Give every bidder the same baseline, operating hours, measurement boundary and tariff. A single chart of projected savings cannot establish comparable offers.
What FAT and SAT should prove
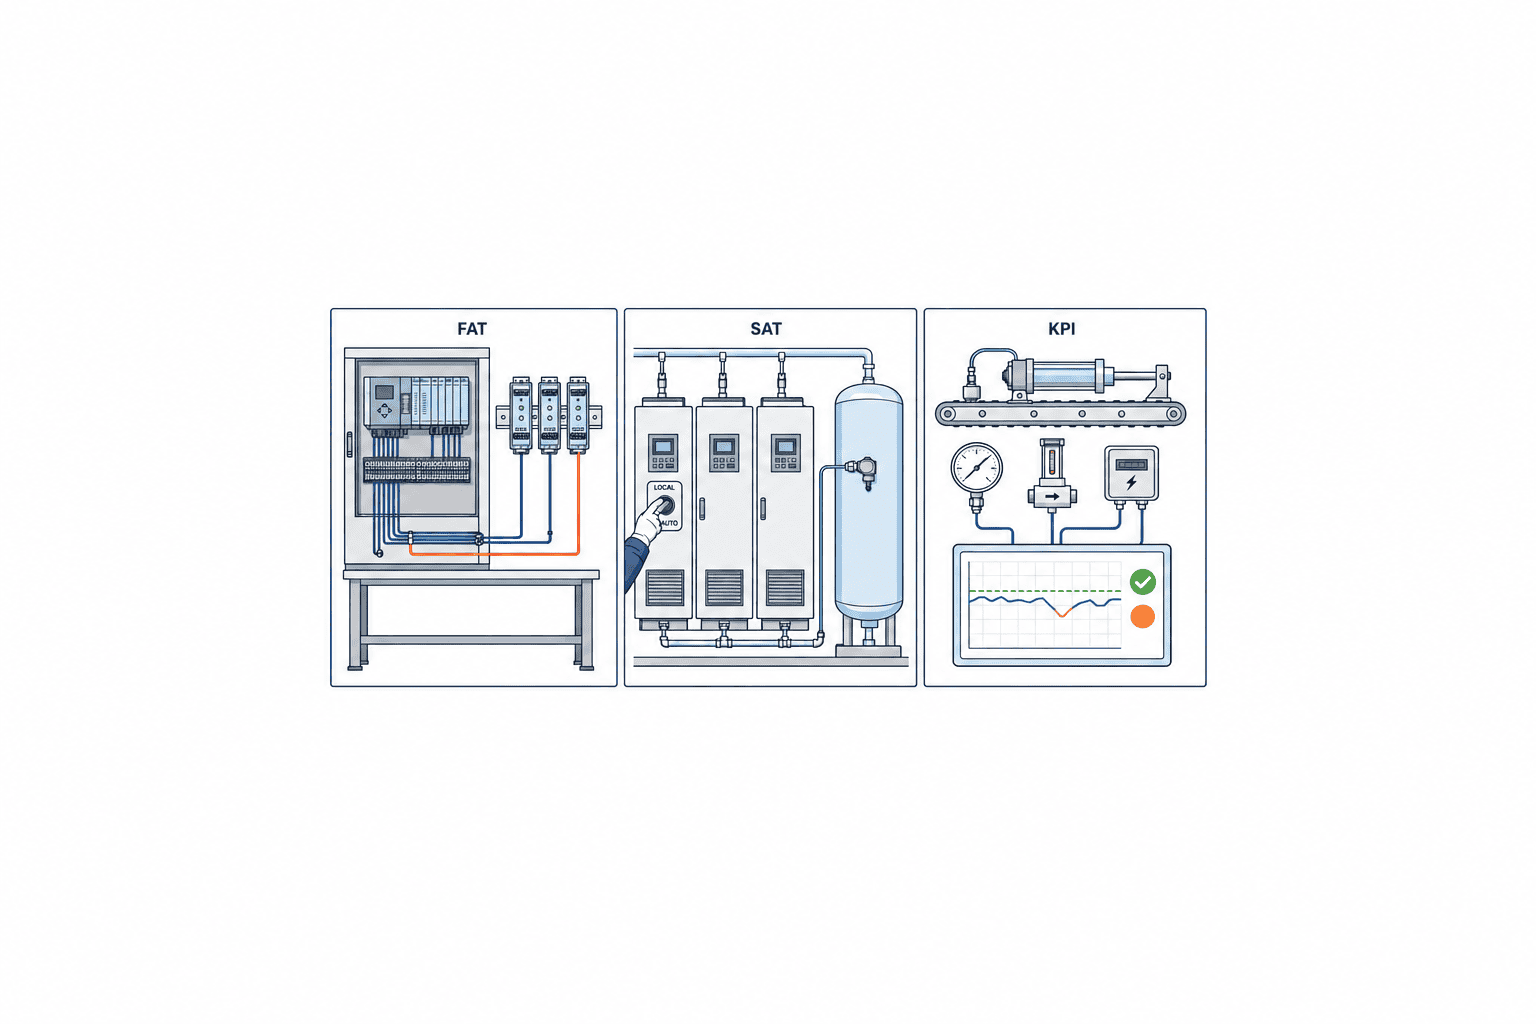
Factory acceptance testing (FAT) checks signals, logic and failures before site connection. Simulate pressure drops, demand peaks, one compressor failing, communication loss, a stuck sensor, power recovery and manual intervention using representative signals for the PLC, central controller and local machines. Record stimulus, expected state, actual command, alarm and timestamp. FAT cannot establish real energy saving, but it can show that constraints are respected.
Site acceptance testing (SAT) checks wiring, communication, sensor location and control on the real plant. Stabilize local control first, run the central controller in observe-only mode, then transfer authority in steps. Check remote minimum pressure, timely backup starts and absence of excessive short cycling with production representatives. If a day cannot cover every demand pattern, separate SAT’s safety and supply acceptance from a longer energy-performance guarantee covering representative shifts and production conditions.
Set numerical pass criteria before testing: for example, critical remote pressure never below its contracted minimum, switching within manufacturer limits, automatic return to local control on communication failure, and complete kW/pressure/flow logs. The actual pressure limits and permissible durations must come from the plant and equipment design, not this article’s hypothetical figures. Include input kWh, kWh per air volume, kWh per good product and pressure-excursion time in performance review. This reveals settings that save power by sacrificing supply.
After acceptance, govern parameter changes. New lines, tools, leak repairs, receivers and dryers alter the best sequence and pressure band. Use change requests, approval, backed-up settings and before/after log comparison. Revalidate the prediction model periodically; installation does not make a system permanently optimal.
Implementation order and responsibilities in Thailand
Changing everything at once hides which measure worked. First establish measurement and baseline, and inspect leaks, excessive pressure, pressure loss and inappropriate demand. Second coordinate machines and pressure, improving storage or piping where needed. Third test the value of prediction against the remaining variation. Preserve safety and quality requirements throughout, and record each stage separately.
Put management, production, maintenance, energy, IT/OT and the equipment maker on one responsibility matrix. Production defines end-use pressure and tolerated interruption. Maintenance manages machine limits and condition. Energy staff own measurement boundaries and cost calculations. IT/OT staff own communication, time synchronization, accounts and change history. Equipment makers confirm warranties and safety circuits. Prepare operator screens, alarm instructions, SAT records and training in languages the local teams can use.
Consult primary information from Thailand’s Department of Alternative Energy Development and Efficiency (DEDE) for energy-efficiency programs. This page is not evidence that a particular project is currently eligible or that any subsidy amount is guaranteed. Recheck current rules before including assistance in an investment case.
Attach a measurement specification to the RFP
Before asking for a control proposal, specify not merely where a meter will be installed but which decision its signal supports. A compressor power reading differs depending on whether the boundary covers only the motor or includes cooling fans and the dryer. Decide whether total flow is summed from each compressor outlet or measured at the common treated-air header, and state in a data dictionary whether flow is actual or normalized to reference conditions. Header pressure in the compressor room cannot establish a supply guarantee at a remote user, so install pressure measurement ahead of pressure-sensitive processes. If selecting multiple remote points, distinguish the normally lowest-pressure point from a location vulnerable to a brief high-flow event.
Define the meaning and update interval of PLC signals for loaded, unloaded, stopped, faulted, manual and automatic states. A single “running” tag cannot quantify unloaded time when a machine consumes electricity but produces no air. Verify that similarly named signals are not inverted on different machines by checking local indicators. Use one time source for the controller, gateway and historian, and flag data captured before synchronization returns after a power outage. Link production codes used for matching to manufacturing orders or line master data, rather than editable free-text labels.
Filling data gaps silently and including them in a savings calculation can invalidate acceptance. The RFP should distinguish permitted missing-data rate, conditions under which control may continue, and conditions that exclude samples from performance analysis. For example, a period with a failed power meter might still show that pressure protection worked, but should be excluded from energy-savings calculations. If the critical remote pressure sensor fails, energy-saving control should revert to a safe default. State who calibrates each signal and how tag mapping is rechecked after a sensor is replaced.
Separate predictive dispatch from machine protection
Design AI’s preferred operating plan separately from protections that must always hold. The supervisory layer may forecast demand and propose which machine will be base and which trim in the next period. The protection layer enforces manufacturer minimum off-time, start limits, oil temperature, minimum remote pressure, receiver pressure limits and exclusion of machines under maintenance. A cheaper proposed combination is rejected whenever it violates these constraints. A learning model must not be allowed to rewrite protective settings automatically.
Switching needs hysteresis. If pressure moves back and forth across a single threshold and repeatedly starts and stops a machine, electrical contactors and motors wear and energy use may rise. Use distinct start and stop pressure thresholds together with minimum run time, minimum off-time and a requirement that demand persists. Determine the values from machine specifications and the plant’s permissible pressure range, rather than accepting vendor defaults without review. If a trim machine stays at its lower operating limit, use the duration of that condition when considering a change in base machine. A short break or local pipe-pressure wave should not trigger a change.
Predictive pre-start must also be conditional. If an expected peak does not occur, an additional compressor may waste energy while unloaded. Revert to conventional pressure-based control when forecast confidence is low, the production plan changes at short notice or sensors have missing data. A pre-start decision should consider startup time, usable stored air and current remote pressure together. Log the forecast, constraints, executed command, rejected command and reason as one event so an engineer can explain later why a machine started.
Prepare fault response both on screen and on paper
Communication failures have different scopes. Loss of the link to one compressor, failure of the central controller, missing power-meter data and an implausible remote-pressure reading leave different functions available. List each fault mode in the RFP with detection method, allowed detection time, alarm recipient, takeover control mode and the physical switch operators must use. If only the AI cloud connection fails, a local rule-based controller should be able to continue supplying air.
Define recovery before an outage occurs. If the central controller immediately selects all machines when communication returns, it might send an unexpected command to a unit being operated manually. On recovery, reread machine states and pressure, verify setpoints and require the responsible operator to approve transfer of command authority. After a power outage, prioritize the equipment manufacturer’s restart sequence to avoid simultaneous electrical inrush and sudden pressure change. Exact restart delays belong in site-specific engineering, not in an article’s generic values.
Give maintenance a one-page procedure containing alarm-screen name, equipment number, how to return to manual mode, remote pressure to confirm, contacts and a checklist before returning to automatic operation. Keep a printed copy in the compressor room because an on-screen guide may be unavailable when the controller fails. Rehearse central-controller outage, remote-pressure-sensor failure and loss of one compressor with local operators. Retain the exercise record as SAT evidence.
Keep acceptance evidence separate from the savings guarantee
FAT and SAT records should contain more than tick boxes. For each test, retain conditions, simulated input, expected outcome, actual command, pressure trend, responsible person, timestamp and open items. Assign each open item an owner and due date, and link retest evidence to its original record. Archive the accepted software release, PLC program, AI-model version and each machine’s parameters. Otherwise no one can identify the configuration that passed acceptance after a later change.
Maintain a separate energy-guarantee register for the baseline period, excluded days, operating conditions, product mix, tariff basis, treatment of missing data and calculation method. A project can pass pressure tests while energy savings remain unproven; it can also reduce electricity while failing critical remote pressure. Do not compress those outcomes into one pass/fail box. If leaks are repaired after improvement, split the timeline at that event rather than mixing leak-repair benefits with AI benefits. When measured results differ from the original prediction, retain the forecast and document whether equipment efficiency, air demand, set pressure or operating hours differed. Use those findings for the next controlled adjustment.
Frequently asked questions
How many compressors justify AI sequencing?
Machine count alone does not decide it. One compressor needs no multi-machine sequence. Two machines that repeatedly load and unload together may justify central control. Three or more machines with steady demand and effective existing coordination may gain little from AI. Decide using time-series measurements and like-for-like comparison.
What percentage can compressed-air energy AI save?
There is no universal figure. Efficiency curves, leaks, storage, pressure band, demand variation and existing controls determine the result. DOE’s case studies describe particular plants and combined measures. Measure the difference from baseline to conventional central control separately from the incremental AI difference.
What should we compare first when selecting central control?
Start with machine protection, interface compatibility, minimum remote pressure and load sharing. Then compare meters and logs, support, cost and prediction features. Our factory power monitoring guide explains how to choose measurement points.
Are FAT and SAT just tests of AI-model accuracy?
No. FAT first validates signals and logic under normal and abnormal conditions. SAT first validates safe transfer and reliable supply on site. Test forecast accuracy and energy KPIs over a separate period with representative operation. Keep safety acceptance and investment-performance acceptance distinct.
Conclusion: buy the measured increment over rule-based control
An AI compressor optimization project starts by measuring multi-machine operation, then setting base and trim duty, pressure band, storage and demand-side conditions. Compare the additional value of demand prediction against a sound rule-based central controller under the same conditions. Specify data, constraints, interfaces and failure behavior in the RFP. Verify safety and supply in FAT/SAT, then verify power, flow and pressure over a representative period. That process turns a vague “AI effect” into evidence fit for an investment decision.
Even if multi-machine logs are incomplete, you can begin by defining measurement points, an RFP and FAT/SAT acceptance criteria. Contact TOMAS TECH with your equipment layout and the shifts or demand events causing concern.
Sources and interpretation of numbers
- DOE, Compressed Air System Control Strategies: demand profiles, coordination, base and trim, storage and pressure control. An older technical document, not a statement of current regulation.
- DOE, Improving Compressed Air System Performance: measurement points, pressure and demand profiles, and a pressure/energy rule of thumb near 100 psig.
- DOE, MEASUR: tools for baseline and improvement-scenario analysis.
- DOE Better Plants, PLENCO system upgrade: fixed-speed base and variable-speed trim example.
- DOE Better Plants, compressed-air project case: 22 psig pressure reduction and 11% energy-cost reduction from combined measures, not AI alone.
- Atlas Copco, compressor control systems: vendor description of central control and an AI optimization add-on, not a plant-wide guarantee.
- Thailand DEDE: Thai energy-efficiency information; verify program terms when applying.
The 300 kW, 6,000 h, 12 kW, 4.0 THB/kWh, 900,000 THB and 60,000 THB values above are teaching assumptions, not measurements, tariffs or quotations from an actual plant.


