


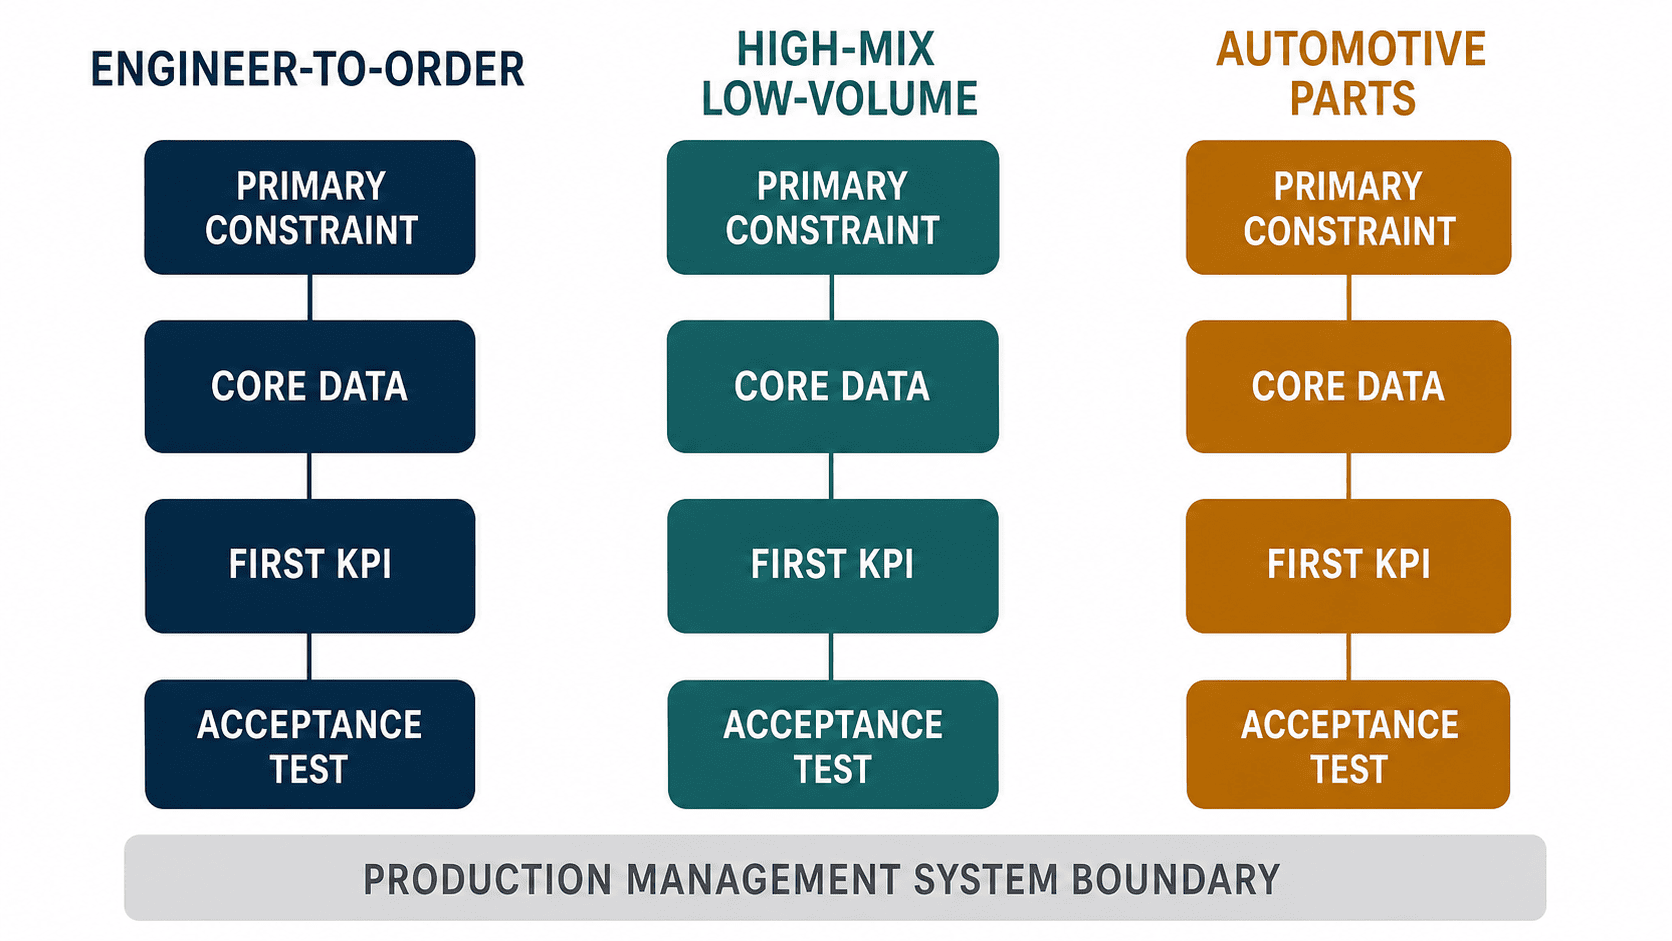
When comparing production management system implementation cases, the industry name and software brand are not enough to show whether the result can be reproduced at your factory. Production model, constraints, scope, data ownership, KPI formulas, and acceptance conditions matter far more. This guide gives factory leaders in Thailand and ASEAN three implementation patterns—engineer-to-order, high-mix low-volume, and automotive parts—to turn case studies into an RFP or a controlled proof of concept. The three patterns are design examples, not claims about named TOMAS TECH customers.
How to read production management system implementation cases
Two automotive suppliers may need entirely different systems. A plant repeatedly making stable, high-volume parts has different scheduling, changeover, lot, and quality requirements from a plant supplying many low-volume service parts. The same applies to food: a formula-and-expiry process and a packaging line dominated by downtime do not need the same first data set.
Before comparing products, normalize each case across six dimensions.
| Dimension | What to identify | Question that prevents a false comparison |
|---|---|---|
| Production model | Make-to-stock, make-to-order, engineer-to-order, repetitive, continuous | Does the case have similar demand variability and product mix? |
| Binding constraint | Capacity, tooling, labor, material, quality, lead time | What resource actually limits the plan? |
| Process scope | Sales, purchasing, inventory, planning, production, quality, costing | Within which boundary was the KPI measured? |
| Data sources | ERP, MES, PLC, spreadsheets, paper, inspection systems | Which system owns each record and who maintains it? |
| KPIs | Delivery, WIP, schedule adherence, yield, downtime, cost | Were baseline and formula fixed before implementation? |
| Acceptance | FAT, SAT, UAT, migration, training, stabilization | What evidence allowed the team to approve go-live? |
For product-selection context, see our production management system comparison for Thailand. If standard functions do not fit the plant’s differentiating process, the custom production management system development guide explains the extra decisions involved.
The 2026 operating environment: move from a pilot to routine use
The need for digital transformation is widely recognized, but converting collected data into daily decisions remains difficult. Rockwell Automation’s 2026 State of Smart Manufacturing is a vendor-sponsored survey of 1,560 respondents in 17 countries. It reports that 59% were using smart manufacturing technology, 18% were piloting it, and 34% of operations were AI-augmented. Respondents said that 43% of collected data was being used effectively, while 46% had experienced a cyber incident in the previous year. These figures describe that survey population; they are not universal factory benchmarks or guaranteed implementation outcomes. Rockwell Automation, 2026 State of Smart Manufacturing
For Thailand, depa’s summary published in April 2025 reports findings from its 2024 Digital Density Survey. Under the survey’s own definitions, 70% of the sample was classified as “Industry 2.0: Solution,” while 87.33% of production process management was centered on simple automation. This does not diagnose an individual plant. It does suggest that stable links among equipment, work, quality, and inventory data often deserve priority over purchasing advanced analytics first. depa Digital Density Survey summary
In this environment, a successful demonstration is not enough. A production system also needs:
- named business owners for master and transaction data;
- operating procedures for network outages and equipment downtime;
- traceable exceptions, manual corrections, cancellations, and retries;
- OT/IT access control, backups, and change management; and
- supervisors, maintenance, quality, and planning users who can operate it after the pilot team leaves.
Implementation pattern A: production management for engineer-to-order
The following three cases are implementation patterns for requirements planning. They are not proprietary customer achievements. Improvement rates and ROI must be calculated from each company’s validated baseline rather than assumed.
The problem: engineering changes move delivery and cost
In engineer-to-order production, engineering, purchasing, fabrication, assembly, and inspection begin after an order, and the BOM or routing may change while work is in progress. Products with the same commercial name may have different specifications, drawing revisions, customer-supplied parts, and inspection requirements. The first objective is not an ideal schedule. It is a shared answer to four questions: which revision applies, what has been ordered, what is complete, and what cost remains.
The end-to-end boundary can extend from estimated cost and sales order to project BOM, routing, purchasing, receipt, shop-floor reporting, subcontracting, inspection, shipment, and actual cost. A first PoC should normally narrow this scope to the bottleneck—for example, delivery-date response or engineering-change impact.
Functions and data ownership
- Connect the sales order to a project or manufacturing number and version-control drawings, specifications, and BOMs.
- Show the effect of a revision on demand, issued purchase orders, and WIP.
- Identify long-lead items, subcontract operations, and constrained resources across projects.
- Collect operation completion, labor, scrap, rework, and material issues against the project.
- Explain variance among estimate, budget, committed cost, actual cost, and estimate-at-completion.
Engineering can own the released BOM; purchasing owns supplier commitments; production owns operation completion; quality owns inspection disposition. The system administrator should not become the default owner of business meaning.
KPIs and acceptance conditions
Useful candidates include delivery-response lead time, time to assess an engineering change, shortage count for long-lead items, same-day reporting rate, and unexplained project-cost variance. Acceptance scenarios can require users to trace an amended BOM to affected purchase orders and WIP, prevent duplicate reporting against the same operation, and identify unrecorded subcontract or material cost before period close.
Implementation pattern B: high-mix low-volume production management
The problem: changes and changeovers are routine
High-mix low-volume plants combine product variety, setup work, material constraints, skills, and machine capacity. Even after a weekly schedule is issued, urgent orders, absence, late material, or breakdowns can force a same-day revision. A spreadsheet may be easy to edit but often leaves uncertainty about which version is authoritative and whether material allocation and shop instructions changed with it.
The goal is not necessarily “fully automatic scheduling.” It is to separate a frozen zone from an adjustable zone, record human decisions, and quickly show the impact of a change.
Practical flow
- Align demand, inventory, open purchases, and capacity calendars to the same cutoff time.
- Translate the master schedule into detailed dispatching while checking equipment, molds, jigs, and operator skills.
- Replan interruptions with reason codes rather than silently overwriting the old plan.
- Capture start, finish, quantity, and defects through the method suitable for each operation: barcode, terminal, or machine signal.
- Make the current operation, queue time, and next-operation readiness visible for WIP.
Setup time may depend on the previous-to-next product sequence, cleaning, color change, mold replacement, and first-piece approval. Capturing those elements separately can reveal where improvement is possible. If the input burden is excessive, begin with the critical machines and major setup types.
KPIs and acceptance conditions
Candidates include schedule adherence, setup time, emergency insertions, WIP queue time, reporting delay, and downtime caused by missing materials. Each formula needs a fixed denominator. Schedule adherence, for example, can mean the share of instruction lines frozen at the start of the day that finish within an agreed quantity and time tolerance.
UAT should include material shortages, breakdowns, split lots, rework, WIP transfer, and cancellation—not only a perfect normal order. A system that supports only the happy path will fail in a variable factory.
Implementation pattern C: automotive parts production management
The problem: keep lot, quality, and shipment connected
Automotive-parts operations may need to trace customer requirements, part revisions, material lots, process parameters, inspection results, containers, and shipping labels. The required granularity depends on the product, customer, contract, and process. “Traceability” should not become an unlimited request to retain every signal forever.
Start by identifying which events support quality decisions and shipment release. Define the links among receiving lot, material issue, operation, machine or mold, crew, inspection, hold/release, packing, and shipment. Include target search time and retention rules.
ERP, MES, and equipment boundaries
The official ISA-95 overview provides common language for the boundary between Level 4 business planning and logistics and Level 3 manufacturing operations management. Its parts address information models, activity models, transactions, and exchange profiles. It is a useful discussion framework, but this article does not claim that any proposed configuration or vendor is ISA-95 compliant. ISA-95 official overview
One practical arrangement is for ERP to own sales orders, purchases, financially valued inventory, costing, shipment, and invoicing; MES/MOM to manage detailed dispatching, work reporting, WIP, quality, and genealogy; and PLCs or machines to generate cycles and measurements. Existing capabilities differ by plant. Before removing duplicate entry, align identifiers for item, lot, asset, operation, timestamp, and unit of measure.
KPIs and acceptance conditions
Candidates include lot-genealogy search time, shipment-hold escapes, inspection-link completeness, missing machine records, plan versus actual, and first-pass yield. Acceptance tests can require backward tracing from a shipped lot to inputs and inspection evidence, blocking shipment while quality status is on hold, preventing duplicate records after an interface retry, and detecting clock drift.
Comparing the three implementation patterns
| Area | Engineer-to-order | High-mix low-volume | Automotive parts |
|---|---|---|---|
| First focus | Project, BOM revision, delivery, cost | Detailed schedule, setup, WIP, reporting | Lot, quality, shipment release, equipment |
| Main variation | Engineering and specification changes | Demand, sequence, and resource changes | Revision, quality disposition, customer requirements |
| Candidate system of record | Released BOM, project, commitment, actual | Schedule version, inventory, capacity, actual | Item, lot, quality status, shipment |
| Narrow PoC example | One product family and change impact | One line and major setups | End-to-end genealogy for one part family |
| Critical exceptions | Excess orders after change, unrecorded cost | Rush orders, shortage, breakdown, rework | Hold, commingling, missing measurement, duplicate retry |
The table is not a software scorecard. It is a way to turn factory constraints into data requirements and acceptance tests.
What published customer stories can—and cannot—teach
Published stories can explain rollout methods and data-use patterns. Their figures must not be copied into another company’s business case because customer, site, scope, period, and solution configuration differ.
Nisshin Flour Milling: cross-functional data use
A Microsoft customer story dated April 16, 2026 describes Nisshin Flour Milling working with MES, PLC, quality, and core business data and sharing more than 100 dashboards across departments. The lesson is not that more dashboards are always better. It is that manufacturing, quality, and management can use role-specific views built from shared data. This is a Microsoft-published case, and “more than 100” is specific to that case. Microsoft customer story: Nisshin Flour Milling
Weetabix: start small and reuse the template
Microsoft’s 2026 Weetabix story describes a rollout beginning at a smaller site and combining business experts with technical specialists. It reports post-go-live OTIF of 94%, an 8% increase in planned output, and a reduction in an acquired-site rollout from 2.5 years to six to nine months. These are project-specific Weetabix figures, not guarantees. The reusable lesson is the rollout design: develop the template and team capability at an initial site, then adapt it for the next site. Microsoft customer story: Weetabix
Sight Machine: measure non-value-added time
A Microsoft story dated June 3, 2026 cites a beverage-manufacturer example with a 75% reduction in non-value-added time and capacity improvement above 5%. It also describes productivity gains above 10% for a generalized approach. The first two are specific to the beverage case; the last is a published claim about the described approach. Any forecast for another plant must verify equivalent equipment, data, period, and formula. Microsoft customer story: Sight Machine
Four recurring failure structures
1. Excessive customization hides process ownership
Requests to reproduce every existing form and approval can preserve old exceptions and duplicate entry. Classify customization as a regulatory need, customer requirement, source of differentiation, or temporary migration measure. Record why standard behavior is insufficient and when temporary logic will retire.
2. Nobody owns the data
If units differ between ERP and the floor, asset names differ between maintenance and production, or BOM effective dates are ambiguous, more integration only moves disagreement faster. Assign a business owner, system of record, updater, approver, frequency, and quality rule to each critical data object.
3. A big-bang rollout discovers every exception at once
When all plants, products, and processes enter scope together, it becomes difficult to distinguish requirements, master-data, integration, and training issues. Prove representative normal and exception paths on one line or family, then separate the reusable template from site-specific needs.
4. Go-live is treated as the finish line
Reporting delays, master-data gaps, questions, and rework may rise immediately after go-live. Define stabilization targets at 30, 60, and 90 days, support ownership, severity levels, and the conditions for retiring the old process.
KPI design: baseline → target → formula → source
A KPI is evidence for a Go/No-Go decision, not decoration in a proposal. Do not promise an improvement rate before the baseline can be measured with the same formula.
| KPI | Baseline method | Example formula | Main source | Control point |
|---|---|---|---|---|
| On-time delivery | Historical confirmed orders and shipments | On-time shipment lines ÷ eligible lines | ERP shipment, customer due date | Fix rules for partial and short shipment |
| Schedule adherence | Frozen plan compared with actual | Lines completed in tolerance ÷ frozen lines | Schedule version, MES actual | Never erase the denominator by replanning |
| WIP queue time | Entry and exit timestamps | Current time − operation entry | MES, terminal, equipment | Separate waiting from processing |
| Setup duration | Setup start and finish | Finish − start | Terminal, PLC, work record | Keep planned and actual separate |
| Genealogy completeness | Presence of required links | Complete lots ÷ eligible lots | MES, quality, warehouse | Define required links by product family |
| Project cost variance | Estimate/budget compared with actual | Actual − baseline | ERP, labor, material, subcontract | Separate unrecorded cost from true variance |
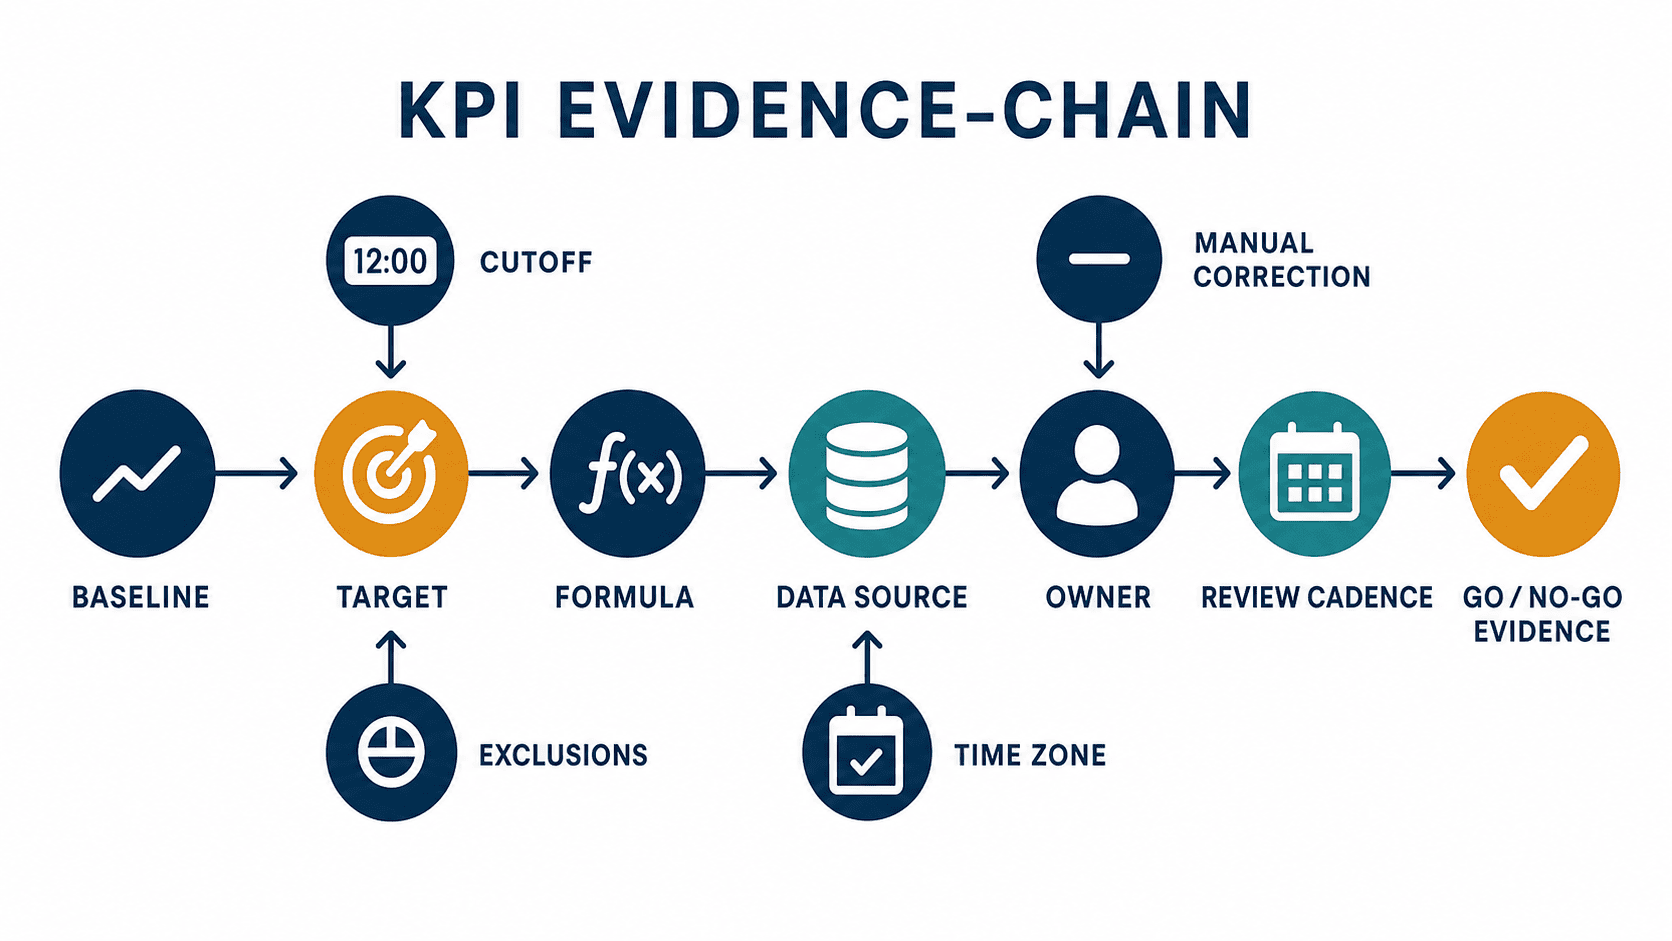
For every KPI, record period, site, exclusions, cutoff time, time zone, rounding, and treatment of manual corrections in a data dictionary. When dashboard and month-end reports differ, reconcile formula and cutoff before changing the display.
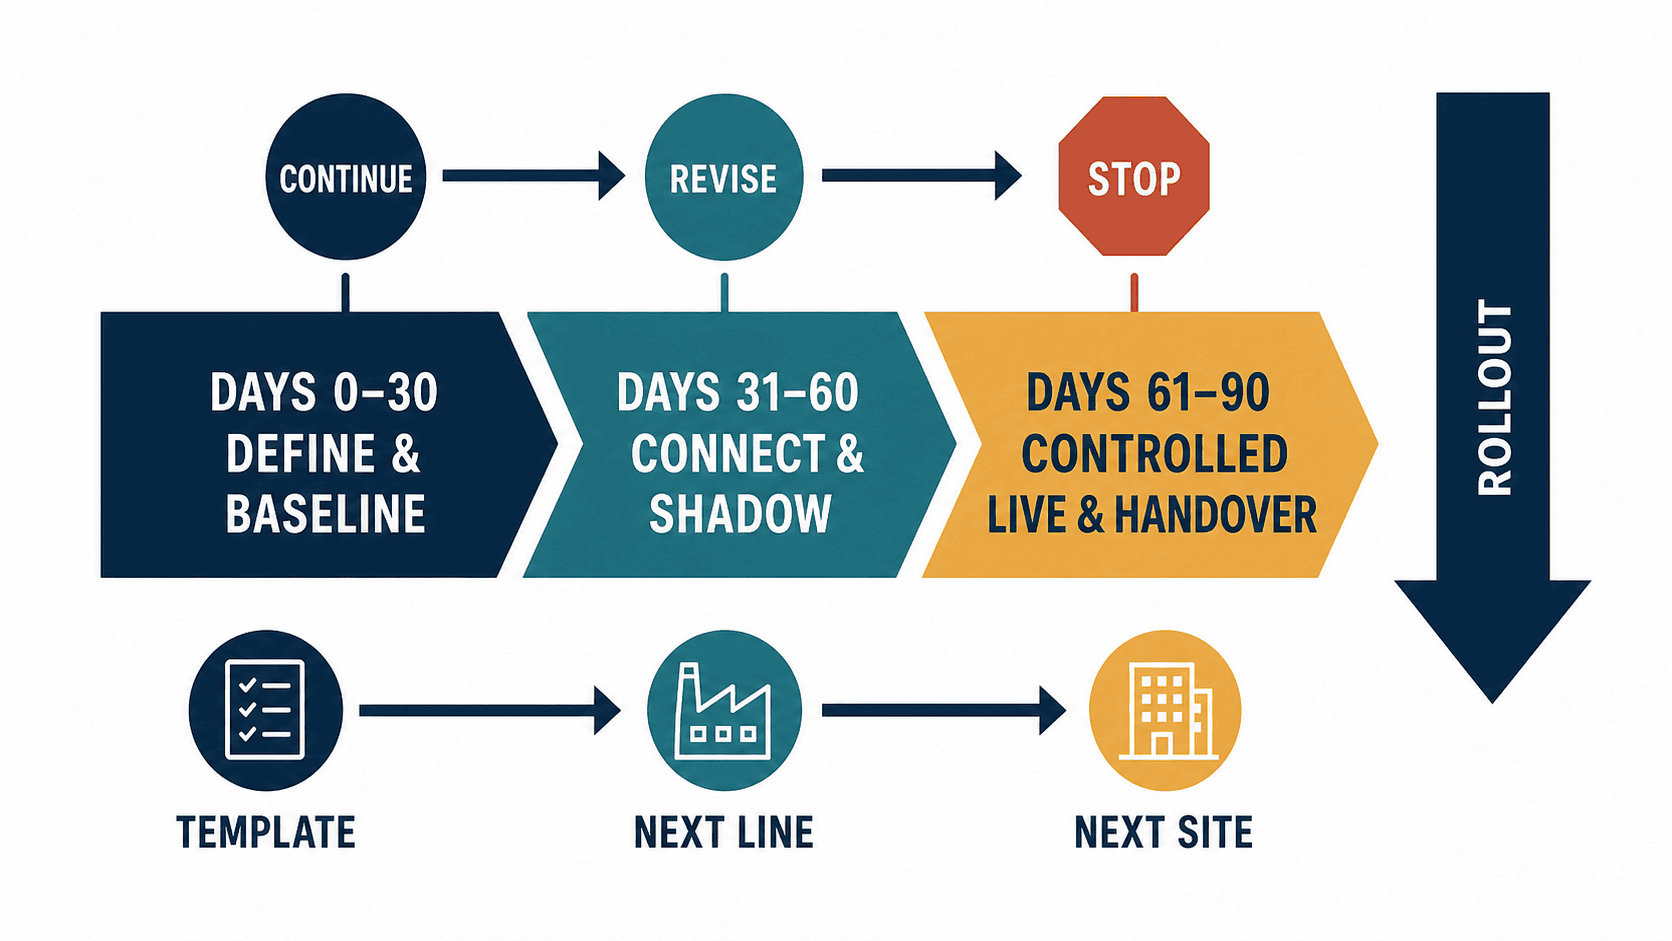
A 90-day PoC and phased rollout
Ninety days is an example of a controlled validation window, not a guaranteed success period. Equipment modification, long-lead procurement, or customer approval may require a longer schedule.
Days 0–30: define and baseline
- Confirm line, product family, shifts, users, and exclusions.
- Map current work, exceptions, forms, systems, and network constraints.
- Approve KPI baseline, formula, source, and owner.
- Define OT/IT security, access, backup, and outage procedures.
- Write FAT, SAT, and UAT scenarios with named decision makers.
Days 31–60: connect and shadow
- Connect limited master and transaction data.
- Run beside the current process and measure missing, duplicate, and time-shifted records.
- Test cancellation, retry, breakdown, shortage, and rework.
- Measure operator input load and supervisor exception-handling time.
Days 61–90: controlled live operation and handover
- Go live only within the approved boundary and review KPIs and incidents daily.
- Train production, quality, planning, maintenance, and IT by role.
- Register unresolved issues, temporary workarounds, and next-phase requirements.
- Decide Continue, Revise, or Stop from evidence.
Put measurable conditions in the RFP, FAT, SAT, and UAT
An RFP should include volumes and exceptions, not only a feature checklist: number of items, BOM depth, daily order lines and transactions, equipment count, sampling frequency, users, sites, languages, retention, peak load, and network limitations. For each interface, specify direction, frequency, method, retry, deduplication, monitoring, and ownership during failure.
- FAT checks configuration, reports, interfaces, permissions, and exceptions in a test environment.
- SAT checks local terminals, machines, network, printers, barcode devices, and time synchronization.
- UAT confirms that real user roles can complete both routine and exception work.
A Go/No-Go review should cover critical defects, migrated-data reconciliation, training, support, backup and recovery, rollback, and ownership of accepted open issues. A screen that opens is not an accepted business process.
Thailand context: BOI and depa
Thailand BOI’s Investment Promotion Guide 2026 includes Smart and Sustainable Industry measures and describes conditions involving efficiency enhancement and automation plans for existing projects. Eligibility depends on the activity, investment items, application timing, plan, evidence, and project status. This article is not tax, legal, or investment-incentive advice and does not claim that installing a production management system qualifies a company for BOI incentives. Confirm the current guide directly with BOI and seek qualified advice when needed. Thailand BOI Investment Promotion Guide 2026
The depa survey helps describe market maturity; it does not prove a company’s eligibility or investment return. Preserve your own pre-implementation baseline, eligible investment evidence, process change, measurement period, and source records.
FAQ about production management system implementation cases
Which number should I check first in a case study?
Check scope, baseline, formula, period, and source before the improvement percentage. Even “on-time delivery” changes depending on whether the denominator is an order, shipment line, quantity, or delivery. Treat published figures as case-specific and establish your own baseline.
What functions matter first for engineer-to-order production?
Project or manufacturing-number control, BOM and drawing revisions, change impact, long-lead items, operation reporting, and project cost are common priorities. Confirm whether the dominant delay is engineering approval, procurement, or production before fixing the scope.
Should a high-mix low-volume plant begin with an advanced scheduler?
Not always. A precise schedule cannot be executed if inventory, capacity, setup, and actual timestamps are unreliable. Stabilize constraint data and reporting, then confirm the planning granularity needed.
Should an automotive supplier implement ERP or MES first?
There is no universal sequence. Decide which system owns item, lot, operation, quality status, and time; then connect the most important use case around existing assets.
Can a 90-day PoC prove the full business benefit?
It can validate limited technical feasibility, data quality, operational burden, exception handling, and early KPIs. It may not capture seasonality or enterprise-wide impact. Separate the PoC conclusion from hypotheses for the next phase.
Does a production system automatically qualify for BOI incentives?
No such conclusion can be made from software installation alone. Confirm current requirements on activity, investment, timing, plan, and performance evidence directly with BOI; obtain professional tax or legal advice where appropriate.
Conclusion: convert a case study into your acceptance criteria
Production management system implementation cases are most useful when they sharpen your own decision criteria. Engineer-to-order plants can begin with BOM revision, delivery, and cost; high-mix low-volume plants with detailed scheduling, setup, WIP, and reporting; automotive-parts plants with the link among lot, quality, and shipment. Treat public results as case-specific, and fix your own baseline, target, formula, source, FAT/SAT/UAT, and Go/No-Go evidence.
You can discuss the implementation pattern closest to your factory, an RFP boundary, or KPI and acceptance conditions for a controlled PoC before selecting a vendor. To review your current ERP, shop-floor forms, and equipment data in a phased approach, contact TOMAS TECH.
References
- Rockwell Automation, 2026 State of Smart Manufacturing — vendor survey of 1,560 respondents in 17 countries; all percentages cited are survey-population results.
- ISA-95 official overview — official overview of Level 3/4 boundaries and the standards family; no compliance claim is made here.
- Microsoft customer story: Nisshin Flour Milling — Microsoft-published case; more than 100 dashboards is case-specific.
- Microsoft customer story: Sight Machine — published figures of 75%, above 5%, and above 10% are specific to the described case or approach.
- Microsoft customer story: Weetabix — OTIF 94%, planned output +8%, and six-to-nine-month rollout are case-specific.
- depa Digital Density Survey summary — 2025 summary of the 2024 survey; 70% and 87.33% depend on its sample and definitions.
- Thailand BOI Investment Promotion Guide 2026 — official guide for checking current Smart and Sustainable Industry conditions; eligibility requires direct confirmation.


