


The purpose of reviewing predictive maintenance case studies is not to paste an impressive saving into your investment request. It is to identify how a company selected equipment, fixed its baseline, named a failure mode, obtained a signal, triggered action and approved the result—then translate that chain into an acceptable 90-day PoC and RFP for your own plant. This guide gives plant management, maintenance, production engineering, IT/OT, purchasing and finance one decision structure, from case comparison through FAT, SAT, KPIs, TCO and ROI.
The first conclusion to draw from predictive maintenance case studies
Siemens publishes substantial outcomes for BlueScope, an unnamed global automotive manufacturer and Sachsenmilch. The most useful common feature is not the size of the number. In every case, an indication of degradation had to become a maintenance decision such as inspection, a planned intervention or component replacement. A dashboard by itself did not avoid downtime.
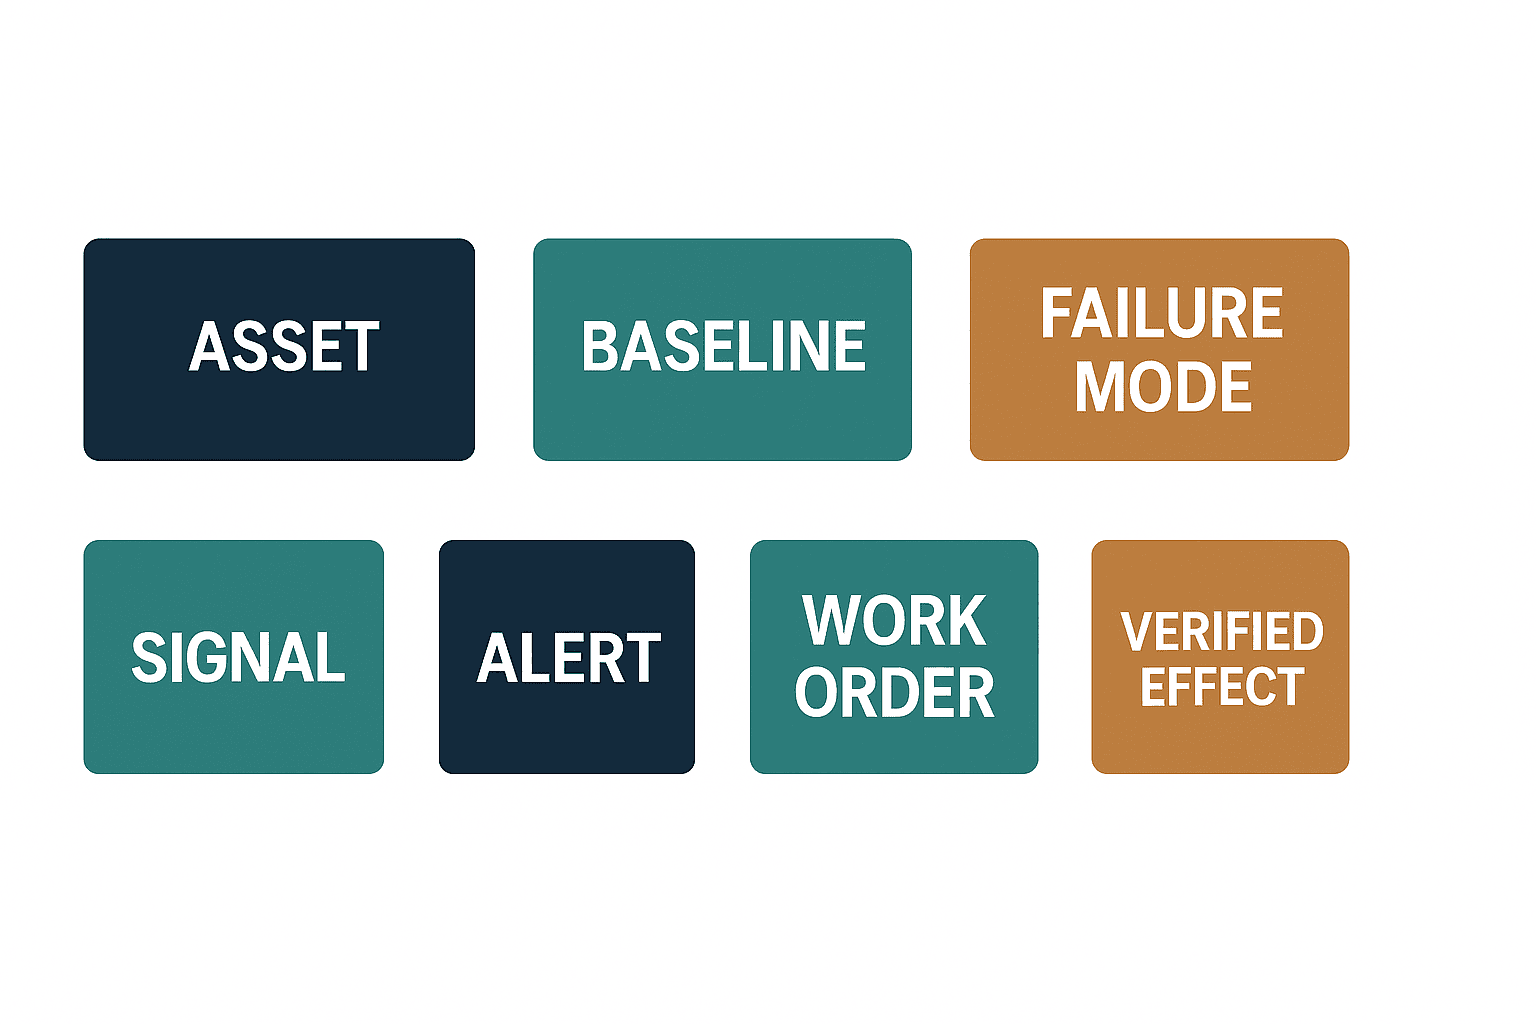
What a buyer needs is therefore a closed loop, not just “high-accuracy AI”:
- Select equipment by criticality and feasibility.
- Freeze a baseline for operation, stops, load, product and maintenance history.
- Connect a named failure mode to observable evidence.
- Prefer usable existing PLC data; add vibration, temperature, current or other sensing only where the hypothesis requires it.
- Give every alert evidence, severity, an owner and a deadline.
- Return inspection, work-order and intervention results to the event.
- Verify effect with a pre-agreed counterfactual and calculation rule.
If one link is absent, the PoC tends to end with “we can see a graph.” Even if no real failure occurs in 90 days, a PoC can still support an investment decision when data quality, replay tests, response procedures and benefit rules are accepted.
Comparing three predictive maintenance case studies
| Published case | Outcome published by Siemens | Design lesson | What cannot be generalized |
|---|---|---|---|
| BlueScope, steel | More than 1,950 hours of machine downtime and 53 complete process stops avoided since the journey began in 2022 | Early warnings were operationalized and expanded across sites in harsh continuous-process environments | Public information does not provide the full equipment denominator, counterfactual, cost scope or Thai-site economics |
| Unnamed global automotive manufacturer | More than 10,000 machines monitored and ROI in less than three months | Existing machine data, common asset structures and operating standards may enable scale across machine types and sites | The current case does not disclose enough about customer identity, financial scope or approval rules to transfer the payback |
| Sachsenmilch, dairy | Early detection of a pump approaching end of life; a customer statement says the action saved a low-six-figure euro amount and the pilot paid for itself | A specific warning generated value because it became a planned pump replacement | One pump result is not an expected saving for every pump or plant |
These are vendor-published Siemens cases and customer statements, not independently audited industry averages. The BlueScope page breaks its downtime figure into 1,200 hours in Australia and 750 hours elsewhere. This article does not convert that total into a transferable reduction percentage because the required denominator and calculation method are not disclosed. Siemens BlueScope customer story
For the automotive case, the current Siemens page states more than 10,000 machines, less than three months’ ROI and large downtime savings. A Siemens official blog also mentions 100 machine types and more than 650 engineers and maintenance workers. The lesson is not “every project pays back in three months.” It is that reusing existing data, structuring assets consistently, training users and standardizing multi-site operation matter when scaling. Siemens automotive case
For Sachsenmilch, Siemens’ June 2025 release describes the early identification of a pump nearing end of life and a planned replacement. The low-six-figure euro saving is reported as a statement by Sachsenmilch’s technical manager. We do not invent an exchange-rate conversion or a standard saving per pump. Siemens Sachsenmilch release
Keep Lighthouse figures attached to the named site and use case
The World Economic Forum Global Lighthouse Network playbook reports a 50% equipment-downtime impact for the predictive-maintenance use case at LG Electronics Changwon and a 25% maintenance-cost impact for the use case at Bosch Automotive Changsha. These figures belong to the site and transformation context described in the playbook. They are not default PoC targets for a Thai plant. WEF Global Lighthouse Network playbook
Use a benchmark as evidence that an outcome may be possible. Define a PoC target as a measurable change from your own accepted baseline.
Five questions that turn case comparison into a Do/Buy decision
1. What is the denominator?
If a case says 1,950 hours were avoided, ask for the period, sites, assets, stop definition, treatment of planned downtime, and the split between measured and estimated values. If it says 50% was reduced, ask for the pre-project hours, comparison period, volume, product mix and operating-day changes. A number without its denominator can indicate direction; it cannot support your financial model.
2. Who approved the counterfactual?
Predictive maintenance often has to support the statement “without this warning, the machine would have failed.” Preserve evidence: post-removal inspection, vibration trend, temperature, lubrication state, supplier inspection, prior comparable failures and any remaining-life assessment. Agree before the PoC how maintenance and finance will approve avoided loss. Do not let the supplier alone assign every alert a financial value.
3. What happened between warning and work?
This is the central question. An anomaly score does not reduce downtime. Find out who reviewed it, within what time, with which confirmatory measurement, how a spare was obtained, when the planned window occurred and what was measured after work.
4. How much came from existing data and how much from new sensing?
Some assets can reuse drive, PLC or historian data; others need vibration or another physical measurement. Evaluate run state, speed, torque, current, temperature, alarms and operating mode first. Add sensors only when the failure-mode hypothesis needs a quantity that is unavailable or unreliable.
5. Who operates the solution after deployment?
A supplier-managed weekly diagnostic service and a plant-operated daily workflow need different training, SLA, permissions and cost structures. Compare night and weekend coverage, Thai/English/Japanese communication, personnel changes, adding assets, model or rule maintenance, and data export at contract end.
Step 1: Select assets by criticality, detectability and actionability
A predictive maintenance system PoC should not begin with every machine. A good first asset has material failure impact, an observable precursor and enough response time to act.
| Selection axis | What to examine | Poor first-PoC example |
|---|---|---|
| Safety/environment | Injury, release, legal and protective-function consequence | The test requires changing a safety circuit |
| Production/quality | Bottleneck, WIP, due date and quality loss | An immediately available standby makes impact negligible |
| Failure mode | Named component and physical degradation mechanism | “The machine is old,” with no precursor hypothesis |
| Detectability | A physical quantity changes before failure | Sudden breakage with no useful precursor |
| Response window | Inspection and parts can be arranged after warning | A dangerous failure develops within seconds |
| History | Stops, inspections and replacements can be reconciled | Asset IDs and timestamps do not match |
| Testability | Signals and workflow can be replayed within 90 days | The only acceptable test is waiting years for a rare event |
Never replace a protective function with a prediction. Monitoring may supplement protection; it does not justify bypassing emergency stops, interlocks, protective relays or required inspections. Manage safety or control changes under formal risk assessment and management of change.
Pumps, fans, blowers, compressors, gearboxes and conveyor motors are common candidates, but select by failure mode rather than equipment label. Cavitation, misalignment, bearing degradation, seal leakage and blockage on the same pump require different evidence and actions.
Step 2: Freeze the baseline before claiming effect
One of the most common reasons effect verification fails is an ambiguous pre-project state. Accept the following by Day 30:
- Asset ID, component hierarchy, location and line relationship.
- Definitions of running, standby, changeover, failure stop, planned stop and quality stop.
- Product, speed, load, ambient or seasonal condition and shift context.
- Prior stoppages, failures, inspections, replacements and work duration.
- Sensor/PLC tag, unit, sampling, time source and quality field.
- KPI numerator, denominator, exclusion, closing time and approver.
For downtime reduction, decide whether planned stops are included, whether upstream waiting is excluded and how short stops are counted. A machine stop and a production-loss stop are not always the same when a buffer keeps the line running. Record both separately.
When connecting to a maintenance planning system, also verify inspection cycles, work orders, parts, skills and outage windows. Predictive maintenance creates value only when a warning can become executable work.
Step 3: Decompose equipment failure prediction into a failure-mode hypothesis
“AI predicts a breakdown” is not an acceptance requirement. State which component, which degradation, which observable quantity and which confirmatory inspection will support the decision.
| Field | Format example only |
|---|---|
| Target | Drive-end rolling bearing of pump P-101 |
| Failure mode | Bearing degradation associated with poor lubrication |
| Primary evidence | Trend in selected vibration band and envelope feature |
| Context | Speed, flow, load, product and cleaning state |
| Confounders | Cavitation, loose mounting and sensor detachment |
| Confirmation | Portable measurement, listening, lubrication check and visual inspection during a stop |
| Action | Inspect → lubricate → remeasure; plan replacement if necessary |
| Closure evidence | Finding, removed-part condition and before/after signals |
The U.S. Department of Energy O&M Best Practices Guide explains that vibration monitoring can help identify rotating-equipment conditions such as imbalance, eccentric rotors, misalignment, resonance, looseness, rotor rub and bearing problems. This is not a claim that one vibration sensor diagnoses every machine. Direction, mounting, measurement point, frequency range, sampling, speed and load must be engineered and accepted in FAT/SAT. U.S. DOE O&M Best Practices Guide
Step 4: Prefer existing PLC data and add vibration sensing where needed
Run/stop, speed, torque, current, temperature, alarms and valve states already held in a PLC or drive can connect a precursor to operating context. Before collection, accept:
- Read-only permissions.
- Approved tags, scan rate, concurrent connection and PLC-load limits.
- Network separation, accounts, certificates, logs and update ownership.
- Difference between controller time and collection time; buffering and replay after loss.
- Scaling, units, quality fields and tag-change history.
- An architecture with no monitoring write path into control or safety logic.
Older assets may need retrofit measurement. As described in our guide to IoT retrofit for aging equipment, clamp current, external vibration or surface temperature can provide read-only evidence. However, a change in position or mounting changes the meaning of the value. Link sensor ID, orientation, position photo, attachment method, calibration and replacement history to the asset master.
When extending into a condition-based maintenance system, do not rely on one absolute threshold. Combine operating-mode baselines, trend, multiple signals and a confirmatory inspection. Mixing low-load and high-load vibration in one population can turn normal load variation into a false alert.
Step 5: Convert alerts into work orders
Do not accept a completed alert screen as a completed PoC. Every alert should carry:
| Field | Acceptance evidence |
|---|---|
| Asset/failure mode | Asset ID, component, suspected mode and related signals |
| Reason | Raw values, trend, deviation, quality and operating condition |
| Priority | Safety, quality and production impact plus response time |
| Owner | First reviewer, approver and escalation contact |
| Confirmation | Site inspection, portable measurement, lubrication, image or electrical check |
| State | New, reviewing, work created, monitor, false/known event, closed |
| Work link | CMMS or maintenance-planning work-order ID |
| Result | Finding, part, labour, stop and before/after data |
Never silently delete a false alert. Classify false, duplicate, known event, bad data or no-action-required, then return the result to rule and threshold review. Ask whether weak evidence, excessive notifications, unavailable parts or missing authority caused inaction.
NIST’s PHMC programme emphasizes implementation, verification, validation, performance metrics, reference data and decision support for robust sensing, diagnostics and prognostics. Assess whether the PoC repeatedly produces information a plant can verify and act upon, not merely whether a model exists. NIST PHMC
The 30/60/90-day PoC gates
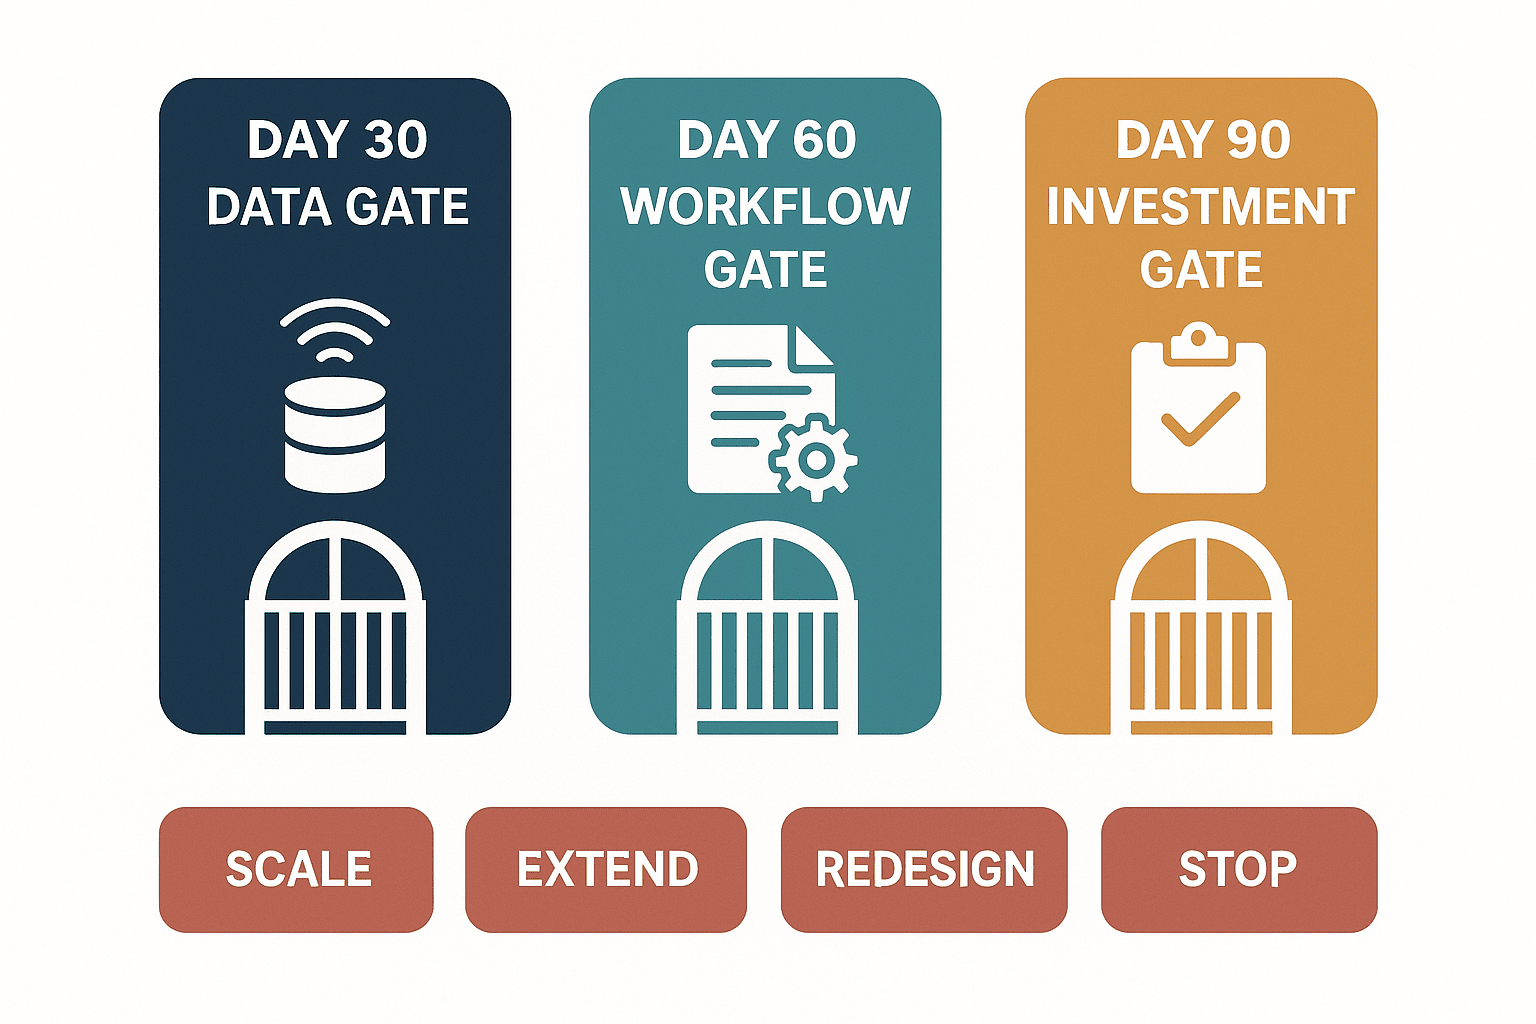
Days 0–30: scope, baseline and data-quality gate
The first gate does not require predicting a failure. It accepts what will be measured, under which comparison conditions, and whether the evidence is trustworthy.
- Asset, failure mode, owner and exclusions approved.
- Asset IDs, tags, sensors, units, time and operating modes mapped.
- Missing, duplicate, clock-shifted, out-of-range and detached-sensor states detected.
- Baseline period and comparison conditions approved.
- Monitoring separated from safety/control changes, with required MOC closed.
- KPI, benefit rule and owner approved.
Possible decisions are continue, continue with conditions, redesign or stop. Correct a poor sensor position before tuning an AI model. Repair master-data links before adding algorithms.
Days 31–60: alert-to-work gate
Do not wait for a real dangerous failure. Use historical waveforms, approved simulated inputs, a removed sensor, communication loss and threshold replay to test end-to-end behavior. Never create an unsafe machine fault for a demonstration.
- Alert arrives with asset, failure mode, evidence and priority.
- Thai, English or Japanese staff can review within the agreed time.
- The result becomes a work order or a documented monitor decision.
- Night, weekend and unavailable-owner escalation can be replayed.
- False, duplicate, missing and resent data are handled and recorded.
- Findings and before/after data return to the same event ID.
Days 61–90: operating, economic and safety investment gate
Do not decide on one accuracy figure. Combine technical, operating, economic, cyber and safety evidence.
| Decision axis | Example evidence | Possible decision |
|---|---|---|
| Technical | Completeness, reproducibility, detection and confirmation | Scale / redesign sensing |
| Operating | Response, work conversion, closure and training | Plant-operated / managed service |
| Economic | Approved benefits, TCO and sensitivity | Deploy / extend / stop |
| OT security | Access, logs, backup, recovery and vulnerability process | Correct before production |
| Safety/quality | MOC, risk, calibration and audit evidence | Approve / narrow scope |
If no failure occurs, do not invent avoided downtime. Fix the evidence you do have—data quality, replay results, operating effort and TCO—and carry event-frequency uncertainty into continued measurement or sensitivity analysis.
Mandatory predictive maintenance system RFP content
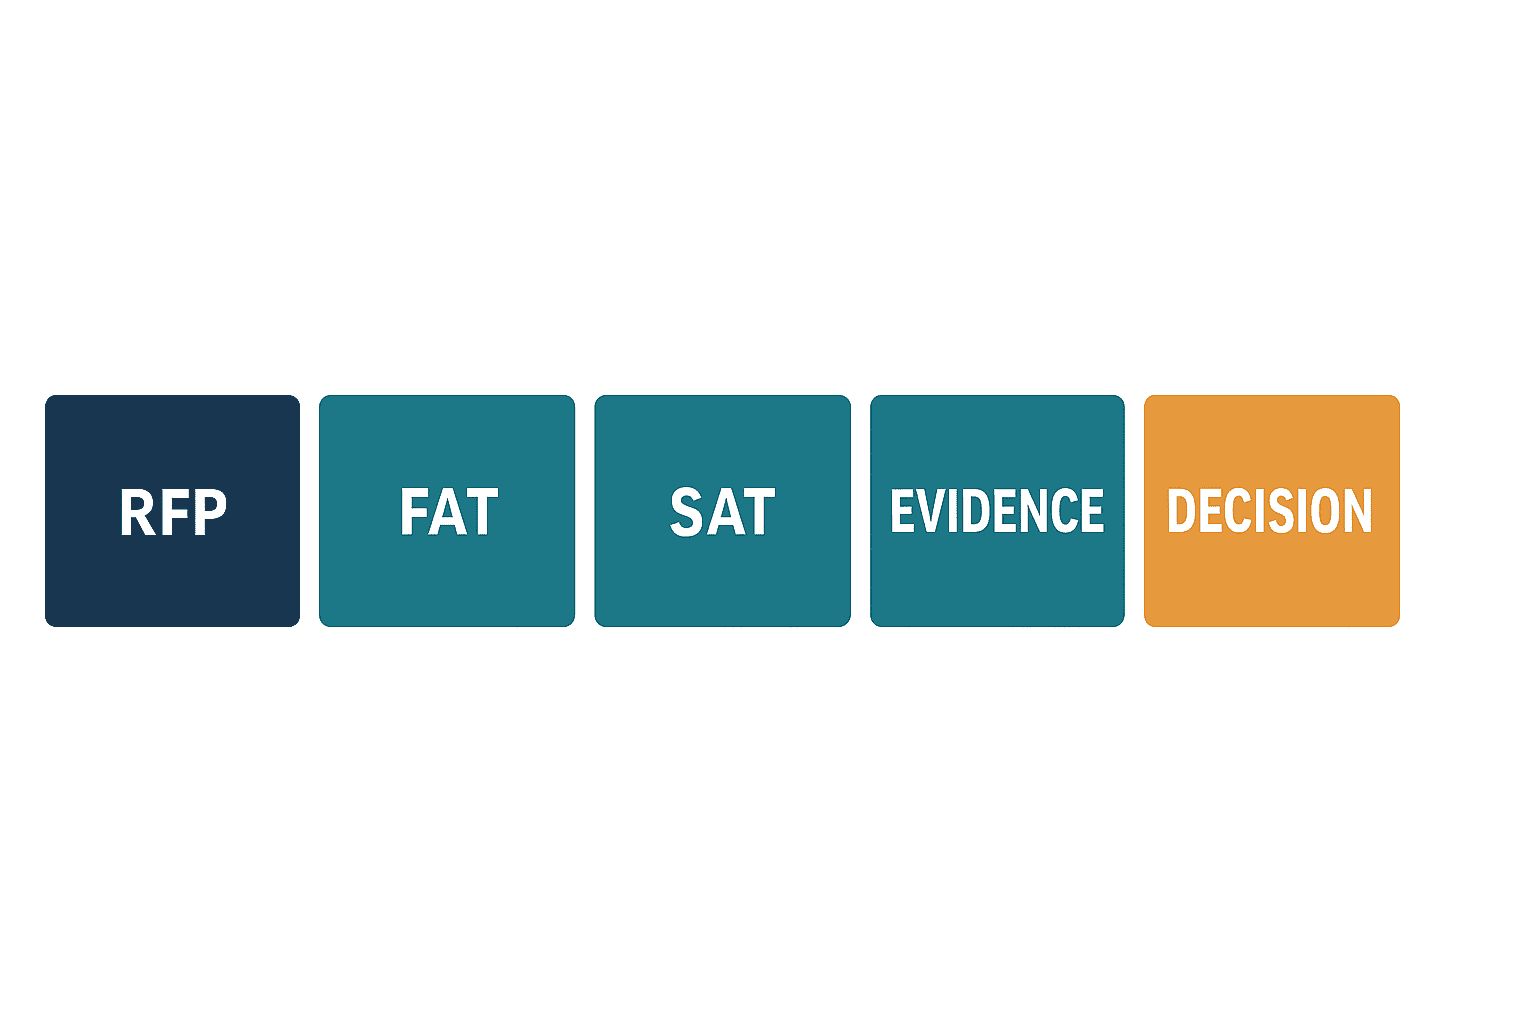
An RFP should turn acceptance evidence into clear contractual requirements, rather than merely list product features.
1. Outcome, scope and exclusions
- Downtime or maintenance problem and management KPI.
- Assets, components, failure modes, site, language and shifts.
- Safety control, PLC write access and automatic shutdown excluded from the PoC.
- Decision owner for scale, extension or exit after 90 days.
2. Data and sensors
- Existing PLC/SCADA/drive/CMMS interface and read constraints.
- Vibration, temperature or current point, direction, range, sampling and calibration.
- Timestamp, quality, sequence, missing, duplicate and replay rules.
- Context link to asset, operating mode, product and work history.
3. Analytics and explainability
- Role of thresholds, rules, statistics and machine learning.
- Training period, update, version, change approval and rollback.
- Evidence and recommended confirmation shown in an alert.
- False/missed event review and improvement process.
4. Workflow and integration
- State flow for review, approval, work order, completion and reassessment.
- CMMS/ERP/email/mobile interfaces.
- Night, weekend and multilingual escalation.
- API, export, audit log and persistent event ID.
5. OT security and availability
- Architecture, communication direction, accounts, least privilege and certificates.
- Patch, vulnerability, SBOM, log, backup, recovery and disaster arrangements.
- Buffer and automatic recovery through network, power or cloud loss.
- Incident contact, responsibility boundary and remote-access process.
6. Ownership, price and exit
- Ownership and rights for raw data, features, model, settings and findings.
- Initial and recurring breakdown: sensing, works, communication, training, support and added assets.
- Export, deletion proof, equipment removal and migration support at contract end.
- Correction, retest and cost responsibility after a failed FAT/SAT item.
FAT and SAT acceptance
FAT: prove reproducibility before site installation
Use tags, sensors, gateway, analytics and integration settings that match the intended solution as closely as practical.
- Tag/sensor-to-asset mapping.
- Unit, scaling, timestamp, quality and sequence.
- Replay of normal, threshold crossing, missing, stuck, noisy, duplicate and out-of-order input.
- Buffering during loss, resend after recovery and duplicate prevention.
- Alert reason, priority, notification, approval and work-order integration.
- User role, audit log, configuration change, backup and restore.
- CSV/API export and contract-end portability.
Opening a screen is not a passing test. Trace input, processing, notification, work, history and export by one event ID.
SAT: prove usability under Thai plant conditions
Include local power, network, machine, product, speed, shift, language and work-permit conditions.
- Position, orientation, wiring, enclosure, label and as-built drawing.
- Acceptable PLC load and no control write path.
- Mapping between actual operating mode and data baseline.
- Automatic recovery after power, network and gateway restart.
- Site staff review, inspection, work-order creation and closure.
- Classification of false/known event, sensor fault and missing data.
- Buyer-side recalculation of KPI and daily/weekly review.
- Usable training, procedure, support and escalation.
Measure the closed loop, not only the model
| KPI | Calculation or check | Control |
|---|---|---|
| Data completeness | Valid records ÷ expected records | Do not store communication loss as a normal zero |
| Time alignment | Source-time difference from reference | Do not assess only receive time |
| Confirmed-alert rate | Confirmed precursor/abnormality ÷ reviewed alerts | Name the approver of “confirmed” |
| Duplicate/false rate | Duplicate or no-action alerts ÷ all alerts | Preserve and classify causes |
| Response time | Notification to first review | Separate out-of-shift performance |
| Work conversion | Work orders ÷ reviewed alerts | Preserve justified no-work decisions |
| Closed-loop rate | Results returned ÷ completed work | Distinguish closure without findings |
| Planned-time conversion | Time moved from unplanned to planned intervention | Requires approved counterfactual |
| MTBF/downtime | Compare under agreed asset, period and state rules | Display volume and load changes |
| Avoided loss | Approved avoided time × site-specific loss rule | Avoid supplier-only approval |
Model precision, recall and lead time matter, but weak ground-truth labels make early figures unstable. Build label quality with inspection findings and removed-part evidence. NISTIR 8012 notes broader PHM gaps involving data collection and analysis, data management, training and interoperability; do not reduce acceptance to one accuracy value. NISTIR 8012
Calculate TCO and ROI with your plant’s variables
Do not fill a budget with an invented “market price.” Insert RFP quotations and internal costs into a transparent model.
Initial TCO = sensors and instruments + gateway and network + integration and configuration + engineering and installation + FAT/SAT and training + OT-security and safety work + initial data preparation.
Annual TCO = licence and hosting + calibration, battery and replacement + support + rule/model maintenance + communication and storage + internal operating labour + refresher training.
Verified annual benefit = approved avoided-downtime value + verified parts, contractor and inspection-labour reduction + approved quality and energy benefit − false-alert handling and new-failure cost.
Net annual benefit = verified annual benefit − annual TCO.
Simple payback = initial TCO ÷ net annual benefit.
ROI over N = (cumulative verified benefit − cumulative TCO) ÷ cumulative TCO.
Only show simple payback when net annual benefit is positive. Run low, base and high sensitivity cases for event frequency, alert success, avoidable time, loss per hour and annual cost. Show which assumption reverses the decision.
Do not insert BlueScope’s 1,950 hours, the automotive case’s less-than-three-month ROI, or Sachsenmilch’s low-six-figure euro statement into your formula. Use your stop taxonomy, contribution margin, overtime, scrap, recovery costs and approval rules.
Supplier comparison table
| Area | Buyer question | Strong-answer characteristic |
|---|---|---|
| Diagnosis | Who defines failure mode and measurement? | Named equipment, vibration/electrical and process competence |
| Data | How will existing PLC data be evaluated? | Includes load, time, quality and change management |
| Analytics | Can the reason for an alert be shown? | Raw evidence, trend, context and version available |
| Operation | Who does what after an alert? | Specific RACI, SLA, work order and closure |
| Validation | How is a no-failure 90 days assessed? | Replay, data quality and operating KPIs |
| Economics | Who approves avoided loss? | Buyer approval, evidence and audit trail |
| OT | How are monitoring, control and safety separated? | Read-only, segmentation, MOC and recovery detail |
| Exit | What remains after termination? | Raw data, settings and history in usable format |
Large platforms, specialist diagnostic firms, OEMs, system integrators and in-house teams all have strengths. Select against your failure modes, existing data, operating capability and SLA. Give bidders the same acceptance scenarios.
Common failure patterns
Making “sensors on every machine” the goal
Sensor count is deployment volume, not an outcome. Limit scope by criticality, failure mode and actionability, then repeat only the asset pattern that proves value.
Training on normal data without explaining failures
Anomaly detection can start the investigation, but the plant must separate operating mode, product, cleaning, changeover and sensor fault from degradation. Return site findings as labels.
Ending at an email alert
Without an owner, deadline, confirmation step, part and outage window, a warning is not actionable. Connect it to work by event ID.
Letting the supplier calculate all value
It is quick for a sales slide but weak for audit. Before the PoC, have plant and finance approve rules, evidence and authority.
Omitting post-PoC cost and exit
Compare production TCO: assets, users, retention, API, support, model maintenance, calibration and removal. Contract for data export and deletion.
FAQ: From predictive maintenance case study to PoC
Can we use another case’s downtime-reduction percentage as our target?
Use it only as possibility evidence. Asset scope, denominator, period, stop definition, operating context, financial scope and counterfactual differ. Build low, base and high cases from your baseline and approve the rule by Day 30.
Can a predictive maintenance system start with existing PLC data only?
Yes, if it contains evidence relevant to the failure mode and has adequate quality, time and load context. Assess run state, current, torque, temperature and alarms first. Add sensors where the required physical quantity is missing. Keep PLC write access outside a monitoring PoC.
How many vibration sensors are required for equipment diagnosis?
Machine count alone cannot answer that. Component, mode, direction, bearing position, speed, structure, measurement band and cable/wireless conditions determine points. Require a point-by-point rationale, position drawing and FAT/SAT tests.
What accuracy should equipment failure prediction achieve?
Use failure-mode-specific precision, recall, lead time, false-alert load and closed-loop rate. In an early project with little ground truth, prioritize historical replay and verified inspection labels.
Can downtime reduction be proved in 90 days?
It depends on event frequency. If no failure occurs, do not invent avoided hours. Accept data quality, replay, response, work integration, operating effort and TCO; continue real-event measurement or sensitivity analysis.
What is the difference between FAT and SAT?
FAT replays tags, sensors, calculation, faults, notification, permissions and export before site acceptance. SAT verifies end-to-end use with the Thai plant’s actual equipment, load, power, network, shift, language and procedures.
Is deciding not to deploy after 90 days a successful PoC outcome?
Yes. Evidence that a precursor is not measurable, response time is insufficient, TCO exceeds benefit or safety/operating conditions are not ready is a valid stop or redesign decision. A PoC should reduce uncertainty, not force continuation.
Summary: Buy an acceptable decision loop, not a borrowed case number
Predictive maintenance case studies demonstrate possible outcomes and implementation patterns. BlueScope’s more than 1,950 hours and 53 complete stops, the automotive case’s more than 10,000 machines and less-than-three-month ROI, and Sachsenmilch’s pump result are Siemens-published statements, not guarantees for your plant. A Thai factory should translate cases into equipment selection, baseline, failure mode, existing PLC/sensor evidence, alert, work order and effect verification, then accept the chain at 30/60/90-day gates through RFP, FAT and SAT. Calculate TCO and ROI with your quotations, history, loss rules and approval process.
TOMAS TECH can support the stage before a product or sensor has been selected: asset and failure-mode scoping, existing PLC-data review, a 90-day PoC, RFP preparation, and FAT/SAT acceptance for factories in Thailand. If you have collected cases but cannot yet turn them into an internal proposal and specification, you are welcome to discuss it through our contact page.
References
- Siemens: BlueScope predictive-maintenance customer story
- Siemens: global automotive manufacturer case
- Siemens: Sachsenmilch press release
- NIST: Prognostics, Health Management, and Control
- NISTIR 8012: Standards Related to PHM for Manufacturing
- U.S. DOE: O&M Best Practices Guide, Release 3.0
- World Economic Forum: Global Lighthouse Network playbook


