


Search for a WMS comparison and you land on a table of product names. Read it top to bottom and you still cannot tell which one your plant needs. The reason is simple. What you should be comparing is not the products but how much structure your own warehouse actually requires. This article scores that requirement from six variables such as active SKU count and location count, then models what a wrong pick costs, using a Japanese-owned plant in Thailand and figures in THB.
A WMS comparison goes nowhere when you compare the wrong thing
Most warehouse system projects start with the question “which product is best”. Someone visits an exhibition, collects feature lists from a few vendors, and builds a grid of ticks and crosses. That grid almost always crowns the product with ticks in every row. Of course it does. Feature lists are built so that the product with the most features wins.
What follows is predictable. A quotation arrives that includes functions your plant will never use, the number shocks the steering committee, and the project stalls. Or the number wins and you take the cheap option, only to discover six months later that it cannot hold your operation, and you replace it.
Both outcomes come from skipping the step that belongs before the comparison. That step is measuring how complex your warehouse actually is. Complexity cannot be judged by feel. It is not unusual for one plant manager to call his warehouse complicated and another to call his simple when the two operations are almost identical. So we measure it with variables.
What a WMS actually is, and how it differs from an inventory management system
WMS stands for Warehouse Management System. The label covers an enormous range in the market. Some vendors call an ERP option a WMS. Others use the same word for the control software of an automated storage system. Answering “what is a WMS” in a single sentence therefore has no practical value.
It is far more useful to split systems that handle stock into three levels by the granularity at which they hold inventory.
Level 1, the standard inventory module inside an ERP
The inventory function every ERP ships with. Stock is held as a quantity per item and per warehouse. You can see that 1,000 pieces of part A sit in warehouse 2, but not which rack in warehouse 2 holds them.
Movements are usually keyed in from a PC, or posted automatically from production results and shipping instructions. The person who physically touched the goods is not the person who recorded them, so a gap between record and reality is structural. That gap gets reconciled once a month at stocktake.
Plenty of plants run perfectly well like this. If the item count is low, storage positions are fixed, and nobody wastes time hunting for goods, managing rack addresses in software buys you almost nothing.
Level 2, a single-purpose inventory management system
Stock is held as a quantity per item, per location and per lot. Location means the rack address. Part A becomes 600 pieces in bay A-03-2 and 400 pieces in bay B-11-1.
More importantly, the record is captured on a handheld terminal at the moment somebody touches the goods. Scan the label on receipt, scan the rack you put it on, and scan again on issue. The gap between record and reality shrinks for structural reasons rather than through discipline.
Products in this band are sold as inventory management systems, as location management systems, and quite often as WMS. The reason the difference between a WMS and an inventory management system feels blurry is that this band is sold under both names.
Level 3, a full WMS
This level holds everything Level 2 holds and then issues work instructions on top of it.
Who walks which route, picks from which rack, and takes how many. Whether several orders are picked in one pass or one at a time. Where a received pallet should be put away. Which inspection line a return should be routed to. The system decides how people and equipment move, and tells them.
Level 3 is therefore not a system that records inventory. It is a system that controls warehouse work. That is a harder job than recording, and both the requirements phase and the change management are heavier.

How the cost stack builds up is not the subject of this article. If you want the structure of why software licence is the smaller half of the bill, see the breakdown of WMS cost across a five-year total.
The WMS comparison decision model, six variables that set your level
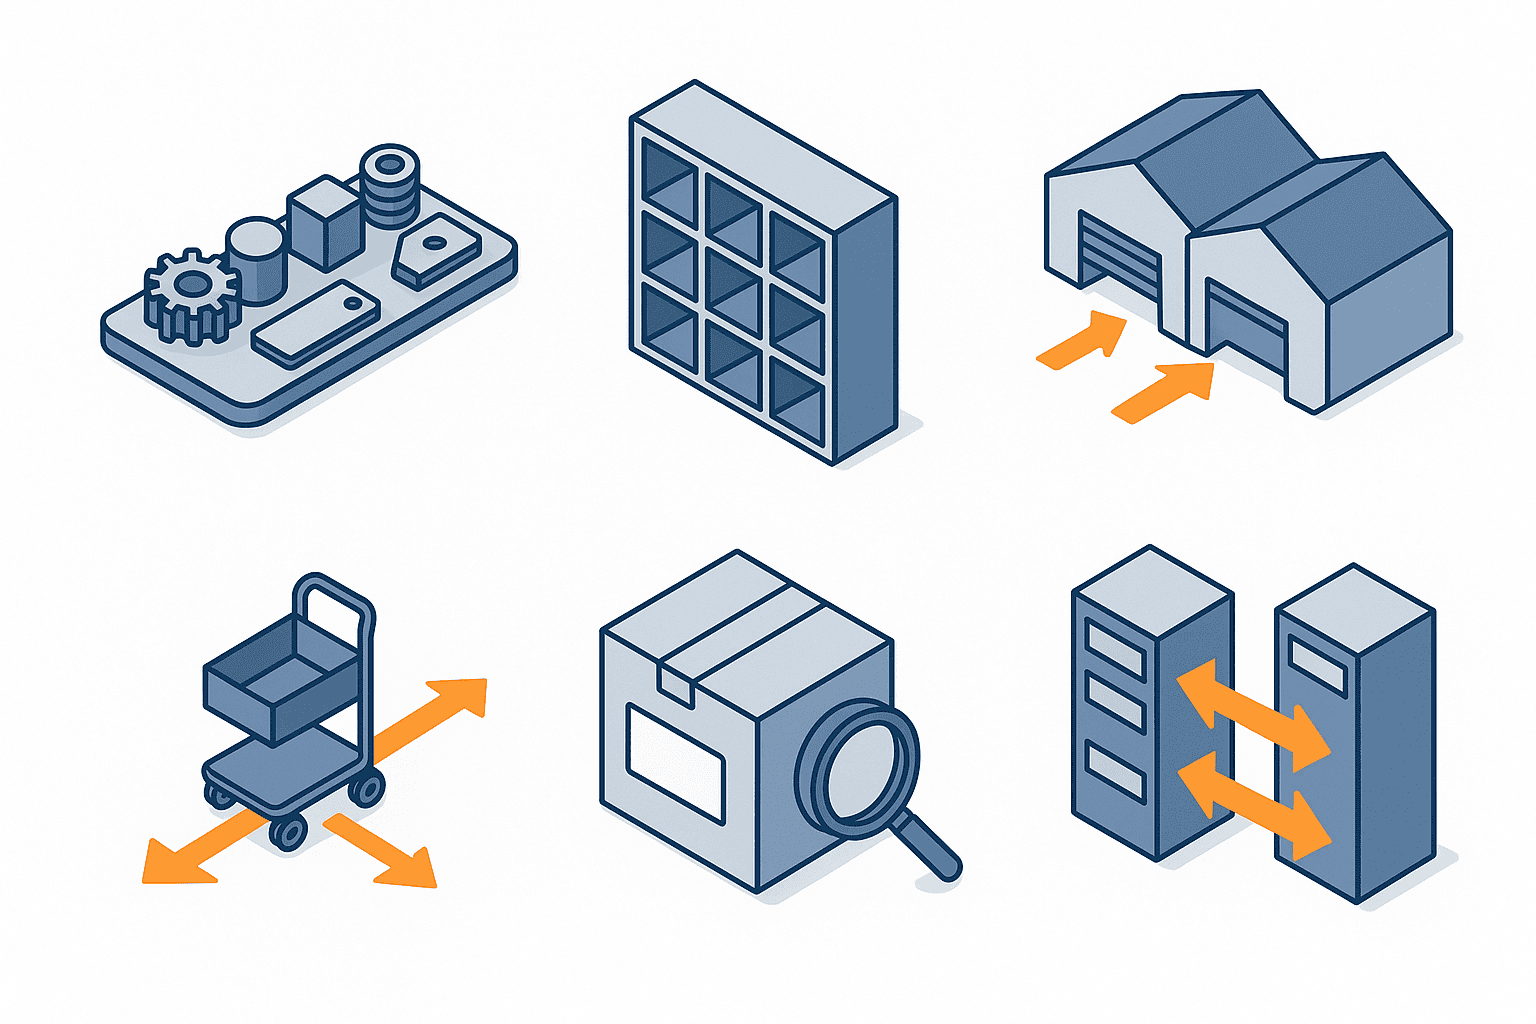
Score each of six variables from 0 to 3 points, for a total between 0 and 18.
| Variable | What it measures |
|---|---|
| Variable 1, active SKU count | Items that moved at least once in the last 12 months |
| Variable 2, managed location count | Bays you want to track as distinct addresses |
| Variable 3, owners and sites | Whose stock you hold, across how many buildings |
| Variable 4, complexity of warehouse work | Picking methods, value-added work, returns |
| Variable 5, traceability requirement | How far lots and expiry dates must be enforced by software |
| Variable 6, integration with other systems | What you connect to, and at what cycle |
The scoring rules for each variable follow. Read them with your own numbers in hand.
Variable 1, active SKU count
Count the items that actually move, not the total item master including dead stock. Items that never move barely add difficulty.
| Points | Condition |
|---|---|
| 0 | Fewer than 200 |
| 1 | 200 or more, under 800 |
| 2 | 800 or more, under 3,000 |
| 3 | 3,000 or more |
Variable 2, managed location count
Count the bays you want to manage as distinct addresses, not the racks you happen to own today. If an item always sits in the same place, you do not need fine addresses. If you want free-location storage where goods go wherever there is space, the bay count becomes the managed count directly.
| Points | Condition |
|---|---|
| 0 | No rack address management |
| 1 | Fewer than 300 |
| 2 | 300 or more, under 5,000 |
| 3 | 5,000 or more |
Variable 3, owners and sites
This variable behaves differently from the others. If you hold somebody else’s stock for a fee, meaning you act as a 3PL with clients, you need billable activity capture, per-client screens and reports, and hard segregation of stock by owner. A Level 2 product cannot bridge that in principle.
| Points | Condition |
|---|---|
| 0 | One site, own stock only |
| 1 | Two or three sites, own stock only |
| 2 | Four or more sites, or consigned stock held without charge |
| 3 | Stock held for two or more paying clients |
Variable 4, complexity of warehouse work
Measure the number of different work patterns, not how often you repeat one. A warehouse processing 3,000 lines a day in one uniform way is easier for software than one processing 300 lines a day in five different ways.
| Points | Condition |
|---|---|
| 0 | Receipt and issue only, picking runs on people’s memory |
| 1 | A single picking method, no value-added work |
| 2 | Two or more picking methods in parallel, or returns and value-added work |
| 3 | Wave picking and sortation, kitting, or linkage with automated equipment |
Variable 5, traceability requirement
Measure whether it must be enforced by software, not whether you record it. If lot numbers go into a paper ledger and that ledger passes your customer audits, this variable scores 1.
| Points | Condition |
|---|---|
| 0 | Only quantities need to match |
| 1 | Lots are recorded, and paper plus a spreadsheet is enough |
| 2 | Lot or serial must be enforced by the system |
| 3 | First-expiry-first-out or unit serial tracking must gate the shipment itself |
Variable 6, integration with other systems
Both the number of counterparties and the required cycle matter. If a single nightly batch is enough, standard Level 2 functionality almost always covers it.
| Points | Condition |
|---|---|
| 0 | No integration, the system runs standalone |
| 1 | One nightly batch to ERP or production control |
| 2 | Near-real-time links to several systems, customer ASN issued |
| 3 | Second-by-second allocation shared with an online store or an automated warehouse |
How to read the total
Map the six-variable total onto these bands.
| Total | Verdict |
|---|---|
| 0 to 5 | Level 1. The standard ERP inventory module is enough |
| 6 to 11 | Level 2. A single-purpose inventory management system fits |
| 12 to 18 | Level 3. You need a full WMS |
There is exactly one override. If Variable 3 scores 3, meaning you hold stock for two or more paying clients, the verdict is Level 3 regardless of the total. A system that cannot produce the billing evidence for a 3PL contract fails the business no matter how well it does everything else.
Thailand market-size charts are not a basis for a WMS decision
Anyone evaluating a WMS in Thailand gets shown a market growth chart. It is worth pausing to see how little those numbers can carry.
A Mobility Foresights report (Last Updated Sep 25, 2025) puts the Thailand warehouse management system market at USD 5.9 billion in 2025, growing to USD 12.7 billion by 2031 at a CAGR of 13.6 percent.
A MarketsandMarkets release dated 6 October 2025 puts the global WMS market at USD 4.57 billion in 2025 and USD 10.04 billion in 2030, at a CAGR of 17.1 percent.
That makes Thailand alone larger than the world. It is not a typo. The two are counting different things. One counts software licences and maintenance, the other folds in equipment, installation work and operating services. Market-size figures are usable for confirming a direction of travel. They are useless as the basis for your own investment case. Paste one into an approval paper and the first question back will be what it means for your plant.
The underlying demand story is still consistent across sources. The 6Wresearch Thailand 3PL report (published April 2025, updated June 2026) puts the whole market at a modest CAGR of 1.59 percent for 2026 to 2032, while singling out warehousing as the fastest segment at a CAGR of 12.3 percent. JLL’s Thailand Industrial Market Dynamics Q1 2026, dated 19 May 2026, reports that first-quarter absorption slowed while demand shifted toward existing inventory, with only modest supply additions in the Eastern Economic Corridor.
The signal is a shift from building new warehouses to using existing ones better. That is precisely WMS territory. It still does not tell you that your plant needs a full WMS.
Running the model on a real-shaped plant
Abstractions only go so far, so here is a plant to score.
A Japanese-owned automotive parts maker in Chonburi, a tier-2 supplier, 320 employees. It runs two of its own buildings, a finished goods warehouse and a parts warehouse. An ERP is already live, but stock is held only as quantity per item and per warehouse.
| Assumption | Value |
|---|---|
| Average inventory value | 28,000,000 THB |
| Active SKU count | 1,400 |
| Managed location count | 2,600 |
| Warehouse operators | 18 |
| Annual warehouse labour cost | 5,220,000 THB |
| Annual shipping lines | 96,000 |
The annual warehouse labour cost comes from 18 people at 2,000 hours a year and a fully loaded rate of 145 THB per hour. Scoring this plant against the six variables gives the following.
| Variable | Condition applied | Points |
|---|---|---|
| Variable 1, active SKU count | 1,400, in the 800 to under 3,000 band | 2 |
| Variable 2, managed location count | 2,600, in the 300 to under 5,000 band | 2 |
| Variable 3, owners and sites | Two own sites, no consigned stock | 1 |
| Variable 4, complexity of warehouse work | One picking method, no value-added work | 1 |
| Variable 5, traceability requirement | Lot enforced in software for defect traceback | 2 |
| Variable 6, integration with other systems | One nightly batch to ERP and production control | 1 |
The total is 9. That sits in the 6 to 11 band, so the right answer for this plant is Level 2, a single-purpose inventory management system. A full WMS is not required.
One caveat on the inputs. How much stock you hold at all depends on the reorder points and safety stock covered in the article on setting optimal inventory levels. If your inventory policy is unsettled, both the SKU count and the location count will move after you score.
What a wrong pick costs
A decision model is only worth the money it saves when you get it wrong. Three scenarios, compared on a five-year total.
Scenario A, correctly choosing Level 2
| Item | THB |
|---|---|
| Initial cost, software, build, 12 handhelds, wireless, master data | 1,850,000 |
| Maintenance and subscription, 240,000 for 5 years | 1,200,000 |
| Internal effort during rollout | 320,000 |
| Five-year total | 3,370,000 |
This is the baseline. The other two scenarios are judged against 3,370,000 THB.
Scenario B, over-buying a full WMS
The score said 9, but the full WMS seen at an exhibition won the decision.
| Item | THB |
|---|---|
| Initial cost | 5,400,000 |
| Maintenance, 780,000 for 5 years | 3,900,000 |
| Internal effort including requirements definition | 900,000 |
| Five-year total | 10,200,000 |
The gap against Scenario A is 6,830,000 THB.
To be honest about it, a full WMS will still run this warehouse. Over-buying does not break anything. The problem is that the extra 6,830,000 THB buys effects that do not occur under this plant’s conditions.
This plant has one owner, no value-added work, and no expiry management. Of everything Level 3 offers, about the only thing left with real value is optimised picking instructions. Take the 5,220,000 THB of warehouse labour, assume the outbound picking process accounts for 45 percent of it at 2,349,000 THB, and assume a 3.0 percent improvement on that. The result is roughly 70,000 THB a year, or 350,000 THB over five years.
Net, the plant is out of pocket by 6,480,000 THB. Recovery is around 5 percent, which means it does not pay back under these conditions. You can build a paper that inflates the ROI and get it approved. It will fall apart at the year-three benefits review.
Scenario C, starting under-specified at Level 1 and replacing after two years
The opposite failure. Budget is tight, so the ERP inventory module is configured to cope, and two years later the plant concludes it does not work and installs Level 2 after all.
| Item | THB |
|---|---|
| Level 1 build, ERP configuration and light label handling changes | 620,000 |
| Level 1 maintenance, 60,000 for 2 years | 120,000 |
| Level 2 initial cost after two years, 1,850,000 plus 380,000 for migration and retraining | 2,230,000 |
| Level 2 maintenance, 240,000 for 3 years | 720,000 |
| Internal effort, 180,000 for Level 1 and 320,000 for Level 2 | 500,000 |
| Direct cost total | 4,190,000 |
On direct cost alone the gap against Scenario A is 820,000 THB, which most steering committees would treat as rounding. The real cost sits on the side that never reaches an invoice.
Two years of forgone benefit, the effects Level 2 would have delivered, stack up as follows.
| Forgone item | Per year (THB) | Formula |
|---|---|---|
| Reduction in stocktake discrepancy | 364,000 | 28,000,000 times 1.3 points |
| Excess hunting and counting labour | 417,600 | 5,220,000 times 8 percent |
| Cost of handling mis-shipments | 288,000 | 240 cases times 1,200 |
| Annual total | 1,069,600 |
The discrepancy assumption is a fall from 1.8 percent to 0.5 percent of inventory value, a swing of 1.3 points. Mis-shipments are assumed to fall from 0.35 percent to 0.10 percent of the 96,000 annual shipping lines, meaning 240 fewer cases a year, at 1,200 THB per case for the reshipment and the apology handling.
Over two years that is 2,139,200 THB. Adding direct cost, Scenario C really costs 6,329,200 THB, and the gap against Scenario A is 2,959,200 THB.

The two mistakes hurt in different ways
The over-buying loss of 6,480,000 THB shows up on invoices, so it becomes an internal issue by year two at the latest. The under-specifying loss of 2,139,200 THB is forgone benefit, so it appears on no report at all. Nobody feels it while 1,069,600 THB a year quietly leaks away.
In absolute terms over-buying costs more. In terms of how long it survives unchallenged, under-specifying is the more dangerous error.
Sensitivity analysis, does the conclusion survive a weaker discrepancy assumption
The shakiest assumption above is the 1.3 point improvement in stocktake discrepancy. A warehouse that is already well disciplined will not see much movement there. So we flex that one input alone.
Cut the improvement from 1.3 points to 0.6 points, less than half. The other two items, hunting labour and mis-shipments, do not depend on that assumption, so no factor is applied to them.
| Forgone item | Per year (THB) |
|---|---|
| Reduction in stocktake discrepancy | 168,000 |
| Excess hunting and counting labour | 417,600 |
| Cost of handling mis-shipments | 288,000 |
| Annual total | 873,600 |
Over two years that is 1,747,200 THB, Scenario C really costs 5,937,200 THB, and the gap against Scenario A is 2,567,200 THB.
The conclusion does not flip. Even if you give up on discrepancy improvement almost entirely, the rework cost of an under-specified pick still exceeds 2,500,000 THB. Read the other way, the strength of this case rests on hunting labour and mis-shipments, the everyday work, rather than on stocktake accuracy.
There is a second sensitivity worth running, on the verdict itself. If the SKU count grows to 4,000 and the plant starts holding stock for two or more group companies for a fee, Variable 1 moves to 3 points and Variable 3 to 3 points, taking the total to 12. The override applies as well, so the verdict becomes Level 3, and Scenario B is no longer over-buying.
This is the point of the model. The answer changes depending on whether the future plan is decided or merely under discussion. If it is decided, a full WMS is the right investment. If it is under discussion, that 6,480,000 THB does not come back.
Three traps that distort the verdict
Trap 1, turning today’s procedures into requirements
Write down everything the warehouse does today and Variable 4 will always score high. But some of that work exists only because you have a Level 1 system. Counting goods and reconciling them against the ledger before issue, for example, exists because the record cannot be trusted. That is a symptom, not a requirement.
Trap 2, measuring against your busiest day
Score against the few peak days a year and both Variable 1 and Variable 4 spike. Score on an average month, and check first whether the peak can be absorbed with an exception process. Moving up a level purely to survive the peak is over-investment in almost every case.
Trap 3, choosing a product before deciding how movements get recorded
If you have not settled who records what, when and with which device, every product gives you the same disappointing result. That question is covered in detail in the comparison of inbound and outbound recording timing. Settle it before you score.
If you want a wider view of the system categories that handle stock at all, the four-type comparison of factory inventory management systems is the place to start.
What is different about doing this in Thailand
Design the operation around staff turnover
Warehouse staff turnover in Thailand is generally faster than in Japan. It does not appear directly in the model, but it changes how you weigh the levels. A Level 1 operation that leans on written procedures and tacit knowledge loses accuracy the day the person who knew everything resigns. A Level 2 operation where the handheld enforces the sequence holds its quality when a newcomer arrives. Low dependence on individuals is itself something worth investing in, and that argument carries more weight in Thailand than in Japan.
Whether BOI incentives apply
If software development is your business, the BOI has a category for it. On 16 September 2021 the BOI announced the repeal of the former 5.7 for software, 5.8 for e-commerce and 5.9 for digital services, consolidating them into a new category 5.10 with A2 status, which carries a capped eight-year corporate income tax exemption among other benefits. That framework is aimed at companies that develop and supply software. A manufacturing plant buying a WMS to improve its own operations is a different case. Eligibility depends on the business activity and the application category, so check it individually.
Warehouse data and personal information
Once handhelds capture work records, you hold a log of who touched which rack and when. Whether an operator-linked log of that kind falls under Thailand’s PDPA depends on the granularity of the record and the purpose of retention, and this article does not assert an answer. The competent authority is the Personal Data Protection Committee office at pdpc.or.th. What we do recommend is making how much operator-ID logging you retain an explicit decision during requirements definition. Design it so it cannot be deleted later and you have removed your own options.
The right order is score first, quote second
Do not reverse this. Collect quotations first and the proposed scope will drag your own judgement out of shape.
A workable sequence looks like this. Score the six variables internally and fix your level. Then invite proposals only from products that match that level. When you do, disclose the verdict and the numbers behind it, the SKU count, the location count and the annual shipping lines. Disclosure makes an inflated scope much harder to propose.
If the score lands near a boundary, say 10 or 11 at the top of Level 2, choose the Level 2 product but tell the vendor there is a possibility of moving to Level 3 within three years, and add ease of data migration to your selection criteria. Being near a boundary is not the problem. Keeping quiet about it is.
The 2026 MHI Annual Industry Report, titled “Rewiring the Future: A Supply Chain Playbook for Innovation” and written by MHI with Deloitte from a global survey run in late 2025, likewise treats adoption and the organisational side as the real issue rather than the technology itself. Stumbling here, the order of the steps included, is not unique to Thailand.
Frequently asked questions
What is a WMS
It is short for warehouse management system, but the label covers a very wide range in the market. In the framing used here, a system that holds stock per item, per location and per lot, and additionally issues warehouse work instructions, is a Level 3 full WMS. Some vendors also call Level 2 products a WMS, so check the granularity of the functions rather than the name.
What is the difference between a WMS and an inventory management system
There is no agreed industry line. In practice you will misunderstand less if you treat a system that records stock as an inventory management system and a system that also instructs and controls warehouse work as a WMS. When scoring, use “do we need work instructions issued” as the dividing question.
What can the ERP inventory module not do
In most cases it cannot manage rack addresses or capture physical movements on a handheld. Storage positions end up depending on people’s memory, and the gap between record and reality can only be corrected at stocktake. For a warehouse with few items and fixed positions, that is perfectly workable.
How much does a WMS cost at each level
The order of magnitude changes with the level. For the model plant here, Level 2 came to a five-year total of 3,370,000 THB and Level 3 to 10,200,000 THB. Those are one example only, and the structure of how the cost builds is in the cost breakdown article.
What is different about a WMS project in Thailand compared with Japan
The technical requirements barely change. The operation is what differs. Faster staff turnover, screens and procedures needed in more than one language, and reporting formats that must match the Japanese head office. All three surface late in requirements definition. Build them in from the start and the project looks much like one in Japan.
What should I do if my score is right on a boundary
Before rounding up, separate the variables pushing your score up into things that are true now and things that are planned. If the future plan is a decided commitment, move up a level. If it is still under discussion, take the current level and add ease of data migration to your criteria.
Summary
A WMS comparison should start with judging the level you need, not with comparing products. Score active SKU count, managed location count, owners and sites, complexity of warehouse work, traceability requirement and integration with other systems from 0 to 3 each, and map the total onto three levels. The single override is that holding stock for two or more paying clients requires a full WMS regardless of the total.
For the model plant here, getting it wrong cost 6,480,000 THB net on the over-buying side and 2,959,200 THB of rework on the under-specifying side. Even after a sensitivity analysis that halves the assumed stocktake improvement, the under-specifying rework still came to 2,567,200 THB, and the conclusion held.
And market-size charts decide nothing. A published report currently claims that Thailand alone is a bigger WMS market than the entire world. The numbers you should use are your own six.
If you are unsure about your verdict, or stuck on a boundary score, that is a fine place to start a conversation. Give us the SKU count, the location count and the annual shipping lines and we will run a first-pass verdict and explain the reasoning behind the level. For an informal discussion well before any quotation, please get in touch through our contact page. We will tell you the range that is neither over-bought nor under-specified, based on what we have seen implementing these systems in Thailand.
References
- Mobility Foresights, Thailand Warehouse Management System Market, Last Updated Sep 25, 2025, mobilityforesights.com
- MarketsandMarkets, Warehouse Management System Market worth 10.04 billion USD by 2030, 6 October 2025, prnewswire.com
- 6Wresearch, Thailand 3PL Market, published April 2025, updated June 2026, 6wresearch.com
- JLL, Thailand Industrial Market Dynamics Q1 2026, 19 May 2026, jll.com
- Tilleke and Gibbins, Thailand’s BOI Revamps Promoted Digital Activities, tilleke.com
- MHI and Deloitte, 2026 MHI Annual Industry Report, “Rewiring the Future: A Supply Chain Playbook for Innovation”, mhiblog.org
- Personal Data Protection Committee office, Thailand, pdpc.or.th


