



More engineers can now explain the difference between preventive and predictive maintenance in words, but very few factories can show, in an internal document, which of their own assets should get which method. These two approaches are not better and worse versions of the same thing. They simply belong on different equipment. What separates them is not technology, but the criticality of the asset itself. This article, written for Japanese-affiliated plants in Thailand and the wider ASEAN region, works through the structural difference between the two methods, the three places where that difference turns into money, how an equipment criticality matrix splits your assets, and how to turn all of it into a document that can actually pass an approval process.
The difference comes down to what triggers the work
There is no shortage of articles comparing maintenance strategies, but lining up definitions does not help anyone make a decision on the shop floor. The one thing that matters in practice is what signal causes people and parts to move. Because that trigger differs, the cost structure differs, the organisation required differs, and the way each method fails differs.
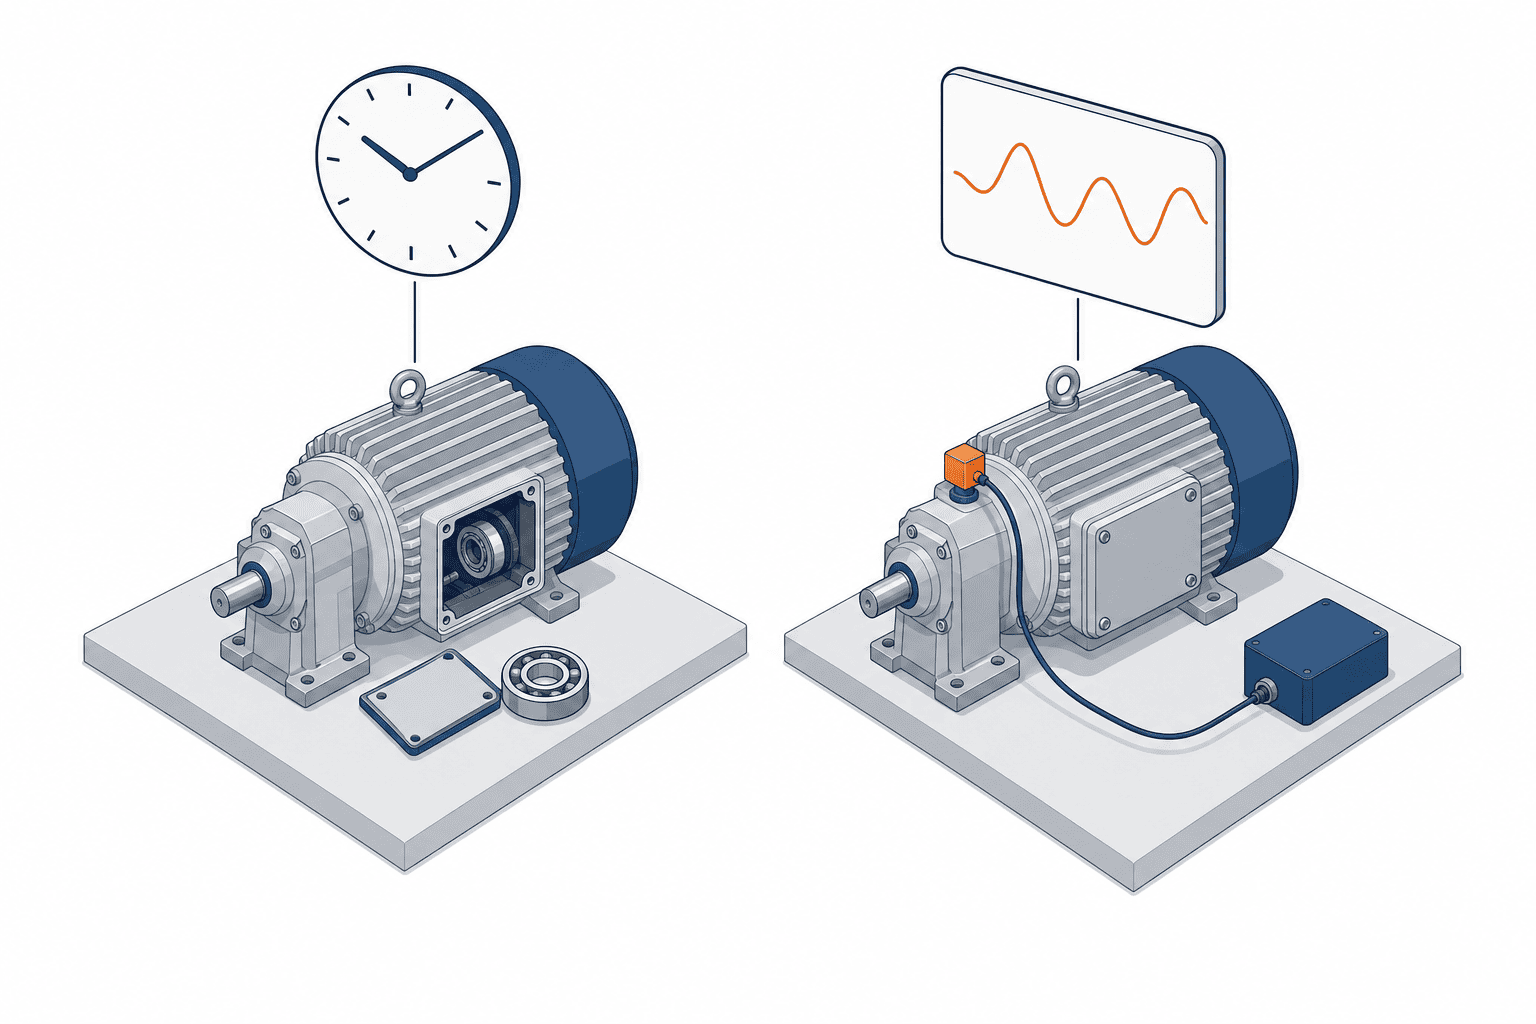
Preventive maintenance is triggered by the calendar and running hours
Preventive maintenance is also called time-based maintenance. The trigger is how long it has been since the last replacement, and the current condition of the asset is not part of the decision at all. Replacing a bearing every six months, or changing lubricating oil every 4,000 operating hours, are typical examples.
The strength of this method is that anyone can make the call. If dates and running hours are recorded in the register, even an inexperienced technician knows what comes next. Planning is straightforward and parts can be ordered ahead of time. In an environment such as a Thai site, where maintenance staff turnover tends to be high, this low dependence on individual expertise carries real value.
The weakness comes directly from the fact that condition is never observed. The method itself cannot structurally rule out the possibility that parts with plenty of life left are being thrown away. Conversely, if degradation accelerates partway through an interval, the asset fails before the next scheduled replacement date arrives. Shortening the interval reduces the second problem but increases the waste of the first. This trade-off cannot be solved by tuning the interval.
Predictive maintenance is triggered by measured values coming out of the equipment
Predictive maintenance is also called condition-based maintenance. Signs of degradation are captured from measured data such as vibration, temperature, current and sound, and the timing of maintenance is decided from there. Having no fixed inspection interval is the essence of this method. Because there is no interval, both the labour and the parts cost of replacing components that were still usable are far less likely to be incurred in the first place.
Put another way, predictive maintenance gives up on humans deciding in advance when work will happen, and lets the equipment decide instead. That looks like a technical statement, but it is really a statement about business process and authority. Who has the right to stop a machine when a threshold is exceeded, and has production agreed in advance to accept that call? In a factory where this has not been settled, sensors get installed and the alerts simply get ignored.
Predictive maintenance, condition-based maintenance and condition monitoring point at almost the same place
The terminology causes confusion, so it is worth sorting out. Predictive maintenance and condition-based maintenance are used interchangeably in most manufacturing contexts. Some practitioners argue for a strict distinction, but both terms describe the same idea of catching signs of failure and acting before it happens, and for practical purposes they can be treated as the same thing. In internal documents, it is enough to pick one term and use it consistently.
Condition monitoring is a narrower word. It refers only to the measuring and observing part, and does not extend to connecting that data to the maintenance plan. So a statement like “we already have condition monitoring in place” does not mean predictive maintenance is running. A situation where data is being collected but no maintenance decision has actually changed is extremely common.
Do not treat reactive maintenance as an outdated method
There is a third method, reactive maintenance, which means fixing things after they break. Dismissing it out of hand breaks the whole allocation logic described later in this article. For an asset that takes thirty minutes to swap, has a spare unit available, and does not affect any other process when it stops, reactive maintenance is the cheapest method available. No monitoring cost, no inspection labour, no pre-positioned spare parts inventory.
It is worth laying out the relationship between the three methods once.
| Method | Trigger | What the decision needs | Main source of waste |
|---|---|---|---|
| Reactive maintenance | Occurrence of failure | Recovery procedure and parts | The unplanned stop itself |
| Preventive maintenance | Elapsed time or running hours | Register and replacement interval | Replacing parts that were still usable |
| Predictive maintenance | Change in measured values | Sensors, thresholds, decision rules | Investment in monitoring spread too wide |
What matters in this table is that every method has its own characteristic waste. Predictive maintenance also carries waste, in the form of investment in monitoring assets that never needed it. Finding the allocation that minimises that waste is the subject of this article. For the actual build of a predictive maintenance system, including the sensor layer, collection layer and diagnostic layer and how the costs break down, see Predictive Maintenance System Implementation Guide 2026 | Cost Breakdown and How to Start Without Failing. This article stays one step earlier, on the question of which assets to target in the first place.
The difference shows up as money in only three places
The difference between methods ultimately becomes a difference in money in three places. Which also means that for any asset where those three places do not differ, the choice of method barely changes the outcome. Investment decisions should be built up from here.
First difference: are you throwing away parts that still had life left
Preventive maintenance replaces parts on an interval regardless of how far they have actually degraded. Because intervals are set conservatively, most of the parts that get replaced still have remaining life. This gap never appears on any invoice, which is precisely why it is rarely recognised as a problem internally. Almost no factory calculates what share of its annual replacement parts spend went on components that were still perfectly serviceable.
Predictive maintenance attacks this directly. Because nothing is replaced until measured values show degradation progressing, the usable life of each part is consumed to the end. That said, this effect only becomes meaningful in money terms on assets where the unit cost of parts is high. Using a filter worth a few hundred baht down to the last day will never pay back the investment in monitoring it.
Second difference: is the stoppage planned or unplanned
This is where the order of magnitude of the money moves the most. The cost of unplanned downtime is put at roughly USD 260,000 per hour as a cross-industry average, and automotive production lines have been reported at over USD 2.3 million per hour (sources are listed in the references at the end of this article). The same two-hour stop produces almost zero incremental loss if it is taken as a planned Saturday shutdown, and can run into hundreds of thousands of dollars if it happens as a sudden failure on a weekday afternoon.
The core of the value of predictive maintenance is therefore not saving on parts, but moving stoppages from the unplanned column to the planned column. Reported figures put the reduction in unplanned downtime from adopting predictive maintenance at 30 to 50 percent, and the reduction in maintenance cost compared with reactive maintenance at 18 to 25 percent. On return on investment, McKinsey research has been cited as showing ratios of 10 to 1 through 30 to 1 within 12 to 18 months of implementation, with 95 percent of implementing companies reporting a positive return.
The caution here is that these numbers cannot be carried straight into your own investment case. Making the same investment on an asset whose stoppage has no consequence will not reproduce those ratios. What determines the size of the effect is not the sophistication of the method, but the size of the expected loss on the asset you chose to target.
For how downtime feeds into productivity metrics, the calculation framework is covered in OEE Improvement 2026 | Overall Equipment Effectiveness Stalls Because the Measurement Is Loose. If you need to decide what denominator to use for availability when calculating downtime loss, start there.
Third difference: where maintenance labour is pointed
Under preventive maintenance, a substantial share of maintenance labour goes into inspecting and replacing parts on assets that had nothing wrong with them. Checklists that grow item by item each year, until walking through every line on the sheet consumes an entire day, are a familiar sight in many factories. That labour produces only one conclusion, which is that nothing was wrong.
Shift to predictive maintenance and the same labour concentrates on assets where an anomaly has actually been indicated. Total labour hours do not necessarily fall, and in the early phase they usually rise because of baseline capture and threshold tuning. What changes is the allocation of that labour. But even this effect never reaches the books unless maintenance staff are genuinely reassigned.
Use an equipment criticality matrix to decide which method applies
This is the core of the article. Selecting a method for each asset should be done mechanically with a two-axis matrix, not by the feel of whoever happens to own the equipment. The main reason for working this way is to make approvals easier. If you can say “this asset falls in this quadrant under this criterion” instead of “we think it is important”, the investment decision moves forward.
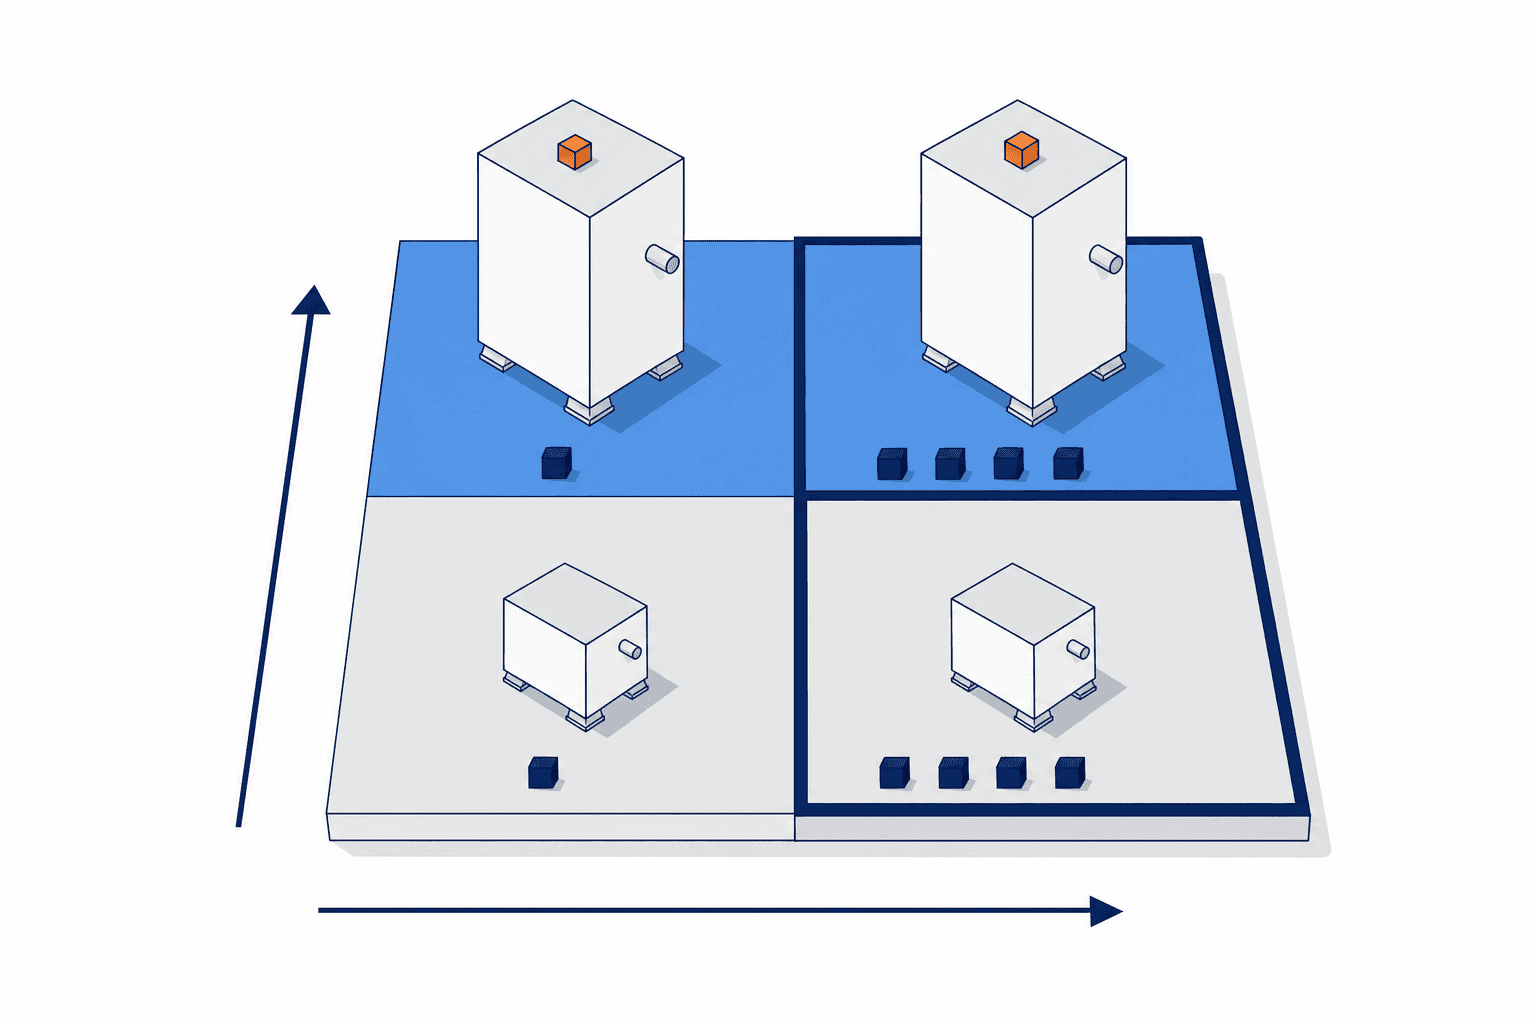
The vertical axis is failure impact, the horizontal axis is failure frequency
An equipment criticality matrix evaluates assets on two axes, failure impact and failure frequency. The reason for choosing these two is straightforward, because expected loss is determined by loss per occurrence multiplied by number of occurrences. However, you must not multiply the two together into a single score. Expected loss is indeed a product of the two, but whether monitoring investment can be justified is determined by the size of the loss per single occurrence alone. Multiply them and an asset with extreme impact and very low frequency sinks to a low score, while an asset with small impact and nothing but high frequency floats to the top. Keeping the two axes separate is the point.
Failure impact is decided by what happens when that asset stops. Draw the lines as follows. An asset that halts production, or that pushes operating cost up by 20 percent or more, has high impact. An asset whose effect stays within part of the process and whose cost increase falls in the range of 10 to 20 percent is medium. If work can be routed around it and the cost increase stays under 10 percent, impact is low. Any asset tied directly to safety, legal compliance or the environment should be placed at high impact regardless of the money involved.
Failure frequency is decided from actual failure history. Pull it from maintenance records, not from memory. A two-level split is sufficient, with a record of at least one failure per year counting as high and once every several years counting as low. Slicing it more finely does not change the decision. If no records surface at this point, that absence is itself the problem to solve first.
Assigning a method to each of the four quadrants
Simplifying each axis into a binary high and low produces four quadrants. How to handle assets with medium impact is covered separately in the next section. The assignment works out as follows.
| Quadrant | Failure impact | Failure frequency | Method to apply | Rationale |
|---|---|---|---|---|
| Quadrant 1 | High | High | Predictive maintenance (top priority) | Expected loss is largest and payback is shortest |
| Quadrant 2 | High | Low | Predictive maintenance | Loss per occurrence is large, and low frequency is no excuse |
| Quadrant 3 | Low | High | Preventive maintenance | Interval optimisation is enough, monitoring will not pay back |
| Quadrant 4 | Low | Low | Reactive maintenance or simple preventive maintenance | Both monitoring and scheduled replacement are over-investment |
The quadrant most often misread in this assignment is Quadrant 2. Low-frequency assets tend to get dropped from scope on the grounds that they have not broken yet, but the principle is that high-criticality assets belong in predictive maintenance scope regardless of frequency. An asset that fails only once in five years, but takes the line down for three days when it does, is generating a loss that, averaged out per year, should be booked as an annual cost. And that one failure cannot be absorbed by a spare unit or by parts inventory.
Not putting Quadrant 3 on predictive maintenance matters just as much in the other direction. High-frequency assets are visible, so the shop floor is quick to ask for something to be done about them. But if impact is low, the loss per occurrence never reaches the size of the monitoring investment, and it will not pay back. This quadrant responds far better to a review of preventive maintenance intervals.
The judgement splits in the medium impact band
Real assets do not divide neatly into high and low. Where the judgement splits is the band with medium impact and a cost increase in the 10 to 20 percent range. Assets in this band can become predictive maintenance targets depending on circumstances.
Three additional lenses help split this band. The first is whether an alternative exists, meaning whether there is a spare unit or whether work can be transferred to another line. If transfer is possible, preventive maintenance is usually enough. The second is recovery time, since expected loss changes dramatically depending on whether parts are held locally and recovery takes two hours, or whether procurement from Japan takes three weeks. The third is how visible the degradation is, meaning whether this is rotating machinery where vibration and temperature carry clear signs, or an electronic component that gives almost no warning. Monitoring an asset that produces no precursor signal will not detect anything.
Filling in the matrix requires a maintained equipment register
This matrix cannot be filled in without an equipment register. It assumes a state where failure history can be pulled per asset, meaning that who replaced what and when is linked to an equipment code. How finely to break down the register, and which routes should be used to raise a failure record, are covered in How to Choose an Equipment Maintenance System 2026 | Register Granularity and Three Routes for Raising Work. For a factory that cannot fill in the matrix, clearing that groundwork first will get you further, faster, than studying predictive maintenance.
The 2026 practical standard is hybrid operation, not one or the other
Designing method selection as a migration from preventive to predictive maintenance almost always stalls. The standard thinking as of 2026 is a hybrid configuration, with predictive maintenance assigned to critical assets, preventive maintenance assigned to routine low-risk assets, and both running in parallel.
Putting every asset on predictive maintenance does not work
The first reason is cost effectiveness. Sensors, communications, collection infrastructure and threshold-setting labour all scale with the number of assets, while the benefit scales with expected loss. The more low-expected-loss assets you add to scope, the lower the overall return becomes. The ratios of 10 to 1 through 30 to 1 mentioned earlier cannot be used as the basis for a plant-wide rollout.
The second reason is alert operation. Widening the monitored scope increases the number of alerts requiring a judgement. The moment that exceeds the processing capacity of the maintenance department, alerts start getting ignored. Once that happens, even alerts from critical assets lose credibility, and the entire investment is wasted.
Assets left on preventive maintenance still have work to do
Do not read assets left in preventive maintenance scope as assets that can be neglected. The work to do in this layer is reviewing the intervals. In many factories, replacement intervals still sit at the manufacturer recommendation from the day the equipment was installed and have never been updated. Cross-check actual failure history against the condition of removed parts and you will find parts whose intervals can be extended and parts whose intervals should be shortened. This review cuts parts cost with zero sensor investment.
The scope of what maintenance DX means also covers this. Digital transformation in equipment maintenance is not only the act of fitting new sensors; it equally includes reaching a state where existing replacement intervals are continuously updated from actual results. And interval review is impossible unless there is a record of which part on which asset was replaced when, and what condition that part was in at the time. In most cases, the first place investment pays off is on the record-keeping side.
Operating design when the two are mixed
Adopting a hybrid configuration means the maintenance department ends up with two routes for raising work. The preventive side generates planned tasks automatically from a calendar, while the predictive side generates ad hoc tasks from threshold breaches. Managing these two in separate systems forces the shop floor to watch two screens, and one of them stops being used.
Put both on the same work-order framework and distinguish only the origin of the request. In the monthly maintenance meeting, look at both the completion rate of planned tasks and the number of threshold breaches that actually led to an intervention. If the latter is extremely low, the thresholds are too loose, and if it is too high, they are too tight.
Applying the framework by equipment type
The matrix is a decision framework, but real assets carry another constraint, which is how visible the degradation is. Even at high impact, an asset whose precursor signals cannot be measured does not become a predictive maintenance target. Here is how it breaks down by equipment type.
Rotating machinery is where predictive maintenance works most readily
Rotating machinery such as motors, pumps, fans and compressors shows degradation clearly in vibration and temperature. The techniques are established, there are plenty of sensor options, and there are published references for judgement criteria.
If rotating machinery sits in Quadrant 1 or Quadrant 2, that is where you start. That said, there is a boundary between what vibration can and cannot reveal. On low-speed machines and intermittently operated machines, the measurement method itself has to change. That boundary is mapped out in Vibration Sensor Equipment Diagnostics 2026 | The Boundary Between Faults You Can Measure and Faults You Cannot.
Heat exchangers and chillers need combined monitoring
Degradation in heat exchangers and chillers does not appear in any single measured quantity. It is captured as a decline in heat exchange efficiency by combining inlet and outlet temperature difference, flow rate and power consumption. More measurement points mean higher initial investment, and the design also has to treat seasonal variation in ambient conditions as normal variation. These assets qualify when impact is high, but the difficulty is a step above rotating machinery.
Hydraulic and pneumatic systems are mostly about leak detection
Hydraulic power units and pneumatic piping are assessed through pressure-holding performance and power consumption. Because air leaks feed directly into the electricity bill, energy cost should be booked alongside downtime loss when evaluating impact. This area carries a practical advantage, in that investment is often easier to approve as an energy-saving measure than as predictive maintenance.
For electrical equipment and control panels, temperature monitoring is as far as it goes

In control panels, distribution boards and transformers, loose terminals and poor contact show up as heat. This can be captured with periodic thermographic measurement or with fixed temperature sensors. On the other hand, failures of control boards and electronic components give almost no advance warning. The realistic response for that portion is securing spare parts and preparing replacement procedures, in other words making reactive maintenance faster.
Dies, jigs and consumable parts suit shot-count management
For items such as dies and cutting tools, where the correlation between usage count and wear is clear, preventive maintenance based on shot count or piece count rather than time is the best fit. This is a different thing from calendar-based preventive maintenance and is effectively usage-based management. Connecting production count data to the maintenance plan is cheaper and more reliable than fitting sensors.
Laying out the tendency by equipment type gives the following.
| Equipment type | Visibility of degradation | First-choice method | Notes |
|---|---|---|---|
| Rotating machinery (motors, pumps, fans) | High | Predictive maintenance | Vibration and temperature separate the cases |
| Heat exchangers and chillers | Medium | Predictive maintenance (when impact is high) | Needs a combination of several measurement points |
| Hydraulic and pneumatic systems | Medium | Predictive maintenance | Add the energy saving to the impact figure |
| Electrical equipment and control panels | Low (heat only) | Preventive maintenance plus temperature monitoring | Handle electronic parts through spares |
| Dies, jigs and consumable parts | Correlates with usage | Usage-based preventive maintenance | Connect the production count |
This table indicates a first choice, and does not override the quadrant assignment from the matrix. Do not put a low-impact rotating machine in scope purely because it is easy to measure.
Four conditions that distort the judgement at Thailand and ASEAN sites
Everything above applies to a factory in any country. At sites in Thailand and across ASEAN, however, a set of local conditions is added that bends the judgement. In our experience on the ground, these organisational conditions decide the success or failure of an implementation far more often than technical difficulty does.
Nobody has calculated the hourly cost of downtime
This is the most common situation of all. Filling in the vertical axis of the matrix requires a downtime cost figure per asset. Yet no department actually holds that number. Production engineering knows the volumes but not the unit economics, and finance holds the cost data but has never broken it down to the asset level. The result is that impact assessment gets replaced by a feeling that something is probably important.
The fix is simple, which is to calculate it once, roughly. Multiply the hourly production quantity of the line by the contribution margin per unit. Add idle labour cost during the stoppage and the losses from restarting. Having a number that is right to the correct order of magnitude, early, matters more than stalling in pursuit of precision. The moment that number exists, the investment discussion moves forward.
The department leading the PoC is not the department that will operate it
The other classic pattern is production engineering leading a proof of concept while the maintenance department that will actually operate the system is not involved during planning. In this case the PoC succeeds technically. The sensors return values, the graphs get drawn, the report gets written. But the moment it moves to production operation, for the maintenance department receiving the alerts it becomes work that landed on them from somewhere else.
This pattern also occurs on projects led from Japanese headquarters, but the impact is larger at overseas sites, because headcount is thin and there is no slack to absorb extra work. The countermeasure is to involve the maintenance department from the asset selection stage. Filling in the matrix together with maintenance lets you use their knowledge of failure history, and creates ownership at the same time.
Parts lead times are different from Japan
Impact assessment includes recovery time. For a part that can be sourced within Thailand versus a part that has to be brought in from Japan or Germany, the same failure produces downtime of a completely different order of magnitude. Importing a criticality assessment built by headquarters in Japan without adjustment fails to reflect this gap.
In practice, before filling in the matrix, check local sourcing availability for the key parts of your key assets. Any asset that depends solely on imported parts moves up one level in impact. That same check also feeds directly into a review of your spare parts inventory policy.
Maintenance skill level and staff retention
Until thresholds are properly bedded into operation, predictive maintenance needs people who can make a judgement, meaning someone who can look at the values a sensor returns and decide whether this needs action or continued observation. If the site has nobody who can make that call, the implementation plan needs to build in either a training period or external decision support.
Seen from the other side, preventive maintenance requires no judgement, which makes it a rational choice at a site with concerns about skill retention. This consideration drops out entirely when a standard built by headquarters in Japan is applied as-is. Method selection should be decided from the conditions of the organisation that will operate it, not from the conditions of the equipment alone.
Four steps to turn the criteria into an internal document
Finally, here is how to turn everything above into a document that can pass an approval process. Put into this form, investment decisions stop depending on the presentation skills of one individual.
Give the equipment register two-axis scores
Add two columns to the equipment register, failure impact and failure frequency. Use the binary values high and low, mark borderline assets as medium, and write one line of reasoning in the remarks field. You do not need to fill in every asset at once. Starting with the assets on your main line is fine. Make sure the maintenance department is part of this work.
Calculate downtime cost on an hourly basis
Calculate downtime cost per hour, per asset or per line. As noted above, the correct order of magnitude is sufficient. This number serves as the evidence behind the impact rating and, later, as the numerator in the payback calculation. Always record the assumptions alongside it, meaning production quantity, contribution margin, exchange rate used and the date of calculation. A number with no stated assumptions becomes unusable to everyone six months later.
Document the method for each quadrant as a rule
Write the method to be applied to each of the four quadrants as a formal rule, with wording such as “assets with high failure impact shall be placed under condition monitoring regardless of failure frequency”. The purpose is to make the outcome follow automatically from the rule, instead of debating the merits of each individual asset every time. If exceptions are permitted, state who approves them.
Set a review cycle
Failure frequency changes with actual results, and impact changes when the product mix changes. Establish a practice of reviewing the matrix once a year, or whenever there is a significant change to the production plan. Use that same review to cross-check preventive maintenance intervals against actual results. Only once you have gone this far does maintenance DX start working as a system rather than a project.
Frequently asked questions
Which is better, predictive maintenance or preventive maintenance
Neither method is superior. They simply apply to different equipment. On assets with high failure impact, predictive maintenance substantially reduces expected loss, while on assets with low impact and high failure frequency, preventive maintenance has the lower total cost. Putting every asset on predictive maintenance produces assets where the monitoring investment exceeds the expected loss, dragging down the overall return. The practical standard as of 2026 is hybrid operation, using both and choosing per asset.
Are condition-based maintenance and predictive maintenance the same thing
In practice they are used to mean almost the same thing. Both refer to the idea of capturing signs of degradation from measured data coming out of the equipment and intervening before failure occurs. Condition monitoring is a narrower term that covers only the measuring side and stops short of the maintenance plan. Some practitioners argue for a strict distinction between all three, but the thing that actually causes trouble in internal documents is mixing the terms. Standardise on one name for the method itself.
Should we switch completely from preventive to predictive maintenance
Design it as an addition, not a replacement. Apply predictive maintenance in order starting from Quadrant 1 and Quadrant 2 of the equipment criticality matrix, meaning assets with high failure impact, and leave Quadrant 3 and Quadrant 4 on preventive or reactive maintenance. Plan a full migration and the investment becomes too large to get approved, and if it does get approved, the alert volume exceeds what the maintenance department can process.
Is maintenance DX the same as implementing predictive maintenance
Not the same. Maintenance DX covers a broader scope, including maintaining the equipment register, accumulating failure history, reviewing replacement intervals from actual results, and digitising work orders. Predictive maintenance is one stage that sits on top of that. If sensors are installed without a register and history in place, threshold validity cannot be verified against past failures, so the decision criteria never settle. Fix the foundation first.
Can predictive maintenance work at a small factory
It is decided by hourly downtime cost, not by the number of assets. Even with only twenty assets, if one of them stops the whole line and the hourly loss is large, investment targeting that one asset is justified. Conversely, even with two hundred assets, if all of them can be worked around and impact is low, no predictive maintenance target emerges. The decision always returns to the matrix.
Conclusion
The difference between preventive and predictive maintenance comes down to one thing, which is whether the trigger is the calendar or a measured value. That difference turns into money in three places, namely whether parts with life left are being thrown away, whether stoppages are planned or unplanned, and where maintenance labour is pointed.
Which method applies is decided by an equipment criticality matrix built on the two axes of failure impact and failure frequency. Assets with high impact go into predictive maintenance scope regardless of failure frequency, assets with low impact and high frequency are handled by reviewing preventive maintenance intervals, and assets low on both axes are fine on reactive maintenance. The borderline middle band is split using availability of alternatives, recovery time, and how visible the degradation is.
And the practical standard for 2026 is hybrid operation, not full migration. Give the equipment register two-axis scores, calculate downtime cost on an hourly basis, document the method for each quadrant as a rule, and set a review cycle. Get through those four steps and method selection changes from an individual judgement into an organisational system.
We often hear from companies at the stage where they have tried applying this matrix to their own equipment but cannot produce the downtime cost figure the impact rating needs, or where opinions internally are split on how to handle the assets that fall into Quadrant 2. TOMAS TECH supports Japanese-affiliated manufacturers in Thailand and ASEAN, from taking stock of the current state of equipment maintenance through to sorting out which assets belong in scope. You are welcome to get in touch even at an early consideration stage before anything has been decided, through our contact form. We are happy to look at your equipment list together and work out where to start.
References
- Predictive Maintenance ROI for North American Manufacturers 2026 – TEEPTRAK
- Learn All About the Matrix of Criticality – TRACTIAN
- AI Predictive Maintenance 2026 – IIoT World
- Predictive Maintenance System Implementation Guide 2026 – TOMAS TECH
- How to Choose an Equipment Maintenance System 2026 – TOMAS TECH
- Vibration Sensor Equipment Diagnostics 2026 – TOMAS TECH
- OEE Improvement 2026 – TOMAS TECH


