


Automation risk and failure rarely trace back to a robot or an AI model that was not powerful enough. Productivity that has not moved three months after go-live, a payback case nobody can defend, equipment that the shop floor quietly stops using — these outcomes almost always start with the decision criteria applied before the contract was signed and the boundary drawn against existing systems. Using published primary data, this article breaks down the three structures behind why automation projects fail, and how plants in Thailand and ASEAN can avoid them.
Automation risk and failure are structural, not technical
Automation failure rates are reported at levels well above what most management teams assume. An August 2026 report citing McKinsey research puts the numbers as follows.
| Automation target | Reported failure rate |
|---|---|
| General business process automation | 30-50% fail |
| Automating an existing broken process as-is | 73% fail |
| AI automation projects | 85% fail |
| Network automation | 82% partially or completely fail |
| Aftermath of failure | 68% of projects cancelled within 18 months |
The number that deserves attention is the gap between the 30-50% baseline and the jump to 73% when a broken process is automated as-is. Same tool, same vendor, same budget — and the outcome splits in two depending on whether the underlying work was cleaned up first. That is not a technology problem. It is a design problem that exists before anyone places an order.
The second number, 68% of failed projects cancelled within 18 months, says that failure rarely ends in a fix-and-relaunch. It ends in a quiet retreat. The equipment stays on the floor, depreciation keeps running, and the only thing left in the shop floor’s memory is a precedent that automation did not work here. Once you count the secondary damage — the next automation proposal becoming harder to approve internally — the real loss exceeds the invested amount.
The same pattern shows up in factory automation. A US manufacturing publication reported on a plant where productivity was still flat three months after deploying AMRs (autonomous mobile robots). When the cause was traced, the robots were not the problem. The legacy MES was issuing work instructions on a 90-second batch cycle, while the AMRs were engineered to respond in milliseconds. The fleet spent its time idle, waiting for a valid instruction to arrive. The publication notes that this pattern is spreading quietly across a US manufacturing sector absorbing roughly 7 trillion dollars of investment.
Buy a high-performance robot, feed it an instruction once every 90 seconds, and that performance exists only on the balance sheet. The three sections below take apart the structural causes that produce this kind of failure.
Structural cause 1 | Oversimplified ROI models distort automation payback
The one-line formula of equipment cost divided by labour saved
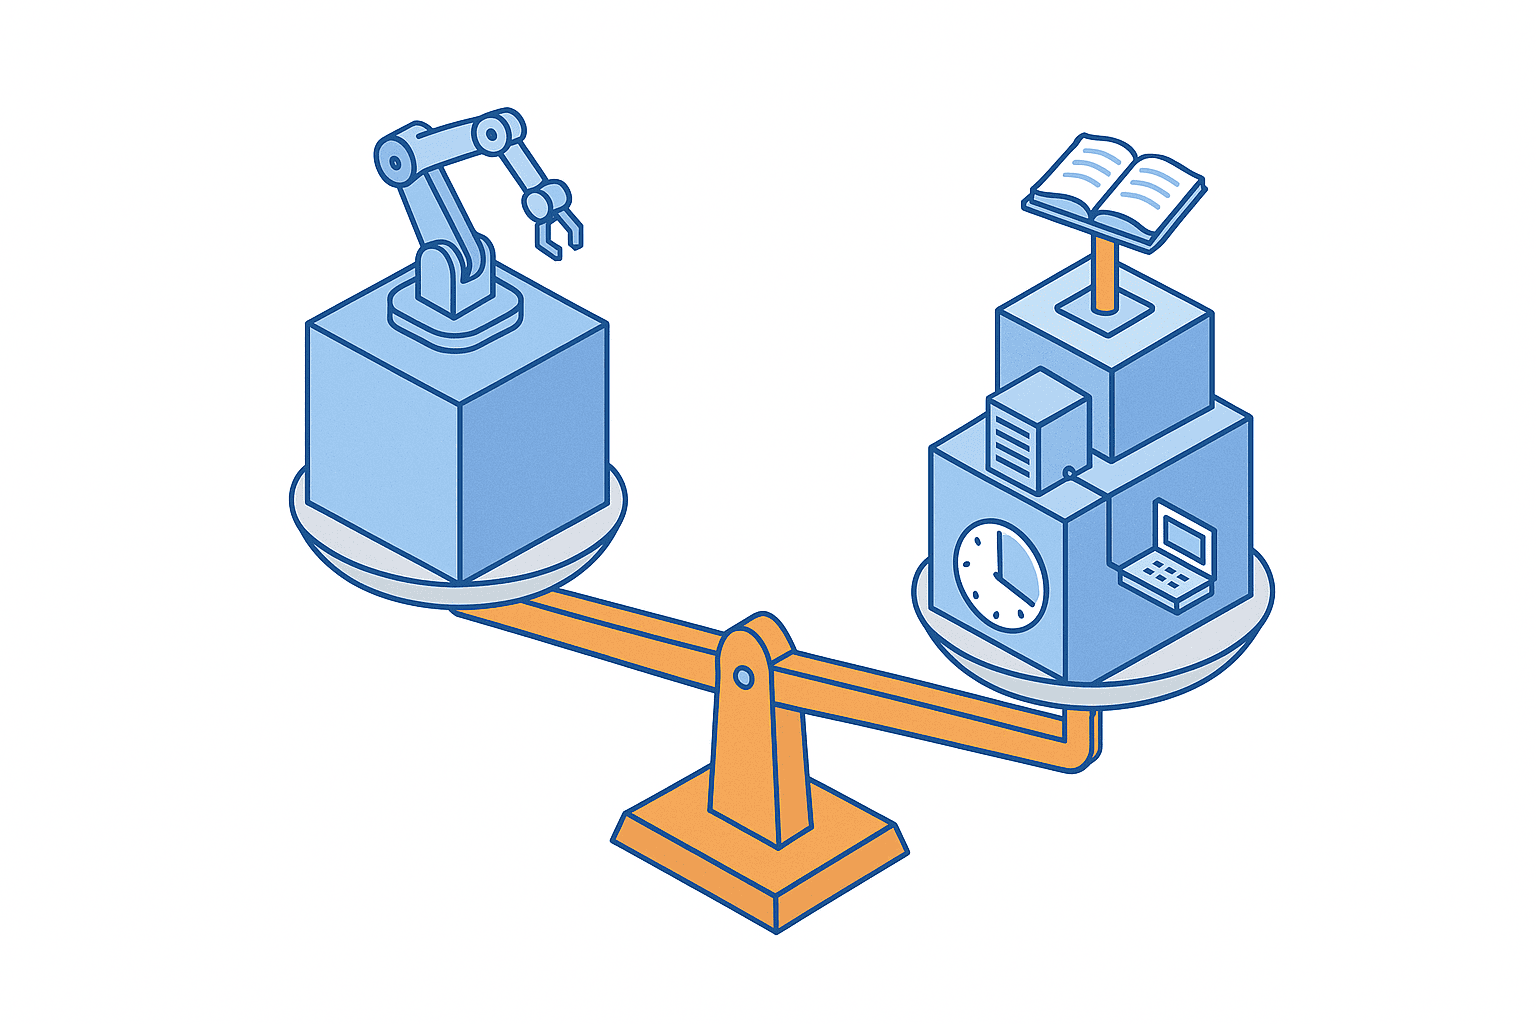
The calculation that appears most often in automation approval documents fits on a single line. Take the equipment cost, divide it by the annual labour cost removed, and report the payback period. It is easy to read and easy to approve. The problem is that the formula misstates both the numerator and the denominator.
The numerator typically covers the robot, the end effector, the base frame and the safety fencing — but frequently excludes interface development against existing systems, power, air and network installation, the temporary production stoppage caused by layout changes, and the cost of running old and new in parallel during ramp-up. The denominator is usually calculated as the headcount standing at that process multiplied by labour cost, yet people remain after automation for changeover, fault recovery and quality checks. Labour saving is rarely all or nothing. Most often it looks like two operators becoming one.
Utilisation is the largest single variable
What moves the payback period most is neither unit price nor labour cost. It is utilisation. The units-per-day figure derived from theoretical cycle time shrinks considerably once changeover, material waiting, upstream stoppages and maintenance windows are subtracted. A plan built on 85% theoretical utilisation that pays back in two years stretches to nearly three years if the line actually delivers 60%. One wrong utilisation assumption is enough to flip the investment conclusion.
The AMR case above is exactly the situation where utilisation is set by another system’s constraints rather than by your own equipment. However strong the catalogue specification of a robot may be, if the supply of instructions is the rate-limiting step, effective utilisation is capped there. Utilisation is not a number fixed at purchase. It is a number fixed by the design of everything around the machine.
Integration and training costs never appear on the quotation
Automation quotations usually scope hardware and installation. Getting to a running operation generates a further set of costs.
- Interface development against the existing production management system or MES, plus the meeting hours needed to align the specification
- Cleaning up part number, process and location master data, and taking stock of existing records
- Operator training, abnormality response drills, and revising and translating standard work instructions
- Early-life fault handling and the parameter tuning period after go-live
- Spare parts inventory, a planned preventive maintenance schedule, and skills development for in-house maintenance staff
These items fall out of the ROI discussion easily, yet together they can add up to several tens of percent of the equipment cost. The paradox is that the costs missing from the quotation are the ones that determine the payback period. The method for building up a full capital investment picture is covered in our article on how to structure a factory capital investment plan.
The assumptions move, so a single-year formula is not enough
A further complication is that the assumptions behind the payback calculation change every year. Thailand’s minimum wage has been raised in stages from 300 baht in 2013 to 363 baht in Bangkok in 2024, 372 baht in January 2025, and 400 baht from July 2025 across all of Bangkok and for hotels and entertainment venues. JETRO survey data puts annual wage growth at 3.8% in 2023, 4.58% in 2024 and a projected 4.64% in 2025 — a sustained level in the 4% range.
In other words, the labour cost saving calculated at evaluation time is not a fixed figure. It grows by several percent each year. Read the other way, calculating payback from a single year of labour cost understates the value of automation. Oversimplified ROI models can make an investment look better than it is, and also worse than it is.
Market data on payback is not pessimistic at all. The collaborative robot market stands at 11.3 billion dollars in 2026, growing at 28% annually, with 210,000 units shipped over the trailing four quarters. Reports on that market place the payback period for collaborative robots at 6 to 12 months. Whether that level materialises in practice depends entirely on utilisation and integration design. For a breakdown of costs and the implementation sequence, see our article on collaborative robot implementation costs and steps.
Structural cause 2 | System boundary mismatches breed FA implementation failure

Mismatched response times
The AMR and legacy MES case is a textbook boundary mismatch. Connect two systems whose time constants differ by three orders of magnitude — a 90-second batch cycle against millisecond responsiveness — and the faster side will always wait. Worse, that waiting time never appears as an alarm on the AMR management screen. The robot is fully operable. It simply has no instruction.
What the shop floor sees is more and more time in which the robots are not moving, while no alarm screen turns red anywhere. Diagnosis is hard precisely because both systems are behaving to specification. When the boundary was never designed, accountability is equally undefined. The robot vendor says the equipment is waiting for instructions; the systems vendor says the batch cycle is the existing specification. Neither is wrong, which is why the situation is left alone.
Mismatched data granularity and identifiers
Time constants are not the only source of boundary trouble. Data granularity produces the same effect. The production management system holds inventory by lot, the AMR fleet manages transport by rack or container, and the robot cell processes individual pieces. Without a defined conversion rule linking those three levels of granularity, nobody can answer which piece from which lot is sitting on which rack right now.
Identifier design behaves the same way. When the existing part number scheme mixes in suffixes and provisional numbers, an automated system cannot handle the exception and stops. A human reads a provisional number and infers it came from the upstream process; an automated system has no basis for that inference. The reality behind the statistic that automating an existing broken process as-is pushes the failure rate to 73% is, in most cases, exactly this kind of foundational data inconsistency.
Who takes on exception handling
The most labour-intensive part of automation design is not the normal path. It is the abnormal one. What happens when the destination location is full, when a workpiece arrives in an unexpected orientation, when the upstream process stops and instructions dry up. How far these cases are handled automatically and where they are handed to a person determines utilisation directly.
Deploy with that line left vague and a person is called every time something deviates, recovery procedures become tribal knowledge, and eventually the floor concludes it is faster to do the job by hand than to keep being called. Most robot implementation failures begin not with a breakdown but with the absence of an operational design for abnormal conditions. The prerequisites to settle before deploying material handling are covered in how to approach AGV and AMR deployment and costs.
The numbers only appear once the systems are integrated
The upside of getting the boundary right is clear. AMR market reports size the market at 3.4 billion dollars, growing 19.5% annually toward 17 billion dollars by 2035, and cite deployment benefits of up to 40% shorter order-to-shipment cycle time and a 30-50% reduction in material handling headcount. Given the AMR and legacy MES case above, it is reasonable to read those figures as achievable only where the equipment is properly integrated with plant infrastructure and systems.
Install the same model in two plants, and the one that designed the integration sees the 40% improvement while the one that did not is still flat after three months. Automation results are decided less by equipment selection than by the quality of the line drawn between the equipment and the systems already in place.
Structural cause 3 | Weak change management and shop-floor adoption surface last
The distance between working and being used
Operating to specification at acceptance and holding the same utilisation six months later are two different things. Automated equipment degrades gradually as the conditions around it change. A new product is added, workpiece tolerances shift, changeover procedure is revised, the layout moves slightly. If nobody inside the plant can adjust parameters each time, the equipment slowly becomes the awkward machine nobody wants to run.
The finding that 68% of failed projects are cancelled within 18 months matches this timeline exactly. Eighteen months is roughly how long it takes for the initial enthusiasm to cool, for the responsible engineer to be reassigned, and for the surrounding conditions to turn over once. The dividing line for adoption is not the first month or two after go-live. It is how the following year and a half is designed.
Adoption risks specific to Thai plants
At Japanese-owned plants across ASEAN, change management is harder still. Where the workforce depends heavily on migrant labour, the people you trained do not necessarily stay. You may prepare standard work instructions in Japanese and Thai, but if the actual operators are Myanmar-language speakers, procedures passed on verbally will drift with each generation of staff.
In that environment, adoption requires training to be built into the design of the work itself rather than delivered as a course for people. Make the operating screens icon-driven. Make incorrect operation physically impossible. Post a single photo-based recovery sheet for abnormal conditions at the machine. This unglamorous detail work is what stops training costs from recurring indefinitely.
Drawing the line between in-house maintenance and the vendor
The second condition for adoption is maintenance. Robot teaching corrections, vision re-calibration, consumable replacement, simple parameter changes. Route every one of these to the vendor and the waiting time becomes downtime, with the cost stacking up alongside it. Try to bring everything in-house and the training load becomes unrealistic.
In practice what works is writing down, at contract stage before deployment, which tasks stay in-house and which go to the vendor. How much source code and documentation is handed over, who owns the teaching data, what the guaranteed response time is in an emergency. The presence or absence of these terms shapes utilisation from year three onward more than almost anything else. Our view on selecting a partner is set out in how to choose a robot system integrator.
Who is authorised to call a stop
The decision route for withdrawal or scope change is surprisingly often left undesigned. When the expected benefit is not appearing, who judges that, against which indicator, and by when. Without that mechanism a project is never declared either a success or a failure. It is simply left running until the budget disappears 18 months later. Fixing the timing and criteria for that judgement before deployment is not there to prevent failure. It is there to confirm failure early and keep it small.
Three conditions facing plants in Thailand and ASEAN
Condition 1 | Labour costs are only heading up
The trajectory of Thailand’s minimum wage feeds directly into automation investment decisions.
| Point in time | Bangkok minimum wage level |
|---|---|
| 2013 | 300 baht per day |
| 2024 | 363 baht per day |
| January 2025 | 372 baht per day |
| July 2025 | 400 baht per day (all of Bangkok, plus hotels and entertainment venues) |
The Pheu Thai Party has also pledged to raise the figure to 600 baht per day by 2027 — an increase of roughly 61% over the January 2025 level of 372 baht, or 50% over the July 2025 level of 400 baht. Whether that pledge is delivered as stated is a separate question, but it is prudent to build investment plans on the premise that no scenario points to wages falling. If growth continues in the 4% range, labour cost in five years will be roughly 1.2 times today’s level.
Condition 2 | Confirm the BOI conditions you can actually use, first
Heading into 2026, Thailand’s BOI is shifting its emphasis from granting investment privileges to accelerating project delivery. Incentives for smart and sustainable industry come with a minimum investment of 1 million baht and a three-year corporate income tax exemption. The condition that matters is the exemption cap. The cap is normally 50% of the qualifying investment, but it rises to 100% only where domestically manufactured automation and robotics machinery accounts for 30% or more of the investment.
That condition feeds straight into equipment selection. Do you specify the latest imported models throughout, or secure a set proportion of domestically manufactured content to maximise the incentive? Check the incentive after the specification is frozen and re-selection is effectively impossible. Verifying incentive requirements is a step that belongs before equipment selection, not after it.
Condition 3 | Investment around you is accelerating
Thailand’s investment applications for the first half of 2026 reached 43.6 billion dollars across 1,299 cases, up 37% year on year. Within that, the BOI’s Smart and Sustainable Industry measures drew 132 applications worth 507.6 million dollars, covering machinery upgrades, energy saving, digital technology adoption, and automation and robotics deployment.
What those figures mean is that inside the same industrial estate, your competitors are moving in the same direction. That is not a reason to rush a deployment. It is a reason to note that the cost of deferring the decision rises every year.
Avoiding failure | An automation rollout roadmap in four stages
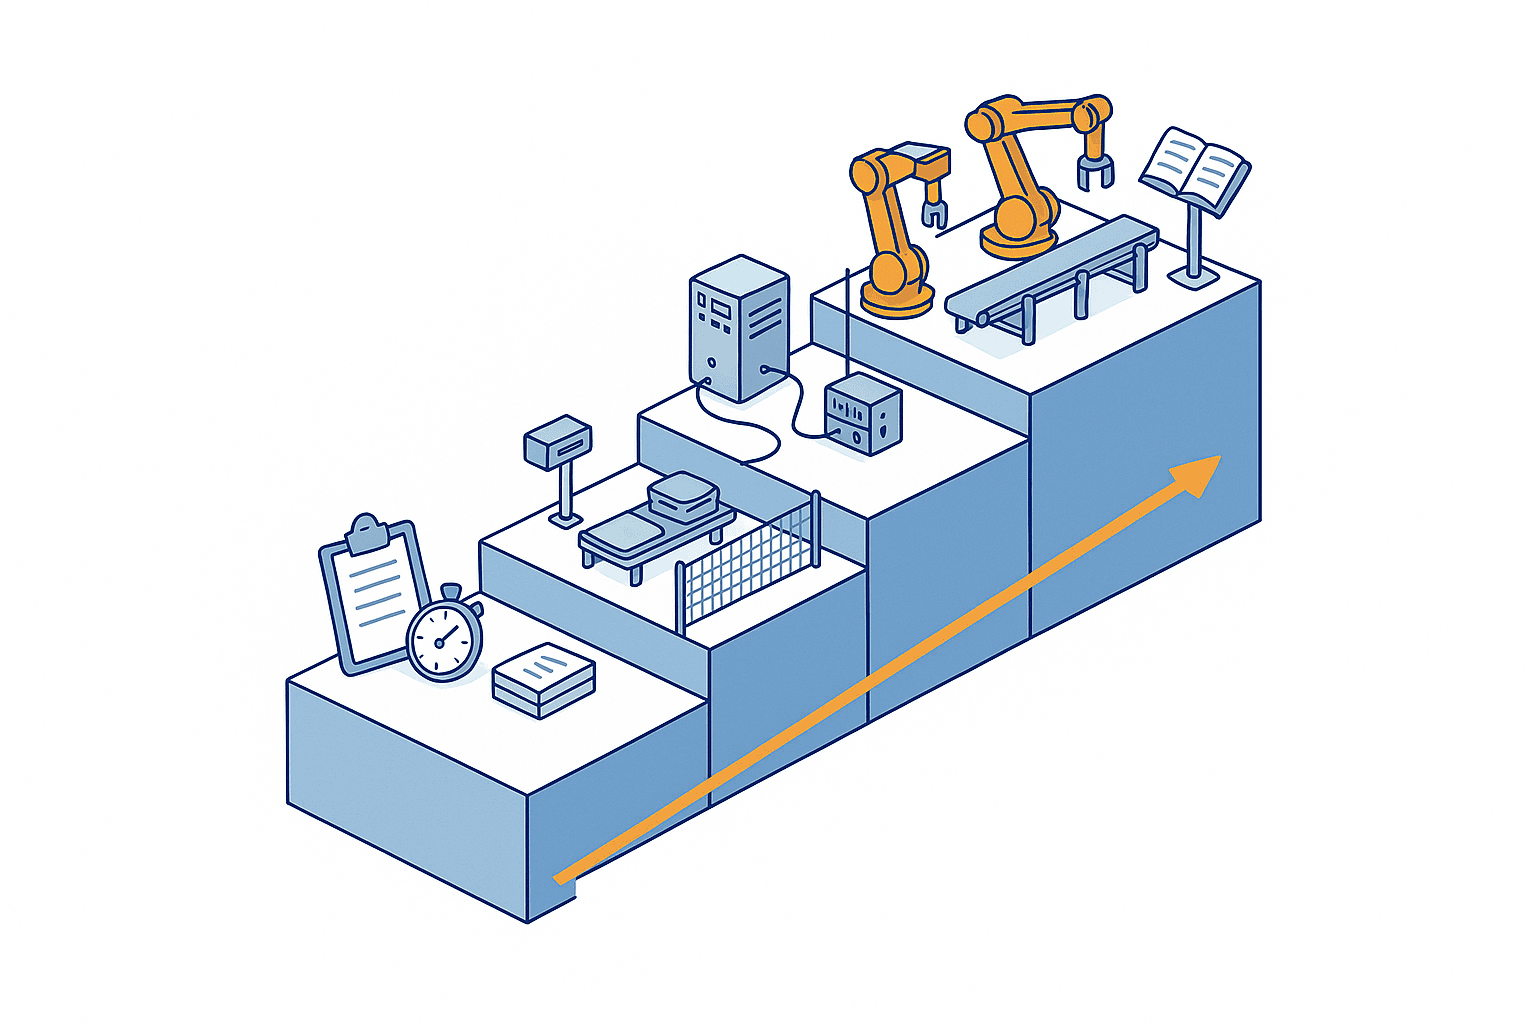
Invert the three structural causes and the sequence follows naturally. The critical element is placing a decision gate at the end of each stage that determines whether the project proceeds.
| Stage | Main activities | Criteria for passing the gate |
|---|---|---|
| Stage 1 Quantify the present | Measure actual cycle time, stoppage causes, real utilisation and staffing at the target process | Downtime can be explained numerically, broken down by cause |
| Stage 2 Design the boundary | Define the interface specification, data granularity, response times and exception handling split against existing systems | Confirmed that instructions are supplied faster than the equipment requires |
| Stage 3 Prove it in a limited scope | Deploy to a single cell or line and verify utilisation against real data | Any gap against assumed utilisation falls within an explainable range |
| Stage 4 Scale and embed | Standardisation, training, maintenance structure, and continuous metric tracking | The share of abnormalities recovered in-house meets the target |
Stage 1 | Turn today into numbers first
Automation studies tend to start with equipment comparison, but the first task is measuring the current state. Actual cycle time rather than theoretical, real utilisation rather than nominal, and a breakdown of downtime by cause. Without those three, every benefit calculation rests on assumptions.
It is not unusual for the measurement exercise to surface problems that do not need automation at all. Spending capital on an issue that a shorter changeover or a better fixture would solve is the most expensive failure available.
Stage 2 | Draw the boundary before you buy
Before requesting quotations, settle the interface specification against existing systems on paper. How often are instructions issued, at what granularity are results returned, which identifier is used, and which side waits when communication drops. Skipping this step is what produces a 90-second versus millisecond mismatch.
This is also where you may discover that the existing system needs modification. If so, that modification cost belongs inside the automation investment from the start, not as a supplementary budget request that surfaces later.
Stage 3 | Prove it small and judge on data
Rather than rolling out across every line at once, prove the concept on a single cell or line. The objective is not a function check. It is validating the utilisation assumption from Stage 1 against real data. If the gap between assumption and measurement can be explained, proceed to scale-up; if it cannot, do not proceed until the cause is identified. Applying that judgement mechanically is what prevents a late withdrawal.
Stage 4 | Leave behind the mechanism that sustains it
What you build during scale-up is not equipment but process. Multilingual standard work instructions, posted recovery procedures, a training plan for in-house maintenance, a documented split of responsibilities with the vendor, and continuous tracking of utilisation and labour-saving benefit. A project with no budget and no hours allocated to this fourth stage is the project that quietly stops after 18 months.
A metrics set for measuring labour-saving investment payback correctly
Evaluating automation against payback period alone hides everything that happens in between. In practice we recommend tracking the following indicators in parallel.
| Indicator | What it tells you |
|---|---|
| Real utilisation | The share of time the equipment is genuinely creating value |
| Share of time waiting for instructions | Whether the boundary with upper-level systems has become the constraint |
| Direct labour hours removed | Labour saving measured accurately in hours rather than headcount |
| Change in indirect labour hours | Hours added by maintenance, changeover and data upkeep, netted off |
| In-house recovery rate for abnormalities | Maturity of shop-floor adoption and the maintenance structure |
| Total cost per unit | Real competitiveness, with wage inflation priced in |
Two of these matter most. The share of time waiting for instructions catches boundary mismatches early, and the change in indirect labour hours exposes the apparent labour saving where headcount fell in one place and workload rose in another. Design both into the measurement from day one and the ROI discussion shifts from opinion to numbers.
Frequently asked questions
Why do automation investments fail?
The cause lies far more in the assumptions and design behind the investment decision than in insufficient technical performance. The three typical causes are oversimplified ROI models, boundary mismatches with existing systems, and an absence of change management and shop-floor adoption. The reported 73% failure rate when an existing broken process is automated as-is shows that cleaning up the target work is required before anything is ordered.
What is a realistic automation payback period?
For collaborative robots, 6 to 12 months is cited as one benchmark. That figure assumes utilisation lands where it was planned. Calculations that exclude integration and training costs while assuming optimistic utilisation will diverge from reality. On the other side of the ledger, with Thai wages rising in the 4% range annually, using a single year of labour cost understates the benefit.
How should labour-saving investment payback be measured?
Measure in labour hours removed rather than headcount removed, then subtract the indirect hours added by maintenance, changeover and data upkeep. Tracking real utilisation and the share of time waiting for instructions alongside those figures also lets you identify the cause when the benefit fails to materialise.
What automation rollout approach avoids FA implementation failure?
Split the work into four stages — quantify the present, design the boundary, prove it in a limited scope, then scale and embed — and place a go or no-go decision gate at the end of each. Settling the interface specification against existing systems before requesting quotations is particularly important.
At what point can a robot implementation failure be spotted?
Most cases are identifiable from utilisation data during the proof stage. If the gap against assumed utilisation cannot be explained, the cause is almost certainly in the surrounding systems or the operational design. Flat benefit three months after deployment with no alarms being raised is the classic signature of instruction supply acting as the constraint.
Summary
What separates automation success from automation risk and failure is not the performance of the robot you selected. The dividing lines sit in three places. First, whether the payback calculation includes utilisation, integration cost and training cost. Second, whether response times, data granularity and the exception handling split against the existing production management system or MES were designed before purchase. Third, whether the training, maintenance and measurement mechanisms needed to keep the equipment running for 18 months after go-live were budgeted for.
In Thailand, the minimum wage reached 400 baht across all of Bangkok in July 2025 and wage growth continues in the 4% range. The BOI’s smart and sustainable industry incentives set a condition under which the exemption cap rises to 100% where domestically manufactured automation and robotics machinery accounts for 30% or more of the investment. With investment applications in the first half of 2026 up 37% year on year, declining to automate at all is not a realistic option. That is precisely why fixing the decision criteria first is the single most effective way to reduce the risk.
Studying automation moves faster when it starts from the numbers on your current process and the boundary against your existing systems, rather than from a comparison of machine models. Even if you are still at the concept stage with no fixed specification, or the scope of integration with your production management system is not yet clear, we are happy to work through the requirements with you. A conversation about your current line configuration and the issues you are seeing is a perfectly good starting point — please get in touch via our contact page.
References
- The robot didn’t fail. The factory did. – AdvancedManufacturing.org
- Why Most Automation Projects Fail – Zelu AI
- AI, Robotics and Automation in Smart Factories 2026 – iFactory
- Thailand’s BOI in 2026 – From Investment Incentives to Accelerated Project Delivery – Mahanakorn Partners Group
- Latest Trends in Thai Labour and Labour Management, 2026 Edition – Kuno Yasunari CPA Office
- Thailand investment applications surge 37% in first half of 2026 – The Nation Thailand


