



When a quotation for daily report AI automation stalls in the approval process, it is not because the effect is small. It is because the effect is being measured in the wrong place. Put the time operators spend writing daily reports in the numerator and payback comes out at 29.2 years. Keep the same factory and the same baseline, but move the numerator to the supervisors’ reading and aggregation work plus the translation and summarization done for Japanese readers, and it becomes 3.0 years. 95.2% of the savings comes from “reading time”. In this article we work both designs all the way through the arithmetic, using a model of a Japanese-owned factory in Thailand.
Put “writing time” in the numerator and payback becomes 29.2 years
The assumptions: a Thai factory with 5 lines, 2 shifts and 60 daily reports
Let us set out one set of assumptions and use it for the rest of the article. Every number that follows is derived from it. There is only one counterfactual world here, and Design A and Design B, which appear later, are both measured against the same baseline.
| Item | Value |
|---|---|
| Lines / shifts | 5 lines / 2 shifts |
| Daily reports | 60 forms per day |
| Supervisors | 8 |
| Managers reading in Japanese | 2 |
| Operating days | 264 days/year (22 days x 12 months) |
| Effective labor cost, operator | 62.5 THB/hour (500 THB/day / 8 hours, based on a 400 THB/day minimum wage) |
| Effective labor cost, supervisor | 163 THB/hour (28,750 THB/month / 22 days / 8 hours) |
| Effective labor cost, manager reading in Japanese | 523 THB/hour (92,000 THB/month / 22 days / 8 hours) |
These effective labor costs include statutory employer burdens. The operator is placed at 500 THB against a daily minimum wage of 400 THB, in other words 1.25 times. Thailand has been moving toward a 400 THB daily minimum wage, and that level is used as the base here.
Before going further, let us bring out the ratio that decides everything downstream. Per minute, the cost is roughly 1.04 THB for an operator, roughly 2.72 THB for a supervisor, and roughly 8.72 THB for a manager who reads in Japanese. A manager’s minute carries a price tag 8.4 times that of an operator’s minute (523 / 62.5 = 8.368). A supervisor’s is 2.6 times. The same “one minute saved” changes in value by more than eight times depending on whose minute it is. That single point very nearly determines the ROI of daily report AI.
The current baseline: 750 minutes and 2,075.0 THB per day
Here is the paper-and-Excel status quo, converted into time and money.
| Process | Minutes/day | THB/day |
|---|---|---|
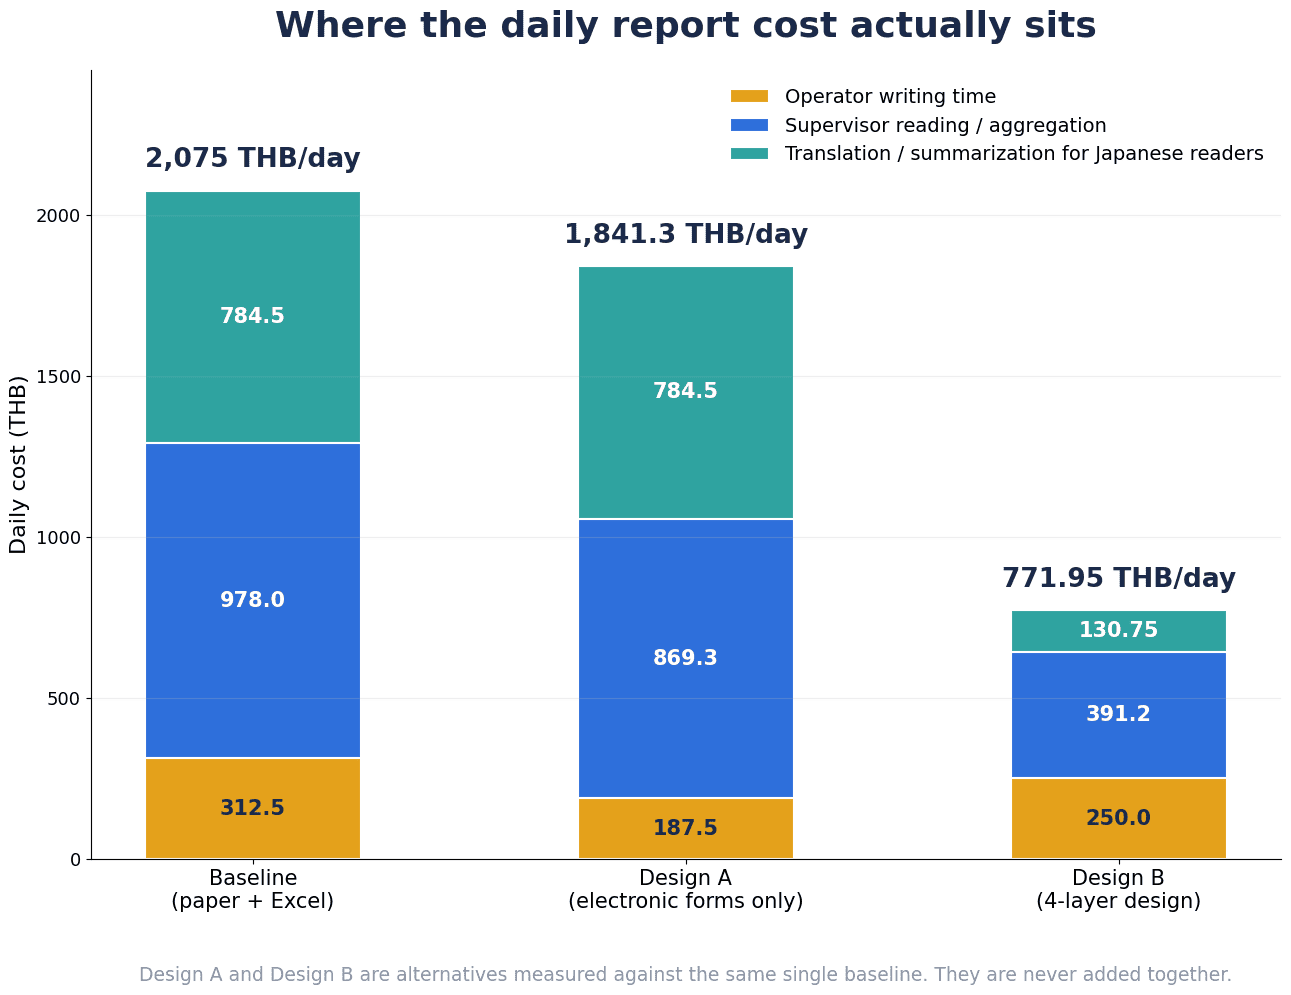
| Operators filling in 60 forms x 5 min | 300 min | 312.5 |
| Supervisors reading, re-keying and aggregating, 8 people x 45 min | 360 min | 978.0 |
| Translation and summarization for Japanese readers | 90 min | 784.5 |
| Total | 750 min | 2,075.0 |
On an annual basis, 2,075.0 x 264 days = 547,800 THB/year. At 1 THB = 4.4 JPY that is approximately 2.41 million JPY.
Read the same table in money and the impression flips. In time, the 300 minutes operators spend writing is the largest single item, about 40% of the 750-minute total. In money, however, it is 312.5 THB, only 15.1% of the 2,075.0 THB total. The remaining 84.9% – 978.0 THB of supervisor reading, re-keying and aggregation plus 784.5 THB of translation and summarization for Japanese readers, 1,762.5 THB in all – is cost generated by the people who read the daily report.
When we show this breakdown on site, the reaction is usually the same: “We were talking about daily reports, and somehow we ended up talking about supervisors and expatriate managers.” That is exactly right. The cost of a daily report sits not in the act of writing it but in the act of reading it.
Design A: just digitize the form
So let us cost the most straightforward move. Replace paper reports with tablet input. Handwriting disappears, so filling in is faster, and supervisors’ re-keying drops a little. Call this Design A.
| Process | Minutes/day | THB/day | Difference |
|---|---|---|---|
| Operators 60 x 3 min | 180 min | 187.5 | -125.0 |
| Supervisors 8 x 40 min | 320 min | 869.3 | -108.7 |
| Translation and summarization (unchanged) | 90 min | 784.5 | 0 |
| Total | 590 min | 1,841.3 | -233.7 |
Annual savings = 233.7 x 264 = 61,697 THB/year. Initial investment 400,000 THB, annual running cost 48,000 THB.
Net effect = 61,697 – 48,000 = 13,697 THB/year. Payback = 400,000 / 13,697 = 29.2 years.
In practice, that is unrecoverable. A net effect of 13,697 THB is approximately 60,000 JPY. Take that number into an approval meeting and it will be stopped. Being stopped is the correct outcome.
Break down the 29.2 years and you can see what happened
Design A is not a failed initiative. It cuts writing time from 5 minutes per form to 3, a 40% reduction. Total time falls from 750 minutes to 590, down 21.3%. On the numbers alone, it is an improvement.
The problem is the composition of the savings. Of the 233.7 THB saved, 125.0 THB – 53.5% – comes from operator writing time. But an operator’s minute costs 1.04 THB; it is the cheapest minute in the factory. Working hardest on the cheapest time produced an annual reduction of 11.3% against the 547,800 THB baseline.
More serious still, the most expensive minute of all – the 90 minutes of translation and summarization – has not moved at all. The reason it does not move is also structural to Design A. Swapping paper for a tablet does not change what is written: free text in Thai. Only the input device changed, so the reading side saves nothing.
Electronic forms themselves do deliver reliably in areas beyond the daily report, such as approval workflows, retention and photo attachments. We cover that scope and its cost effectiveness separately in designing a paperless factory with an electronic forms system. The point here is not that electronic forms are bad. It is that if you book the effect of electronic forms as the ROI of daily report AI automation, the numerator is too small to pay back.
The four-layer model of the daily report: which layers AI may touch, and which it may not
The structural reason daily report AI fails converges on essentially one thing: treating the daily report as a single sheet of paper and throwing all of it at AI as free text. A daily report looks like one document, but it is a composite of four layers with completely different properties. Who writes them, what constrains their correctness, and whether AI may touch them all differ by layer.
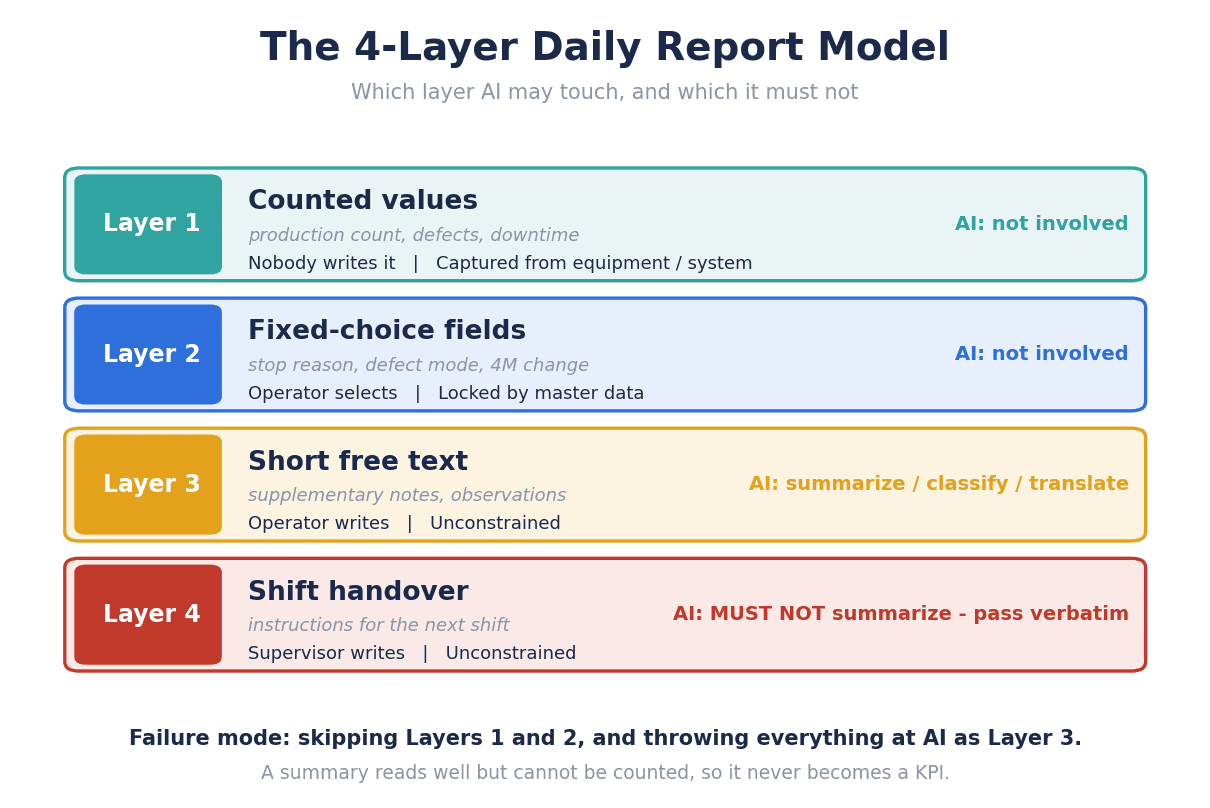
| Layer | Content | Who writes it | What constrains it | May AI touch it |
|---|---|---|---|---|
| Layer 1, counted values | Production count, defect count, downtime | People do not write it. Take it from equipment or systems | Measured equipment signals and counters | No (it should not be generated at all) |
| Layer 2, selection lists | Stoppage reason, defect phenomenon, 4M change points | The operator selects | Options fixed in a master | No (constrain with a master, not with AI) |
| Layer 3, short free text | Supplementary detail, observations | The operator writes | Unconstrained (it cannot be constrained) | AI’s main arena. Summarization, classification, tagging, translation |
| Layer 4, handover | Notes to the next shift | The leader of the previous shift writes | Unconstrained | Must not be summarized. Pass it on verbatim |
Layer 1, counted values: do not have them written on the daily report
Production count, defect count, downtime. As long as people are asked to write these three by hand, the numbers on the daily report will always drift. The cause is not carelessness. People round as they tally. Production counts land on convenient figures, and downtime turns into “stopped for a bit”. There is no bad faith; the shop floor has simply judged that this is good enough as a record.
And here, using AI is not an option. Having AI read handwritten figures only means that figures which were already off when written are read accurately. However far you push OCR accuracy, the accuracy of the source data does not improve at all.
So the answer for Layer 1 is not AI but changing where the data comes from. Equipment completion signals, photoelectric sensor counts, actuals already held in the production control system. Take what you can take, and do not force what you cannot take onto the daily report. We have set out how to draw that line in automating production count capture.
What matters is recognizing that Layer 1 is not the investment target of daily report AI. How much equipment data is available is determined by the state of the existing equipment, and it is not something the design of the daily report can move. Design B, described later, also assumes that Layer 1 is “limited to the range of existing equipment data”.
Layer 2, selection lists: the only layer you can actually count
Stoppage reasons, defect phenomena, 4M change points. This layer has the highest return on effort in daily report design, and it is the one most often skipped.
The reason it gets skipped is understandable: building an option master is tedious. You have to enumerate stoppage reasons, level out the granularity, translate them into the words used on the floor, decide the Thai wording, and keep adding and merging entries as you operate. That work requires shop floor knowledge and cannot be outsourced. A free text box, by contrast, can be used from tomorrow.
But anything you did not turn into a selection can never be counted. However many dozens of reports pile up saying “lots of minor stoppages”, that is a bundle of text, not a stoppage count. To aggregate it, somebody has to read and classify it, and that somebody is a supervisor. The cost of not building Layer 2 is collected every day, in supervisor reading time.
At this point many projects choose to “let AI classify the free text as it is”. Technically it works. However, AI classification results wobble from day to day. The same phrase, “stopped due to low air pressure”, is classified as “equipment cause” one day and “utility cause” another. A classification that wobbles cannot become a KPI. A management indicator only means something once you can compare it with last month, and if the classification criteria are moving, you cannot interpret an increase or decrease.
That is why Layer 2 is constrained with a master, not with AI. If the options are fixed, aggregation becomes addition, and next month and the month after can be compared on the same definition. Not using AI is the right answer for this layer.
Layer 3, short free text: AI’s main arena
Supplementary detail, observations, questions. This has to be free text, and people should be asked to write it. There is real value in having a field where, after selecting “low air pressure” in Layer 2, an operator can write “only happens at the first start-up of the morning; there is a noise from the piping near machine No. 3”.
This is the layer where AI works. Specifically, in four ways.
- Summarization: compress 60 reports’ worth of free text into a volume a manager can read
- Classification and tagging: link text to the Layer 2 options and mark which category each entry relates to
- Multilingual translation: make text written in Thai readable in Japanese
- Cross-cutting search: pull up “didn’t someone write about that piping noise before?” in a few seconds
One caution. AI summarization in Layer 3 only works once Layer 2 exists. If the destination options are fixed, AI’s job becomes a selection problem – “which existing category does this text belong to?” – and both accuracy and reproducibility rise. Throw text at AI with no defined destinations and AI invents categories from scratch every time. That is the real nature of “the summary is beautiful but you cannot count it”.
Layer 4, handover: the layer that must not be summarized
Notes to the next shift. This is the one layer AI must not be allowed to summarize. The reason is in the next section.
Why Layer 4 must not be summarized: conditions, model numbers and exceptions go first
Summarization is a technique for removing information. And there is a pattern in what gets removed first. Conditions, figures, model numbers and exceptions go first.
Here is one example (not a real incident).
The original handover note:
Since around 14:00 the lower clamp on machine No. 3 has been slow to return. It goes back if you push it by hand. It only shows up after a changeover. It has not shown up on shift 1. If the same symptom appears on your shift, we would like you to contact maintenance rather than forcing continuous operation.
The AI summary:
Clamp malfunction on machine No. 3. Contact maintenance.
As a summary it is not wrong. But everything the next shift leader needed has been wiped out.
| Information in the original | After summarization | What happens when it is lost |
|---|---|---|
| Since around 14:00 | Gone | The time-of-day reproducibility cannot be traced |
| It goes back if you push it by hand | Gone | The stopgap is unknown, so the line stops outright |
| Only after a changeover | Gone | The trigger condition is unknown and root cause analysis goes back to square one |
| Not on shift 1 | Gone | The exclusion condition disappears and it is treated as a problem across all shifts |
| If the same symptom appears | Turned into “Contact maintenance” | A conditional instruction turns into an unconditional one |
The last row is the most dangerous. A conditional request – “if the same symptom appears, we would like you to contact maintenance” – has become an unconditional order, “contact maintenance”. In the process of shortening a sentence, summarization AI drops the conditional clause and keeps only the main clause. As a result, advice becomes instruction, conditional becomes unconditional, and possibility becomes assertion. This happens in Japanese and in English alike, and adding translation on top can amplify it further.
The same problem occurs with meeting records. The way minutes AI turns “we will consider it” into “we will do it”, or “A is scheduled to check” into “A will handle it”, is structurally identical to Layer 4 of the daily report. We look at this phenomenon and how to handle it in detail in the pitfalls of AI-generated meeting minutes.
The implementation conclusion is simple. Pass Layer 4 to the next shift verbatim. What AI may be allowed to do is translation (preserving the structure of the original), detection of unread items, and matching against past handovers – those three only. Write into the design that operations which reduce the character count are prohibited in this layer.
And this constraint does not hurt the ROI. Layer 4 is small in volume to begin with, and most of the room for reduction sits in Layers 2 and 3. Even while protecting the place you must not cut, payback still lands at 3.0 years.
The fault line specific to Thai factories: handwritten Thai reports read in Japanese
Handwritten Thai is the hardest ground that remains in OCR
Daily reports in Japanese-owned factories in Thailand carry a fault line that does not exist in Japan. The people who write are Thai; the people who read are Japanese. Until now, supervisors and Thai staff have filled that gap by translating manually. The “translation and summarization for Japanese readers, 90 min, 784.5 THB” line in the baseline table is the price of that fault line itself.
So should you simply have AI read handwritten Thai reports as they are? This is not a place to be optimistic.
In the November 2025 release (1.5) of Typhoon OCR, a Thai-specialized OCR model, the handwritten forms category improved from 0.321 to 0.522 in BLEU and from 0.454 to 0.645 in ROUGE-L. That was the largest improvement of any category: +0.201 in BLEU (about 1.63 times) and +0.191 in ROUGE-L (about 1.42 times). On Thai government forms, results exceeding Gemini 2.5 Pro and GPT-5 have also been reported.
| Category | Metric | Value at 1.5 | How to read it |
|---|---|---|---|
| Handwritten forms | BLEU | 0.321 to 0.522 | Largest improvement of any category, but the absolute value is still low |
| Handwritten forms | ROUGE-L | 0.454 to 0.645 | Same as above |
| Infographics | BLEU | 0.408 | Lowest of any category |
The improvement is real. But an absolute value of 0.522 means “there are more situations where it can be read”, not “it can be fed straight into aggregation”.
ThaiOCRBench gives another clue. This benchmark, published in December 2025 (accepted at AACL 2025) with 2,808 human-verified samples across 13 tasks, shows that the hardest area is fine-grained character recognition: Thai tone marks, small fonts, headless Thai characters, and characters that are hard to distinguish between Thai and English. And handwriting and multi-column layouts are cited as consistent accuracy-reducing factors.
Factory daily reports tick almost every one of those boxes. They are handwritten, ruled into multiple columns, mixed with abbreviations and local vocabulary, written in pencil and stained with oil. Among the paper in the benchmark, they belong to the hardest class.
Which is why making Layer 2 a selection list pays twice in Thailand
Here we return to the four-layer model. If handwritten Thai is hard to recognize, do not make anything recognize it. Turning Layer 2 into a selection list produces several things at once.
- A value chosen with a tap never passes through OCR, so the recognition accuracy problem disappears
- Register the Japanese translation in the option master once and Japanese display becomes a lookup rather than a translation. No daily translation work arises
- A selected value is a number from the start, so no human judgement enters the aggregation
The third point cuts supervisor time directly, and the second cuts manager time directly. The “reading time” that made up 84.9% of the baseline is very nearly explained by those two.
For Layer 3, which stays as free text, have it entered in Thai and translated into Japanese with AI. The points to watch in that step – the absence of word spacing in Thai, where compound nouns break, and how to handle shop floor abbreviations – are set out in working with Thai and generative AI in practice. If we name just one in the daily report context, it is this: make Layer 3 keyboard input rather than handwriting. With Thai text input, the accuracy problem of handwriting OCR never arises in the first place.
ROI: measuring Design B against the same baseline
Design B: the four-layer design
Layer 1 is limited to what can be taken from existing equipment data, and the investment goes into structuring Layer 2 and the AI in Layer 3. The baseline is the same 2,075.0 THB/day as for Design A.
| Process | Minutes/day | THB/day | Difference |
|---|---|---|---|
| Operators 60 x 4 min | 240 min | 250.0 | -62.5 |
| Supervisors 8 x 18 min | 144 min | 391.2 | -586.8 |
| Translation and summarization 15 min | 15 min | 130.75 | -653.75 |
| Total | 399 min | 771.95 | -1,303.05 |
Annual savings = 1,303.05 x 264 = 344,005 THB/year. Initial investment 750,000 THB, annual running cost 96,000 THB.
Net effect = 344,005 – 96,000 = 248,005 THB/year. Payback = 750,000 / 248,005 = 3.0 years.
In yen, the annual net effect is approximately 1.09 million JPY and the initial investment approximately 3.3 million JPY.
The line to notice is the first one. Operator writing time only falls from 5 minutes to 4. That is slower than the 3 minutes under Design A, because more selection items mean more tapping. Even so, the total daily saving is about 5.6 times that of Design A (1,303.05 / 233.7).
The headline number: 95.2% of the savings comes from “reading time”
Let us break Design B’s daily saving of 1,303.05 THB down by origin.
| Origin | THB/day | Share |
|---|---|---|
| Operators’ “writing time” | 62.5 | 4.8% |
| Supervisors’ reading, re-keying and aggregation | 586.8 | 45.0% |
| Translation and summarization for Japanese readers | 653.75 | 50.2% |
| “Reading time” total | 1,240.55 | 95.2% |
62.5 / 1,303.05 = 4.8%. 1,240.55 / 1,303.05 = 95.2%. And 1,240.55 / 62.5 = 19.8 times. The saving from reading time is about 20 times the saving from writing time.
Look at the reduction rate by process and the intent of the design becomes clear.
| Process | Baseline | Design B | Reduction |
|---|---|---|---|
| Operators filling in | 300 min | 240 min | -20.0% |
| Supervisors reading, re-keying, aggregating | 360 min | 144 min | -60.0% |
| Translation and summarization | 90 min | 15 min | -83.3% |
| Total | 750 min | 399 min | -46.8% |
The deepest cut is in translation and summarization, the most expensive minute of all. Per supervisor, 45 minutes becomes 18, which across 8 people is 216 minutes a day – over a year, a considerable amount of time goes back into walking the floor and improvement work.
Design A and Design B are alternatives. Do not add them together
This is where mistakes happen most often in practice, so let us be explicit.
| Item | Design A | Design B |
|---|---|---|
| Daily cost | 1,841.3 THB | 771.95 THB |
| Daily saving | -233.7 THB | -1,303.05 THB |
| Annual saving | 61,697 THB | 344,005 THB |
| Initial investment | 400,000 THB | 750,000 THB |
| Annual running cost | 48,000 THB | 96,000 THB |
| Annual net effect | 13,697 THB | 248,005 THB |
| Payback period | 29.2 years | 3.0 years |
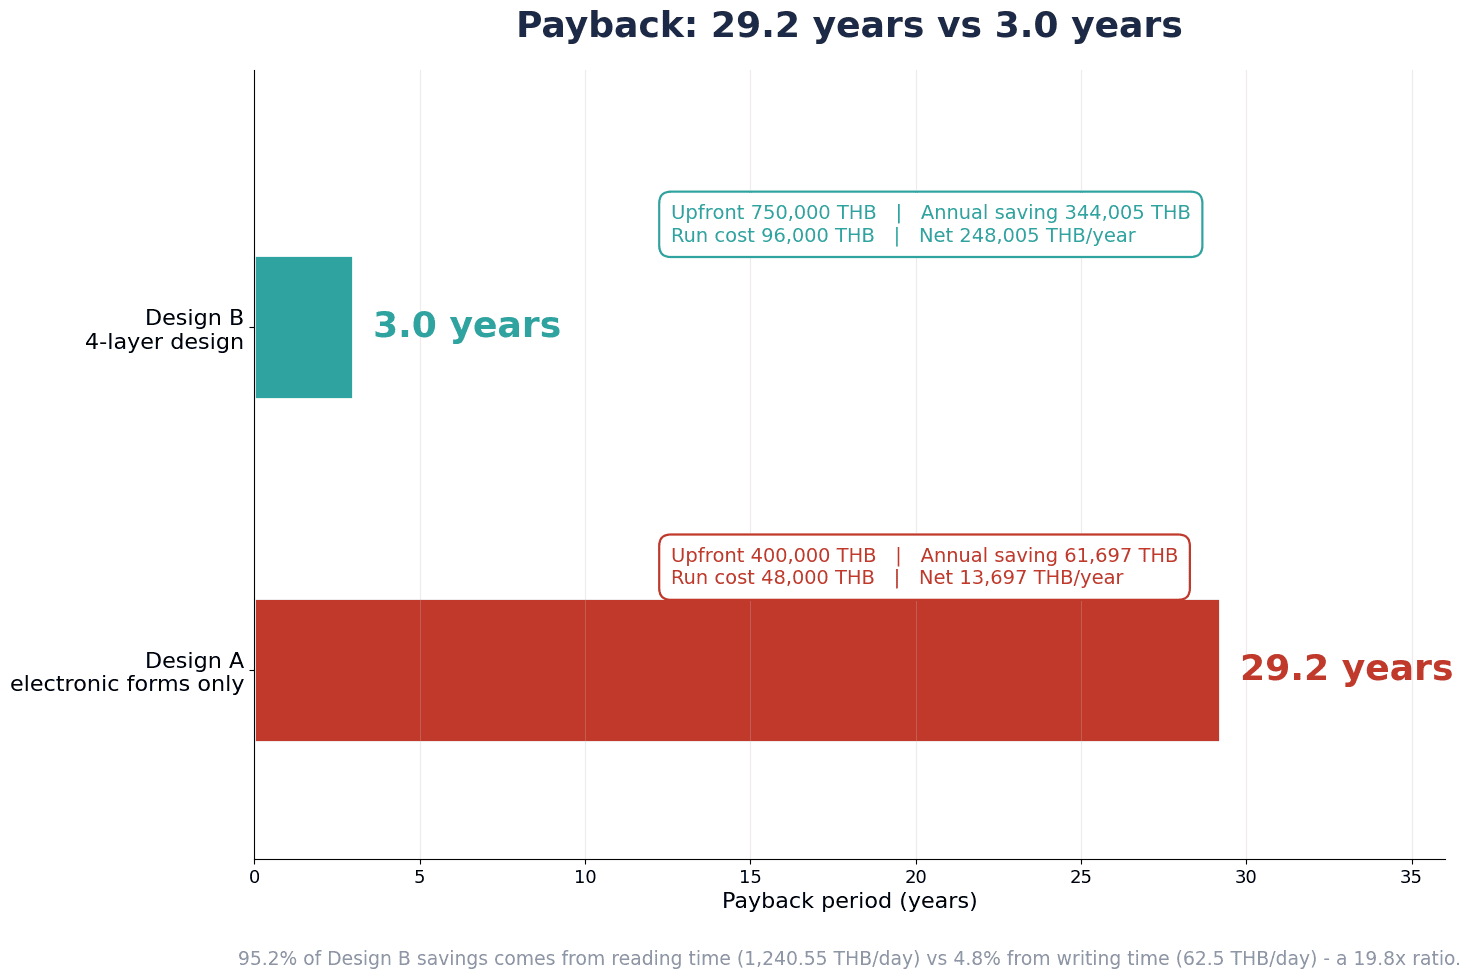
Design A and Design B are two options against the same baseline. You cannot implement both and add the effects together. The moment you choose Design B, Design A’s 61,697 THB no longer exists, because Design B’s 344,005 THB already contains everything, including the reduction in writing time.
When this double counting appears in a quotation, the stated effect swells, but a year after go-live it no longer matches what is measured. Always keep exactly one world line for measuring effect.
It is worth looking at this from the incremental investment angle as well. Moving from Design A to Design B costs an extra 350,000 THB up front and an extra 48,000 THB per year to run. Against that, the annual net effect rises from 13,697 THB to 248,005 THB, an increase of 234,308 THB. 350,000 / 234,308 = about 1.5 years. Viewed on the incremental investment alone, it pays back in a year and a half – that reading is also available.
How to roll it out: start with the Layer 2 master
Assume you have chosen Design B. Then the starting point is fixed. It is the Layer 2 option master. Not selecting an AI, and not selecting a tablet model.
The reason is simple: until the granularity of Layer 2 is settled, you cannot decide what the Layer 3 AI is supposed to classify, and you cannot decide what should be taken from equipment in Layer 1 either. The master is the blueprint of the daily report AI project.
Building the options: derive them from three months of past reports
Do not think them up from scratch. Bring out three months of actual daily reports and start by mechanically listing the words that appear in the free text.
- Extract, exactly as written, the expressions actually used for stoppage reasons
- Merge variants (“low air pressure”, “insufficient air pressure”, “not enough pressure”) into one
- Read the merged list through together with supervisors and operator representatives
- Do not include options that will be chosen zero times
Do this work in both Thai and Japanese and register the pairs in the master as translations. The bilingual table you build here becomes the Japanese-side display itself. Daily translation work disappears because you did this registration once.
Granularity: decide by “does the choice change what happens next”
One criterion is enough for judging granularity. When someone selects that option, does anyone’s next action change?
“Equipment trouble” alone moves nobody. “Low air pressure” sends maintenance to look at the compressor and the air piping. That is the branch point. Conversely, going as fine as “low air pressure (machine No. 3, supply side)” makes the person choosing hesitate, slows the selection, and ends up increasing “other”. Identifying the equipment can be handled in Layer 1 (which machine this report is for), and there is no need to bring it into Layer 2.
Do not add too many: at launch, keep it to one screen
The idea that more options mean more accuracy is a desk theory. In practice, once the options no longer fit on one screen, the floor uses only the top three.
At launch, keep the list to what is visible without scrolling. On top of that, build a quarterly review into the design. The review does two things.
- Read the contents of “other” plus free text, and promote anything that appears repeatedly into an option
- Merge or delete any option chosen zero times over three months
Operating addition and deletion as a pair is the key; keep adding only and in two years you have a master nobody can use. What produces the evidence for those promotion and deletion decisions is the classification and aggregation function of the Layer 3 AI. That is where AI works.
The order, summarized
| Stage | What to do | Rough timing |
|---|---|---|
| 1 | Extract options from past reports and register translations (Layer 2) | First |
| 2 | Connect counted values available from existing equipment data (Layer 1) | In parallel with Layer 2 |
| 3 | Put the selection-based input screen in front of the floor and get it running | After Layer 2 is complete |
| 4 | Add the Layer 3 AI (translation, classification, summarization) | Once selection-based input is running |
| 5 | Add the mechanism that passes Layer 4 through verbatim | At the same time as 4 |
It matters that 4 comes after 3. Put AI in first and you are asking AI to invent categories with no destination defined, which takes you back to the “wobbling classification” described above.
Three common failures
Failure 1: throwing everything at AI while it is still Layer 3
This is the most common pattern. The existing daily report format is left completely unchanged, scanned or photographed, fed to AI, and instructed to “summarize this, put it in Japanese, and tell me the trends”.
The demo goes well. From a week of daily reports comes output like “mentions related to air pressure increased this week”, and the meeting room applauds. The problem arrives in month three. Nobody can answer “how many more air-pressure-related cases were there compared with last month?” because the classification definitions move every time.
The summary is beautiful, but you cannot count it. An indicator you cannot count does not become a KPI, a mechanism that is not a KPI falls off the agenda of the improvement meeting, and a mechanism off the agenda stops being used. Daily report AI started without building Layer 2 ends quietly along that path.
Failure 2: creating 100 options
This is the pattern that over-builds the option list in reaction to Failure 1. Chasing completeness, listing every conceivable stoppage reason, arranging them into a hierarchical menu, and passing 100 entries.
What happens on the floor is as described above. Because selection takes time, operators learn the shortest path: the top option, or “other”. As a result, data accumulates but does not reflect reality, and all that remains is the conclusion that “we made it selection-based and it still isn’t usable”, which makes the next improvement proposal harder to get approved.
The countermeasure is to make the starting point deliberately coarse. A coarse master can be refined at the quarterly review. Making an over-detailed master coarser later is a far harder job, because continuity with past data is broken.
Failure 3: continuing to have people write Layer 1
Selection lists are in, AI is in – but the production count and defect count fields are still handwritten. This one is frequent too.
Leave that in place and the credibility of the whole system collapses, because there will always be a month where the aggregated stoppage reasons collected through selection lists and the handwritten production counts do not add up. The judgement the floor makes at that moment is: “the numbers from this system cannot be trusted.” A single manual entry brings down trust in the entire system.
If it cannot be taken from equipment, drop that item from the daily report and operate within what you can take. A “daily report where every number on it can be trusted” gets used on the floor more than a “daily report where every field is filled in”.
Where Thai manufacturing stands: why the order of investment is being asked now
Whether you put this calculation into practice in Thailand cannot be separated from current conditions.
In the first quarter of 2026, Thailand recorded 156 factory closures against 139 openings, with closures outpacing openings for the first time in 10 quarters. Closures were up 11.4% year on year and openings down 63.9%. The gap is 17. 99.3% of new employment was concentrated in large and medium-sized factories, lending to SMEs has been negative for 13 consecutive quarters, and SME total factor productivity turned negative for the first time in 2024, at -0.27.
The figures from two months earlier were harsher still: 141 closures in January-February 2026, up 58.43% year on year, against 116 openings, down 60.14%. Capacity utilization in February 2026 was 58.21%, below the 60% line. On the cost side, diesel is at 48.40 THB/L, and resins, chemicals and aluminium have risen by 10-30%. Kriengkrai Thiennukul, chairman of the Federation of Thai Industries (FTI), has warned of the risk of stagflation.
| Indicator | Figure | Source |
|---|---|---|
| Q1 2026 factory closures | 156 (+11.4% year on year) | Nation Thailand (2026-05-21) |
| Q1 2026 factory openings | 139 (-63.9% year on year) | Same |
| January-February 2026 closures | 141 (+58.43%) | Nation Thailand (2026-04-14) |
| February 2026 capacity utilization | 58.21% | Same |
| Diesel price | 48.40 THB/L | Same |
What this environment means is not “do not invest”. It means there is no longer room to get the order of investment wrong. At a utilization rate of 58.21%, absorbing costs through higher output is not something to count on. Approve one investment that takes 29.2 years to pay back and that budget line is occupied for years.
The same thing is being said about AI investment in general. McKinsey’s “The state of AI” (November 2025) notes that what most determines whether AI can move EBIT is the redesign of workflows. While 62% of respondents are at least piloting AI agents, only about 6% are “high performers” able to attribute more than 5% of EBIT to AI. The picture is that most companies put AI on top of existing business processes and stall there without producing an effect.
In daily report terms, putting AI on top of the existing free text format is the former; splitting the daily report into four layers and rebuilding Layer 2 is the latter. The difference is not technology but whether you touched the design of the work itself. With utilization falling, raw material prices rising and lending to SMEs tightening, the question being asked is not whether to use AI, but which minute your design is cutting.
Frequently asked questions (FAQ)
How much does daily report AI automation cost?
In this article’s model (5 lines, 2 shifts, 60 daily reports per day, 8 supervisors), the four-layer design is placed at 750,000 THB initially and 96,000 THB per year to run. The annual net effect is 248,005 THB and payback is 3.0 years. A configuration that merely digitizes the form looks cheaper at 400,000 THB initially and 48,000 THB per year, but its annual net effect is only 13,697 THB, so payback is 29.2 years. What you should be judging is not the absolute initial cost but whose time sits in the numerator of the savings. A quotation that does not have supervisor reading time and translation and summarization time for Japanese readers in the numerator will not pay back, however cheap the price.
What is the difference between digitizing manufacturing daily reports and AI summarization?
Digitization is a measure that swaps the input device from paper to tablet, and what it cuts is mainly operator writing time. In this article’s Design A, filling in goes from 5 minutes per form to 3 and the daily cost falls by 125.0 THB. But that is 53.5% of a daily saving of 233.7 THB, and it only comes to 61,697 THB a year overall. AI summarization is a measure that reduces the load on the people reading free text, but adding summarization alone does not let you aggregate. To make things countable you need the Layer 2 selection master, and only when digitization, selection lists and AI summarization are all in place do supervisor time fall by 60% and translation and summarization by 83.3%. None of them delivers on its own.
Is it safe to leave multilingual daily report translation to AI?
The answer differs by layer. For Layer 2 selection lists, register the translations in the master once and Japanese display becomes a lookup rather than a translation. Translation failures cannot occur structurally there. For Layer 3 free text, AI translation is fine. The layer that needs care is Layer 4, the handover. Apply translation and summarization at the same time and conditional clauses can drop out, producing meaning reversals such as “if the same symptom appears, we would like you to contact maintenance” becoming “contact maintenance”. Do not summarize Layer 4; translate it while preserving the structure of the original, and include the original text alongside.
How much will a shift report system reduce writing time on the floor?
Do not expect too much. In this article’s four-layer design, filling in goes from 5 minutes per form to 4, a reduction of only 20%. More selection items mean more tapping. A design that merely digitizes the form is faster to fill in, down to 3 minutes (-40%). The reason to choose the four-layer design anyway is that, more than the difference in writing time, the saving on the reading side is 19.8 times larger (1,240.55 / 62.5). Judge a shift report system only on “did it make life easier on the floor” and you will miss the largest part of the money.
Where should we start if we want to automate shop floor report aggregation?
Start by collecting three months of past daily reports and writing out the stoppage reasons and defect phenomena actually recorded in the free text. Merge the variants, attach Thai and Japanese translations, and turn them into an option master. That work is Layer 2, and it very nearly determines how far report aggregation can be automated. Anything you did not turn into a selection will still not be countable at the end, even with AI in place. Counted values such as production count and downtime should be taken from equipment rather than written on the daily report. Introducing AI can wait until selection-based input is running on the floor.
Can handwritten Thai daily reports be read by OCR?
There are more situations where they can be read, but not at an accuracy you can feed straight into aggregation. With Typhoon OCR 1.5, BLEU for handwritten forms improved from 0.321 to 0.522 and ROUGE-L from 0.454 to 0.645, the largest improvement of any category. Even so the absolute values are lower than other categories, and ThaiOCRBench likewise reports that the hardest area is fine-grained character recognition (tone marks, small fonts, headless Thai characters, characters hard to tell apart between Thai and English), with handwriting and multi-column layouts consistently reducing accuracy. Factory daily reports tick almost all of those boxes. The realistic answer is not to have handwriting read at all. Make Layer 2 a selection list and it never passes through OCR; make Layer 3 keyboard input and the handwriting recognition problem never arises in the first place.
Summary
Daily report AI automation does not pay back when it is designed as a measure to cut writing time.
- Of the 2,075.0 THB/day baseline, 84.9% arises on the “reading” side: 978.0 THB of supervisor reading, re-keying and aggregation, and 784.5 THB of translation and summarization for Japanese readers.
- Digitizing the form alone gives 29.2 years. Annual savings of 61,697 THB less 48,000 THB of running cost leaves a net effect of 13,697 THB. Even a 40% cut in writing time is cutting the cheapest minute in the factory.
- The four-layer design gives 3.0 years. Annual savings of 344,005 THB and a net effect of 248,005 THB. 95.2% of the savings (1,240.55 THB/day) comes from reading time, 19.8 times the 4.8% (62.5 THB/day) that comes from writing time.
- Do not have Layer 1 written on the report, constrain Layer 2 with a master rather than AI, make Layer 3 AI’s main arena, and do not summarize Layer 4. Those four lines are the whole of the design.
- Design A and Design B are alternatives. Do not add the effects together. One baseline, one world line.
- In Thailand, making Layer 2 selection-based pays twice. It avoids OCR of handwritten Thai, and the bilingual master makes the daily translation work itself disappear.
The place to start is not selecting an AI or choosing a tablet model, but deriving an option master from three months of past daily reports. Put AI on top before that is settled and the output will be beautiful and uncountable.
TOMAS TECH is based in Bangkok, Thailand, and works on systems integration for Japanese-owned manufacturers in production management, factory IT/OT and applied AI. On daily report AI automation, if you can show us the actual daily reports you use today and the time your supervisors spend on aggregation, we can put together the same calculation as in this article using your own numbers. That is fine at the stage where nothing has been decided, or where you simply want to check whether this four-layer split holds for your daily report. Feel free to get in touch via our contact page.
Sources
- Thailand factory closures outpace openings as SME strain deepens (Nation Thailand, 2026-05-21)
- Thai industry warns of stagflation risk as factory closures jump 58% (Nation Thailand, 2026-04-14)
- Typhoon OCR 1.5 release notes (2025-11-14)
- ThaiOCRBench (2025-12-02, accepted at AACL 2025)
- The state of AI (McKinsey, 2025-11)
- OIE Industrial Indices (Office of Industrial Economics, Thailand)
- Typhoon OCR paper (arXiv)
- Thailand minimum wage guide (increase to 400 THB per day)


