


Most electronic kanban projects start with a product comparison. But digitizing paper kanban cards one at a time simply swaps card-collection labour for scanning labour, and neither inventory nor stockouts move much. The first decision is not the product and not the scanning method. It is three boundaries — scope, trigger source and sync grain. Using a Japanese-owned automotive parts plant in Chonburi, Thailand as a model case, this article opens up every calculation, from why an all-part-numbers rollout does not pay back (a three-year TCO of THB 2,078,000 against a three-year benefit of THB 975,960) to why narrowing to the top 15% still shows a 7.4-year payback on a profit-and-loss basis while cash flow all but offsets the investment in year one.
What an electronic kanban system really digitizes — the three functions bundled into one paper card

A paper kanban card bundles three functions of completely different natures onto a single piece of card stock. Because people say “let us digitize kanban” without separating that bundle, the conversation goes sideways.
The first function is the replenishment signal. A bin has emptied, or consumption has started. That fact is passed from the downstream process to the upstream process, or from the warehouse to the supplier, and it fires an instruction to make the next lot or move the next bin. You could simply call it the trigger.
The second function is physical identification. What part is in this bin and how many, which line and which machine it is for, when it arrived. Look at the card and you can identify the physical goods. It is an ID function.
The third function is the flow record. Track where the cards are and you know how far the material has progressed. Count the cards sitting in the post and you can see the work in process. It is a traceability function.
These three coexist on one physical medium purely by historical accident. They are, in truth, entirely different jobs. And the crucial point is this — the only one an electronic kanban system genuinely improves is the first, the replenishment signal. The second and third are already handled in most plants by barcodes, 2D codes, RFID or an inventory management system. In plants where they are not, the fix is a label-and-handheld project, not an electronic kanban project.
Which mechanism carries each of the three functions
| Function | How paper kanban carries it | What actually carries it once digitized | Does electronic kanban help |
|---|---|---|---|
| Replenishment signal (trigger) | Detach the card, collect it, drop it in the post | Push button, sensor, production reporting, inventory threshold | Yes |
| Physical identification (ID) | Read what is printed on the card | 2D code on the bin label, RFID tag | Existing mechanisms are usually enough |
| Flow record (traceability) | Count the cards in the post | Inventory management system, production reporting | Existing mechanisms are usually enough |
Read that table across and it becomes clear that only one row genuinely belongs in an electronic kanban business case. And yet the row the shop floor debates first is almost always the second one. Print a barcode on the card. Embed RFID in a dedicated plastic card. The reason is visibility. Cards are physically visible, and visible things are what people want to start with.
The next chapter puts numbers on what happens when you start with the visible thing.
Why starting with barcoded cards produces no measurable benefit
Let us measure the labour that paper kanban actually consumes in the model case. The assumptions are as follows.
A Japanese-owned automotive parts plant in Chonburi, Thailand. It runs press, welding and assembly, with 3 assembly lines and one parts warehouse. Operations run 2 shifts covering 16 hours per day, 250 days a year. There are 420 part numbers under kanban control and 1,850 kanban cards in circulation. Inventory value for the kanban-controlled parts is THB 8,400,000.
Fully loaded labour cost for a shop floor operator is taken as THB 75 per hour. The basis is that the Chonburi minimum wage has been THB 400 per day since January 2025 (Bangkok reached the same level on 1 July 2025). THB 400 divided by 8 hours gives THB 50 per hour. Adding social security, bonus, meal allowance, transport and other on-costs at roughly 1.5 times gives 50 multiplied by 1.5, or THB 75 per hour. That 1.5 multiplier is an assumption we have set, not a published figure. On-cost structures differ by company, so when reading every amount below, substitute your own fully loaded rate and recalculate. Every formula is written out in the body text, so swapping the inputs lets you follow the same steps.
The time spent collecting, sorting and posting kanban cards
The material handler runs 8 milk runs per shift, or 16 across 2 shifts. Net kanban-related work per run measured 6 minutes. “Net” means only four motions — detaching cards, sorting them by type, dropping them in the post, and reconciling card counts. It excludes the transport itself and pushing or pulling the trolley.
6 minutes multiplied by 8 runs multiplied by 2 shifts equals 96 minutes per day, which is 1.6 hours per day. With 2 material handlers, that is 1.6 multiplied by 2, or 3.2 hours per day. Multiply by 250 days and you get 3.2 multiplied by 250, or 800 hours per year. Apply the fully loaded rate and 800 multiplied by 75 gives THB 60,000 per year.
THB 60,000 a year. Whether that reads as large or small depends on the plant, but it is certainly not an amount that justifies a system investment. This is the first fork in the road.
Digitizing the card alone removes only 30% of it
Now apply the conventional approach of barcoding the cards. Print a 2D code on each card, have the material handler scan it with a handheld, and the replenishment request flies into the system. Collecting, sorting and posting the cards disappears.
But new work appears. Carrying the handheld around, scanning the codes, confirming each read, checking for missed scans, charging the terminals, and falling back to paper when a battery dies or the network drops. Measured on the floor, this swap eliminated only 30%, or THB 18,000, of the THB 60,000. The rest is collection labour that simply changed shape into scanning labour.
By contrast, when the trigger source itself is changed — when the human motion of touching a card is removed from the process altogether — 75%, or THB 45,000, disappears. A sensor picks up the fact that an empty bin has been placed on the return rack, or the machine counter reaching a set quantity automatically raises a replenishment request. In that form, nobody performs a motion whose only purpose is to emit a signal, so the labour genuinely disappears.
| Approach | Labour eliminated | Annual saving |
|---|---|---|
| Print 2D codes on cards and scan with a handheld | 30% | THB 18,000 |
| Change the trigger source itself | 75% | THB 45,000 |
45,000 minus 18,000 leaves a gap of THB 27,000 per year. Looked at as labour alone, that gap is trivial. But the two approaches differ decisively somewhere other than labour. A scan-the-card design emits no signal if a person forgets to scan. A design triggered by a sensor or by production reporting does not depend on human motion, so missing signals themselves become rarer. The THB 78,000 of loss-related cost and the THB 36,000 of stockout-driven line stoppage savings that appear later both flow from that property of signals not going missing.
In short, start with barcoded cards and you capture only 30% of the labour, and you also cut yourself off from every downstream benefit. This is why so many electronic kanban rollouts end at “we installed it and nothing changed”.
Decide three boundaries, not a product
So where do you start? Before product selection, draw these three boundaries.
First, the scope boundary. Are internal kanban loops the only target, or do supplier pull instructions and delivery instructions come in too? This is what moves cost layer 4 (integration with existing systems) the most.
Second, the trigger boundary. What emits the signal to make the next lot? A person pressing a button, an empty bin returning, production being reported, or inventory crossing a threshold. As the previous chapter showed, this choice determines most of the benefit.
Third, the grain boundary. Do you sync every time a bin moves, batch it per milk run, or is once a day enough? Finer grain reduces inventory but increases traffic, terminal count and floor handling.
All three have to be decided whichever product you choose. Put the other way round, decide the three first and the candidate list narrows itself. Look at products without deciding, and you end up choosing by the length of the feature list — and paying for features you never use.
| Boundary | What is decided | Where it mainly bites | What happens if you leave it open |
|---|---|---|---|
| Boundary A, scope | Stay internal, or include suppliers | Cost layer 4 (integration with existing systems) | Integration cost spikes, dragged along by whatever the other party can receive |
| Boundary B, trigger | What emits the make-the-next-lot signal | Labour, loss-related cost, stockouts | Collection labour merely becomes scanning labour |
| Boundary C, grain | Every event, per milk run, or daily | Card count and inventory, floor handling | Inventory does not fall, or the floor runs on two conflicting rhythms |
The order is fixed too — A, then B, then C. Trigger design cannot be settled until scope is settled. If external parties are in scope, the signal itself can still come from your own consumption events, but it has to be converted into a form the other party can reliably receive, and you cannot design the path from trigger to notification until you know what their receiving capability is. In the same way, grain cannot be settled until the trigger is settled. If a sensor picks up empty bin returns, event-by-event sync is natural. If a handheld does the scanning, per-milk-run sync reduces floor handling.
Work this order backwards and it usually breaks down. The common pattern is that only a grain requirement has been fixed in advance — “we want to see inventory in real time” — while scope and trigger remain undecided as the product comparison begins. Ask for quotations in that state and, since the vendor has no basis on which to narrow anything, the configuration comes back covering all 420 part numbers. The three-year TCO of THB 2,078,000 for an all-part-numbers rollout, discussed later, is built exactly this way. Let us take the boundaries in order.
Boundary A — stay internal, or include suppliers
Internal kanban circulates between processes, or between the warehouse and a process. The counterparty is your own organization, so once decided, it moves. Changing operating rules or adding terminals is entirely within your own control.
External kanban is different. Pull instructions and delivery instructions to suppliers depend on what the other party can receive. What they can receive changes how you have to build your side. This is the reason cost layer 4 spikes.
With Japanese-owned tier 1 suppliers you can ride a standard
In the Japanese-owned automotive parts industry, EDI standards from the Japan Automobile Manufacturers Association (JAMA) and the Japan Auto Parts Industries Association (JAPIA) are well established. Their scope covers delivery slips (kanban included) and electronic tags, with defined form layouts and code systems. If your counterparty is a Japanese-owned tier 1 supplier already on the same standard, riding it is the shortest path. There is no need to negotiate conventions from scratch, and the modifications to both parties’ internal systems follow a known pattern.
Standard EDI does not reach Thai local suppliers
The problem is Thai local suppliers. Few of them are on the Japanese EDI standards. Typically there is no EDI line contract, no dedicated receiving system, and nobody assigned to run one. Demand standard EDI here and either their setup cost and operating burden come straight back into your quotation, or you are simply told it cannot be done.
The practical answer is not standard EDI but a web form opened in a smartphone browser plus QR code scanning. You notify the replenishment request by URL, they open it on the phone already in their pocket and confirm it, and they scan the QR on the bin at shipment. Build it so that no dedicated terminal and no EDI line is required, and additional investment on their side is close to zero. One-time links or simple accounts are sufficient for authentication.
This configuration is not an inferior fallback. What standard EDI solves is high-volume data exchange between core systems, not conveying a dozen or so replenishment instructions a day. It is simply a matter of not choosing a means that is excessive for the purpose.
As a rule, stay internal at first
With that said, here is the practical rule. In the first phase, stay inside your own walls. There are three reasons.
The moment external parties are included, layer 4 integration cost spikes. Each additional counterparty creates another variation of receiving method, and each variation needs its own testing. And pulling outside parties in before internal operations have settled means every rule change made for your own convenience inconveniences them, which damages the relationship.
Run one full internal cycle first, and by then your own requirement specification will have settled. How far to build out order and delivery information exchange with suppliers is a topic in its own right, covered separately in how to choose an order and purchasing management system, so review that alongside this when the time comes to extend beyond your own walls.
Boundary B — what emits the make-the-next-lot signal
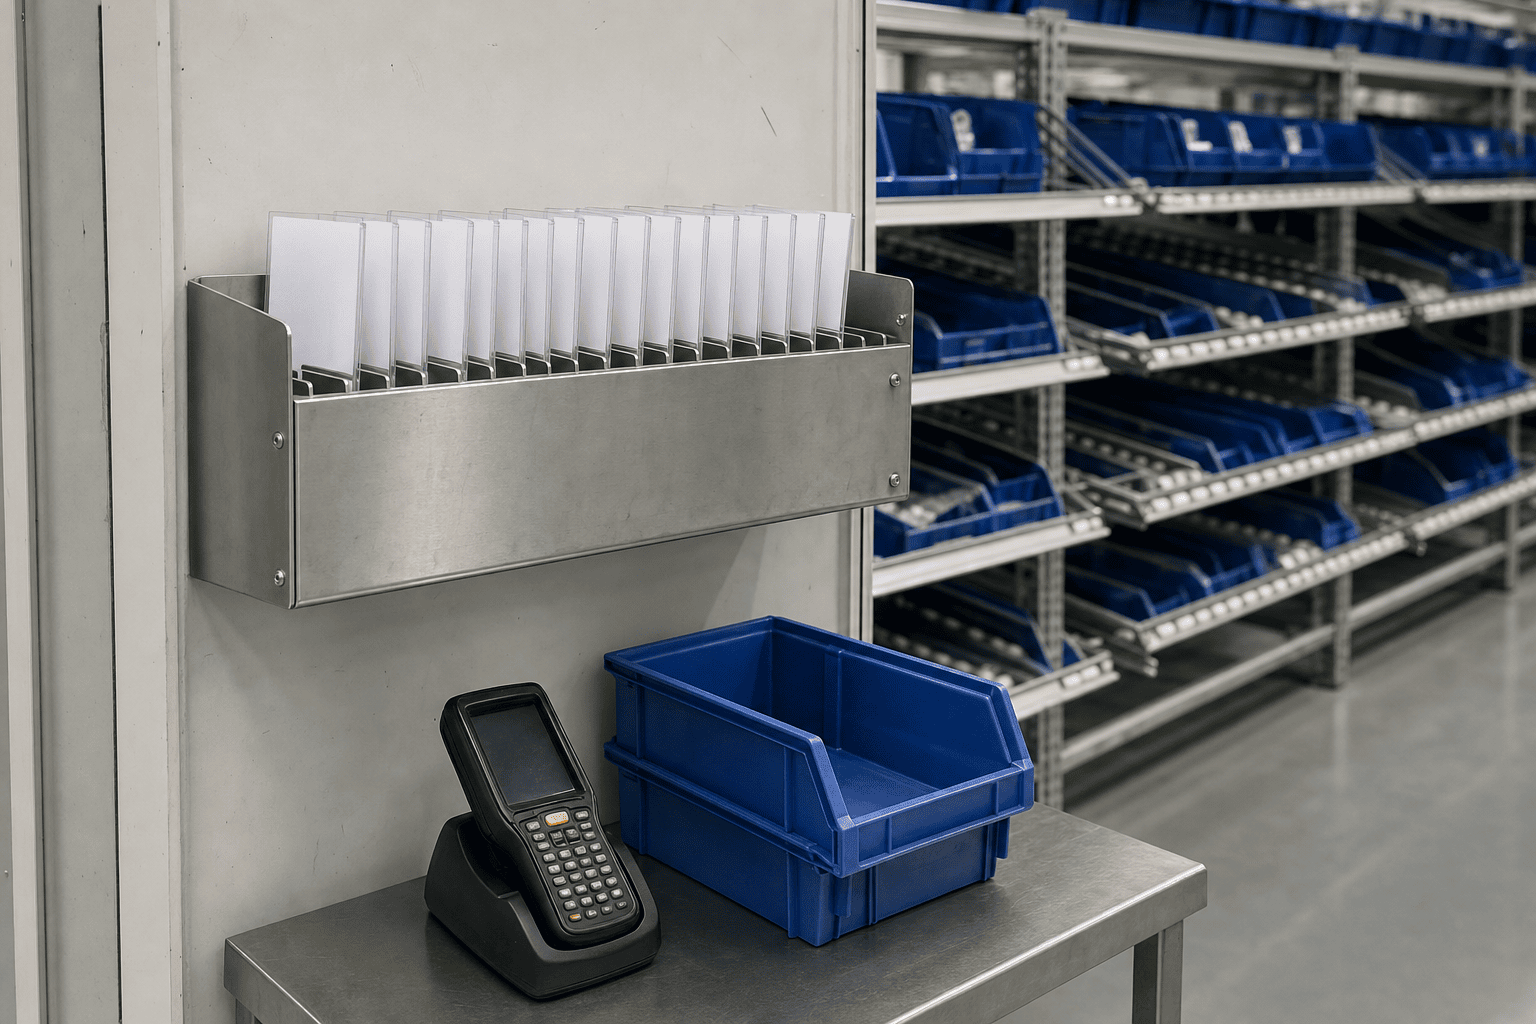
Of the three boundaries, this is the one that determines roughly 80% of the benefit. In practice there are four trigger sources.
The four trigger sources
First, a person presses. Put a push button on the workbench, or scan a code on a card or rack label with a handheld. It is the easiest to deploy and needs almost no additional installation work. But as the previous chapter showed, it tends to convert collection labour into scanning labour and nothing more. A forgotten press or a missed scan becomes a stockout directly, so missing signals persist at much the same rate as with paper.
Second, an empty bin returns. Fit weight sensors or photoelectric sensors to the return rack and make the physical fact of an empty bin being placed there the signal. Because the movement of goods is the signal, no human motion is required to emit it. Of the three approaches where labour genuinely disappears — the second, third and fourth — this one tracks physical movement most faithfully. The trade-off is installation cost per rack and the effort of keeping up with rack layout changes.
Third, production is reported. Raise a replenishment request when a machine counter or production reporting reaches a set quantity. In a plant that already collects production data, the only additional cost is interface development. Conversely, in a plant where reporting is entered in batches after the fact, the signal is late. This approach depends directly on the accuracy and freshness of production reporting.
Fourth, inventory crosses a threshold. Raise a replenishment request when book inventory in the inventory management system falls below the reorder point. This is classic reorder point control. It uses no physical kanban at all, so operations are the cleanest, but it misfires when book inventory and physical inventory diverge. Choose this in a plant with chronic stock count discrepancies and stockouts increase rather than decrease.
Comparing the four approaches
| Trigger source | Initial cost | Does labour disappear | What it depends on | Best-suited processes |
|---|---|---|---|---|
| A person presses (button, handheld) | Low | Partly (around 30%) | People forgetting to press or scan | Interim answer for the first trial loop |
| An empty bin returns (weight, photoelectric sensor) | Medium to high | Yes | Sensor installation and maintenance | Fast-moving processes with low inventory accuracy |
| Production is reported (counter, reporting) | Low to medium | Yes | Accuracy and freshness of reporting | Processes already collecting production data |
| Inventory crosses a threshold (reorder point) | Low | Yes | Accuracy of book inventory | Slow-moving items with high inventory accuracy |
The rule of thumb is this. Processes where goods move fast and inventory accuracy is low take the second or third option. Slow-moving items with high inventory accuracy take the fourth. The first, a person pressing, should be treated as an interim answer for the first trial loop. Designed as the end state, it produces no benefit.
Because inventory accuracy is the deciding factor, check first how closely your book inventory actually matches physical inventory. Stock count discrepancy rates and how inventory is counted in the first place are covered in comparing factory inventory management systems. Choosing the reorder point approach while discrepancies remain large is the fifth of the common failures listed later.
Mixing them is fine
You do not need to put every part number on the same trigger source. Fast-moving large parts on empty bin return, machined parts with production reporting on counters, slow-moving small parts on reorder point. Mixing them causes no operational problem at all. If anything, forcing everything onto a single approach strains some process somewhere. Whether the product lets you hold a trigger attribute per part number is a substantive requirement to confirm during product selection.
Boundary C — at what grain do you sync
Think of grain in three levels. Every event, per milk run, and daily.
Every event means the signal flies each time a bin moves. Information lag is the smallest, so card counts can be the lowest. In exchange, transmission frequency rises, scanning and operating actions increase, and more terminals are needed.
Per milk run means batching the sync to each fixed-time, fixed-quantity transport run. In the model case there are 8 runs per 8-hour shift, so 8 hours divided by 8 runs gives one run per hour, or 16 runs across 2 shifts. Signals wait until the next run, so information lag relative to event-by-event sync is up to about one hour.
Daily means one batched sync per day. Operations are the lightest, but the required card count is the highest. Daily is sufficient only for items with stable demand and long replenishment lead times.
| Grain | Information lag | Effect on card count | Floor handling | Traffic and terminals |
|---|---|---|---|---|
| Every event (per bin) | Near zero | Lowest | High | High |
| Per milk run (8 runs per shift) | Up to about one hour | Middle | Moderate | Moderate |
| Daily | Up to one day | Highest | Low | Low |
In Thai two-shift operations, per milk run is usually the realistic landing point in our experience. The reason is that it lets you ride information sync on an existing rhythm, the material handler’s transport run. Batch the signals to the transport timing and no new motion has to be added on the floor. Go to event-by-event sync instead and the transport rhythm and the information rhythm drift apart, leaving the floor working to two rhythms.
The design of the transport runs themselves — how many runs, which routes, how the trolleys are made up — directly governs how well electronic kanban performs. That territory is covered in improving in-plant logistics, so if you choose per-milk-run grain, we recommend revisiting the transport run design at the same time.
The kanban card count formula does not change when you digitize — only the review cycle does
This is the most important chapter in this article.
The kanban card count formula is as follows.
Card count = average demand multiplied by replenishment lead time multiplied by (1 + safety factor), divided by container quantity
Not one character of that formula changes when you introduce electronic kanban. Double the average demand and you need double the cards. Halve the replenishment lead time and you need half. Raise the safety factor from 0.2 to 0.3 and the count goes up. Increase the container quantity and the count goes down. Digitization acts on none of those terms.
So what does electronic kanban change? Only how frequently you can re-measure the average demand and replenishment lead time that go into the formula.
Why paper forces an annual cycle
Changing the card count under paper operations requires physical steps. Print cards for the new count. Recover every card circulating on the floor. Pull the old cards and insert the new ones. Between recovery and replacement, either freeze that part number or run dual control. For some part numbers, dozens of cards are scattered across 3 lines and the warehouse.
Because of that effort, in practice it becomes an annual, all-at-once review. Design it in bulk at the start of the year and leave it alone for the rest. And because it is left alone, the count stays put even when demand shifts mid-year.
With electronic kanban you just change a number on a screen. So you can run it monthly. This is the one and only substantive benefit of electronic kanban, and what it improves is not labour but inventory.
Moving the review cycle to monthly cuts inventory by 11%
In the model case, moving from an annual review to a monthly one is taken to reduce average inventory by 11%. 8,400,000 multiplied by 11% gives THB 924,000 of inventory reduction headroom.
That 11% is an assumption drawn from the model plant’s own results over the previous two years. It is neither an industry average nor a theoretical value. In plants with narrow demand swings it will be smaller, and with strongly seasonal products it can come out larger. To estimate it for yourself, pull twelve months of actual demand by part number and run a desk simulation of what would have happened had you recalculated card counts monthly. That exercise needs no system at all.
Setting inventory holding cost at 18% per year (cost of capital, storage, obsolescence and stocktaking labour combined), 924,000 multiplied by 18% gives THB 166,320 per year of holding cost reduction.
How to set the safety factor, and how to decide the appropriate inventory level in the first place, are two sides of the same coin as card count design. Setting the level itself is covered in managing optimal inventory levels.
Without a review routine, there is little point installing it
Put the other way round, this follows. If you are not going to build a routine that runs the review monthly, there is almost no point installing electronic kanban.
Installing a system does not reduce inventory. Inventory falls only when card counts are recalculated from actual demand data and actually changed. Who does this work, on which day of the month, looking at which data, and who approves the change. Deploy without settling that and the counts designed at the outset sit frozen on screen for a year. Nothing has changed from the paper era.
That is exactly why, in the 90-day roadmap shown later, the plan does not end at day 60 — the day 61 to 75 slot holds “run one card count review”.
Why fixed card counts stopped working in Thailand in 2026
An annual card count design holds up when demand is stable. In Thailand in 2026, that premise has broken.
Thai automotive production for the first half of 2026 totalled 717,212 units, down 1.04% year on year. Viewed as a half-year cumulative figure, that is a decline of only about 1%. The problem is the monthly swing. June production alone was 120,391 units, down 7.55% year on year. May was reported at 114,214 units, down 17.94%. A 1% decline on a half-year cumulative basis, yet double-digit drops in individual months.
That swing pattern is the worst possible case for fixed card counts, because excess and stockout occur at the same time.
In a month where demand falls, the count designed at the start of the year is still circulating, so inventory piles up. Since circulating cards multiplied by container quantity is the ceiling on work in process, the ceiling does not come down just because demand did.
Meanwhile, in a month where demand returns, upstream processes and suppliers have throttled capacity during the downturn, so replenishment lead times stretch. Lead time in the formula has lengthened while the card count has not, so now you stock out.
In other words, when demand swings, the same card count setting creates both excess inventory and stockouts within a single half-year. That is why fixed card counts are particularly ineffective in Thailand in 2026. The value of being able to re-measure monthly is greater in conditions like these than it ever is when demand is stable.
One caveat. A monthly review can only address demand change that is observable at monthly resolution. Variation that spikes in a particular week is absorbed through safety factor or container quantity design, not through card counts. Confuse the two and you end up adjusting card counts every month without stockouts ever falling.

Breaking electronic kanban cost into five layers
Electronic kanban quotations are structured completely differently from vendor to vendor. To make them comparable, break them into five layers.
Layer 1 is licensing. A monthly fee for cloud, or an upfront licence plus annual maintenance for on-premises. Whether pricing is per user, per terminal or per part number changes how the amount scales.
Layer 2 is hardware. Handheld terminals, andon displays, sensors, wireless access points, printers. The trigger source choice moves this layer substantially.
Layer 3 is setup. Master data preparation, initial card count design, screen and form configuration, floor testing. A quotation that makes this look cheap simply pushes the work onto your own staff.
Layer 4 is integration with existing systems. Interfaces to the production management system and the WMS. Item master, inventory sync, production data intake, purchase order handover. This layer does not get cheaper when you narrow the part numbers in scope. Interfaces are priced by the number of counterparties and fields, not by the number of part numbers.
Layer 5 is operation and revision. Labour for running card count reviews, floor training, and in-house effort for support. Most vendors leave this off the quotation, but in reality it recurs every year.
Three-year TCO for an all-part-numbers rollout
Covering all 420 part numbers, the three-year TCO comes out as follows.
| Layer | Content | Three-year total |
|---|---|---|
| Layer 1 licensing | Cloud at THB 18,000 per month for 36 months | THB 648,000 |
| Layer 2 hardware | 8 handhelds at 28,000 plus 4 andon sets at 22,000 | THB 312,000 |
| Layer 3 setup | Master data, card count design, floor testing | THB 480,000 |
| Layer 4 integration | Interfaces to production management system and WMS | THB 350,000 |
| Layer 5 operation and revision | Review routine, training, in-house support, THB 96,000 per year for 3 years | THB 288,000 |
| Total | THB 2,078,000 |
Layer 2 breaks down as handhelds 8 multiplied by 28,000, or THB 224,000, plus andon 4 multiplied by 22,000, or THB 88,000, giving THB 312,000. The total is 648,000 plus 312,000 plus 480,000 plus 350,000 plus 288,000, or THB 2,078,000.
When collecting quotations, lay out on one page what sits in which of these five layers. A comparison table of headline prices alone is almost certainly comparing different things. Layers 3 and 5 in particular occur as your own internal effort whether or not the vendor includes them, so reading a quotation that omits them as “cheaper” will cost you later.
An all-part-numbers rollout does not pay back — the model case numbers
Now build up the benefit side. There are four current-state annual costs.
Current annual costs and what digitization removes
(a) Labour for collecting, sorting and posting kanban cards is, as above, 800 hours and THB 60,000 per year. Changing the trigger source removes 75% of that, or THB 45,000.
(b) Cost arising from lost kanban cards. Cards lost per year came to 74. That is 1,850 multiplied by 4%. Cards get oily, fall under trolleys, get thrown out with the bin, and end up in the post for a different part number. Of those 74, there were 12 cases where parts ran short and an emergency special delivery was dispatched to cope. Cost per case is THB 6,500, comprising THB 4,000 for the emergency delivery and THB 2,500 for the idle time incurred at some processes while waiting for parts. These are cases that stopped short of halting the whole line, so no line stoppage loss is included. Cases that could not be absorbed and did stop the line are counted separately under (d). 12 multiplied by 6,500 gives THB 78,000 per year. With electronic kanban the physical card leaves the trigger path entirely, so the full THB 78,000 is addressable.
(c) Holding cost of excess inventory caused by delayed card count reviews is THB 166,320 per year, as covered in the previous chapter. That is THB 924,000 of inventory reduction headroom multiplied by an 18% holding cost rate.
(d) Line stoppage from stockouts. 9 cases per year, averaging 1.5 hours, at a loss of THB 4,800 per hour of stoppage, gives 9 multiplied by 1.5 multiplied by 4,800, or THB 64,800 per year. After digitization we assume this falls to 4 cases. That figure of 4 is also an assumption we have set. Fewer missing signals means fewer cases, but lost cards are not the only cause of stockouts, so it does not reach zero. 4 multiplied by 1.5 multiplied by 4,800 gives THB 28,800. The saving is 64,800 minus 28,800, or THB 36,000 per year.
| Cost item | Annual benefit |
|---|---|
| Collection and sorting labour (75%, trigger source changed) | THB 45,000 |
| Loss-related cost | THB 78,000 |
| Inventory holding cost | THB 166,320 |
| Line stoppage from stockouts | THB 36,000 |
| Total | THB 325,320 |
45,000 plus 78,000 plus 166,320 plus 36,000 gives THB 325,320 per year.
Note that the THB 78,000 under (b) and the THB 36,000 under (d) count separate events and are not double counted. When parts run short, the outcome splits two ways. Either an emergency special delivery absorbs it, or it cannot be absorbed and the line stops. The 12 cases under (b) are the former, contained within special delivery cost and idle time at some processes. The 9 cases under (d) are the latter, meaning the line actually stopped. Broken down by cause, 5 of those 9 came from lost cards or missing signals, and 4 came from supplier delays, sudden add-ons due to quality defects, or demand spikes. Electronic kanban removes only the former 5; the latter 4 have different causes and do not fall. The assumption of 4 cases after digitization is set on the basis that all 5 are resolved. As noted, that framing is itself an assumption. When calculating for your own plant, count cases absorbed by special delivery separately from cases where the line stopped, then classify the latter by cause before applying this.
Set cost against benefit over three years and it does not pay back
Now set cost against benefit over three years.
Three-year benefit is 325,320 multiplied by 3, or THB 975,960. Three-year TCO is THB 2,078,000. The benefit does not reach even half the TCO.
An all-part-numbers electronic kanban rollout does not pay back within three years.
Do not delete that conclusion from your proposal. The reason so many evaluations push past this point instead of stopping is that unmonetized items — visibility, improved traceability, reduced dependence on individuals — get added to the benefit side. We are not saying those have no value. But add unmonetizable items and the resulting payback period cannot be verified. Make an investment decision on a number nobody can verify, and you will have no answer when somebody says after go-live that the benefit never materialized.
Once you know it does not pay back, there are two options. Stop, or narrow the scope. The next chapters look at narrowing.
Payback on profit and loss and payback on cash are different things
Let us state the conclusion for narrowing to the top 15% of part numbers first. The narrowing procedure comes in the following chapter.
The target is the top 15% by movement speed and card count, or 63 part numbers. Those 63 account for 60% of the card count (1,110 cards), 72% of inventory value (THB 6,048,000), and 85% of losses and stockouts.
Three-year TCO for the narrowed scope
| Layer | Three-year total |
|---|---|
| Layer 1 licensing, THB 7,500 per month for 36 months | THB 270,000 |
| Layer 2 hardware, 4 handhelds 112,000 plus 2 andon sets 44,000 | THB 156,000 |
| Layer 3 setup | THB 220,000 |
| Layer 4 integration (fixed cost that narrowing does not reduce) | THB 350,000 |
| Layer 5 operation and revision, THB 60,000 per year for 3 years | THB 180,000 |
| Total | THB 1,176,000 |
270,000 plus 156,000 plus 220,000 plus 350,000 plus 180,000 gives THB 1,176,000. Layer 2 is handhelds 4 multiplied by 28,000, or THB 112,000, plus andon 2 multiplied by 22,000, or THB 44,000.
Look at layer 4. It stays at THB 350,000 whether the rollout covers everything or a narrowed set. Interfaces to the production management system and the WMS are priced by the number of fields connected, so the cost is identical at 420 part numbers or 63. Narrowing reduces layers 1, 2, 3 and 5 only; layer 4 remains as a fixed cost. This is the structural point most often missed in electronic kanban investment decisions.
Benefit for the narrowed scope
Benefits are prorated by the coverage ratios.
| Cost item | Calculation | Annual benefit |
|---|---|---|
| Collection and sorting labour | 45,000 multiplied by 70% | THB 31,500 |
| Loss-related | 78,000 multiplied by 85% | THB 66,300 |
| Inventory holding | 166,320 multiplied by 72% | THB 119,750 |
| Line stoppage from stockouts | 36,000 multiplied by 85% | THB 30,600 |
| Total | THB 248,150 |
The THB 119,750 for inventory holding is 166,320 multiplied by 0.72, or 119,750.4, with the fraction rounded. The total is 31,500 plus 66,300 plus 119,750 plus 30,600, or THB 248,150 per year.
Labour alone is prorated at 70% rather than 60% because, while the card count share is 60%, faster-moving part numbers consume proportionally more of the material handler’s time. This is another figure to replace with your own measurements.
On profit and loss, payback is 7.4 years
Initial investment is the sum of layers 2 through 4. 156,000 plus 220,000 plus 350,000 gives THB 726,000.
Annual running cost is licensing at 270,000 divided by 3, or THB 90,000, plus operation and revision at THB 60,000, for a total of THB 150,000.
Annual net benefit is 248,150 minus 150,000, or THB 98,150.
Payback is 726,000 divided by 98,150, or 7.4 years.
7.4 years. In companies whose capital investment hurdle is 3 or 5 years, it is rejected at this point. Even narrowed, it is an investment that does not clear a profit-and-loss test.
On cash, it is all but offset in year one
Switch to a cash view, however, and the picture changes.
Inventory reduction is 6,048,000 multiplied by 11%, or THB 665,280. The critical point is that this THB 665,280 is not a cost reduction on the profit and loss statement but a release of working capital. Cash that was sitting in inventory comes back to hand, once.
What shows up in profit and loss is only the holding cost portion of THB 119,750, but the cash movement is THB 665,280.
Against an initial investment of THB 726,000, THB 665,280 returns from inventory in year one. The difference is 726,000 minus 665,280, or THB 60,720. In other words, on a cash basis this investment is all but offset in the first year.
| View | Investment | Year one recovery | Conclusion |
|---|---|---|---|
| Profit and loss | THB 726,000 | Annual net benefit THB 98,150 | 7.4 years to payback |
| Cash | THB 726,000 | Release from inventory THB 665,280 | All but offset, difference of THB 60,720 |
The same investment is either 7.4 years or one year depending purely on the lens. Both are correct and neither is a lie. Whether you can present these two views separately is what decides whether the internal capital approval goes through. Present only one and you will be challenged. Show only profit and loss and it ends at “7.4 years is too long”. Show only cash and it ends at “that is a one-off, though”. Setting both side by side, and distinguishing the one-off release from the recurring cost reduction, is the correct way to present it.
But the inventory reduction does not happen by itself
Here is the caveat this article most wants to emphasize.
The THB 665,280 inventory reduction does not happen just because a system is installed. It is the result of shortening the review cycle from annual to monthly; electronic kanban only made that work possible. Pull actual demand data monthly, recalculate card counts, and actually change them. Inventory falls only once that routine is running.
So if you present the cash view in a capital request, you must simultaneously write down who performs this every month. The named person, the hours, and the approval flow. A cash view without that is a number built on a premise that will not be met. The THB 60,000 per year in layer 5 is booked precisely as the effort for this work.
How to narrow the part numbers — selecting the top 15%
The figure of 15% has no significance in itself. What matters is what you rank by to take the top.
Rank on three axes
The first axis is card count. Part numbers with more cards consume more collection, sorting and posting labour. More cards also means cards are more widely scattered, so losses are higher too. In the model case, the top 63 part numbers accounted for 60% of the card count, or 1,110 cards.
The second axis is inventory value. Inventory reduction benefit is proportional to value. High unit price items, or fast-turning items always held in quantity, rise on this axis. The top 63 accounted for 72% of inventory value, or THB 6,048,000.
The third axis is actual losses and stockouts. Cards actually lost over the last twelve months, and stockouts actually incurred. This is the most important axis, and the top 63 accounted for 85% of losses and stockouts.
Take the part numbers where all three axes overlap
The important thing is that these three axes overlap cleanly. Fast-moving, high card count, high inventory value, and prone to both losses and stockouts. It is obvious once stated — the more frequently something moves, the more incidents it generates.
So narrowing is not difficult. Using twelve months of data, build four columns by part number for card count, inventory value, loss incidents and stockout incidents, rank each column, and sort by the sum of ranks ascending. Take the top 60 to 70 part numbers and you will have the same structure as the model case.
| Axis | Share held by the top 63 part numbers | How it drives benefit |
|---|---|---|
| Card count | 60% | Collection and sorting labour |
| Inventory value | 72% | Inventory holding cost |
| Losses and stockouts | 85% | Loss-related cost, line stoppage |
The side effects of narrowing
Narrowing means paper and electronic coexist. 63 part numbers electronic, the remaining 357 on paper. The floor will invariably say this is confusing.
The practical answer is to separate the two physically. Give electronic part numbers their own return racks, remove the posts, change the bin colour or the label colour. Mixing paper and electronic on the same rack causes confusion, but if the racks themselves are separate, operations hold up. Conversely, separating part numbers logically without separating the physical storage locations guarantees incidents.
The other side effect is that measuring benefit becomes harder. Look at total inventory value and the effect on the 63 target part numbers is buried in the movement of the other 357. Before deployment, carve out and record inventory value for the target part numbers only. Skip that and 90 days later the conclusion will be that nobody can tell whether it worked.
How to deploy — running one full loop in 90 days
The most common failure in electronic kanban deployment is stopping at the point where the system works. Build the 90-day roadmap so that “run one card count review” occupies the second-to-last slot.
| Period | What to do | Completion criteria |
|---|---|---|
| Days 1 to 15 | Count actual card counts and losses | Card count by part number and the last twelve months of loss and stockout incidents exist as tables |
| Days 16 to 30 | Narrow the target part numbers (top 15%) | The list of 63 target part numbers is fixed and its share of inventory value is calculated |
| Days 31 to 45 | Decide boundaries A, B and C | The three boundary choices and the reasoning fit on one page |
| Days 46 to 60 | Trial on one line | On the target line the signal fires and the goods arrive |
| Days 61 to 75 | Run one card count review | Card counts recalculated from actual demand data, with a record of the changes actually made |
| Days 76 to 90 | Decide on horizontal deployment | Change in inventory value is measured and the investment decision for the next line can be made |
The key point in this roadmap is that days 61 to 75 hold “run one card count review”. A deployment that never passes through this stops at a system that is installed but produces no benefit.
In most project plans, the day 46 to 60 trial on one line is the final stage. The signal fired, the goods arrived, it works, project complete. In that form, not one baht of the THB 665,280 inventory reduction is realized. Working and delivering are different things.
The other key point is that the first 15 days are only about counting. Product selection and vendor enquiries are not in those 15 days. Card counts by part number, and loss and stockout incidents over the last twelve months. Building those two tables needs no system. And if you collect quotations without them, vendors will quote on an all-part-numbers basis. That is what THB 2,078,000 really is.
What to look at in the day 76 to 90 horizontal deployment decision is the change in inventory value for the 63 target part numbers. A single review will not deliver the whole 11%, but direction and magnitude become visible. If it comes out smaller than expected, the cause is either the data used to recalculate card counts or a failure to land the changes on the floor. Close out both before deploying further.
Five common failures
1. Digitizing the card without changing the trigger source
The most common failure. 2D codes printed on the cards, scanned with a handheld. Operations look new, but collection labour merely became scanning labour, and only THB 18,000 of the THB 60,000 disappeared. Missed scans still cause missing signals, so the THB 78,000 of loss-related cost barely falls. Lock boundary B on “a person presses” as the end state and this is the result.
2. Putting every part number in scope at once
The THB 350,000 layer 4 integration cost does not change when scope narrows. Layer 1 licensing and layer 3 setup, however, grow as part numbers increase. They do not grow proportionally, though. In the model case, cutting part numbers from 420 to 63, or 15%, moved licensing only from THB 18,000 to THB 7,500 per month, and setup from THB 480,000 to THB 220,000 — less than half in both cases. At 420 part numbers, TCO is THB 2,078,000 against a three-year benefit of THB 975,960. At 63 part numbers, TCO is THB 1,176,000 against a three-year benefit of THB 744,450 (248,150 multiplied by 3). Neither pays back on profit and loss, but bringing the absolute initial investment down to THB 726,000 puts it within reach of the THB 665,280 released from inventory. Do it all at once and that balance no longer holds.
3. Not deciding the card count review routine
This throws away the one part of electronic kanban that works. Who, on which day of the month, looking at which data, with whose approval, changes the card counts. Without that, the counts designed at the outset sit frozen for a year. The THB 119,750 of inventory holding cost reduction in the narrowed case, and the THB 665,280 released from inventory, come from this routine and nowhere else.
4. Including external parties from the start
Put suppliers into the first phase and layer 4 spikes, dragged along by what each counterparty can receive. With Japanese-owned tier 1 suppliers you can ride the JAMA and JAPIA standards, but once Thai local suppliers are in the mix you end up building two parallel channels, standard EDI and web form. Do that before internal operations have settled and every specification change triggers renegotiation with outside parties.
5. Choosing reorder point control without checking inventory accuracy
When book inventory diverges from physical inventory, reorder point control misfires. Stock is recorded as present so no signal fires, or recorded as absent so unnecessary replenishment runs. Choose this approach in a plant with chronic stock count discrepancies and line stoppages from stockouts rise instead of falling from 9 cases to 4. Before choosing reorder point control, measure the stock count discrepancy rate for the target part numbers.
Frequently asked questions
What is an electronic kanban system?
It is a mechanism that emits the replenishment signal previously carried by a paper kanban card electronically rather than on card stock. Push buttons, sensors, production reporting and inventory thresholds become the source of the signal, and requests arrive on screens, andon displays or mobile devices. What is worth noting is that a paper kanban card also carries two other functions alongside the replenishment signal — physical identification and the flow record. Only the first is genuinely improved by electronic kanban; the other two are often served adequately by existing barcodes, RFID or the inventory management system.
How does systemizing kanban differ from deploying a production management system?
They answer different questions. A production management system answers the planning question of what to make, when, and how many. Systemizing kanban answers the replenishment trigger question of whether to have the next lot made or moved, right now. Plans are set in advance while kanban is pulled by actual consumption on the floor, so the time axis and the information source both differ. The two are not competitors — kanban runs day-to-day replenishment inside the frame the production management system has planned. So “we installed a production management system, therefore kanban is unnecessary” does not hold, and neither does the reverse.
How much does an electronic kanban system cost?
It varies greatly with the number of part numbers in scope and whether external parties are included. In the model case, covering all 420 part numbers gave a three-year TCO of THB 2,078,000, while narrowing to the top 15%, or 63 part numbers, gave THB 1,176,000. The breakdown splits into five layers — licensing, hardware, setup, integration with existing systems, and operation and revision. When comparing quotations, align what sits in which of those five layers. Integration in particular is a fixed cost that stays at THB 350,000 even when part numbers are narrowed, so if a narrowed-scope quotation claims integration cost falls proportionally, ask for the basis.
Should we choose a reorder point system or an electronic kanban system?
They are not in opposition. Reorder point control is one of the four trigger sources you can choose within an electronic kanban system. The deciding factor is inventory accuracy — for items where book and physical inventory agree, the reorder point approach gives the lightest operations. For items with large stock count discrepancies it misfires, so you choose a physical or actual-event trigger such as empty bin return or production reporting. Since the approach can differ by part number, there is no need to settle on one for the whole company.
How far can we rely on it as a stockout prevention system?
In the model case, 9 line stoppages a year from stockouts are assumed to fall to 4. That figure of 4 is an assumption we have set. Stockouts caused by lost cards or missing signals do fall, but stockouts caused by supplier delays, sudden add-ons due to quality defects, or demand spikes do not fall with electronic kanban. It is more practical to understand it not as a system that drives stockouts to zero, but as a mechanism that eliminates one cause, the missing signal. Classify the last twelve months of stockouts by cause and count how many came from missing signals, and you have your own expected value.
Can we keep paper kanban and digitize only part of it?
That is fine. In fact it is the recommended approach. An all-part-numbers rollout does not stand up on profit and loss, at a three-year TCO of THB 2,078,000 against a three-year benefit of THB 975,960, so you will end up narrowing to roughly the top 15%. In that case the remaining part numbers continue on paper. There is only one precaution for coexistence — separate electronic and paper physically. Split the return racks, remove the posts, change the bin or label colours. Mix them on the same rack and incidents are guaranteed.
Can we connect Thai local suppliers to electronic kanban too?
Yes, but standard EDI is not realistic. Between Japanese-owned tier 1 suppliers you can ride the JAMA and JAPIA EDI standards, but Thai local suppliers are often not on those standards and typically have neither an EDI line nor a receiving system. The practical answer is a web form opened in a smartphone browser plus QR code scanning. Build it so the counterparty needs no dedicated terminal and no EDI line, and they can start with close to zero additional investment. Even so, leave external parties to phase two and run one full internal cycle first.
Summary
A paper kanban card bundles three functions onto one piece of card stock — the replenishment signal, physical identification and the flow record. Only the first is genuinely improved by electronic kanban; the rest are often served adequately by existing mechanisms. And yet most plants start from the second by barcoding the cards, which ends with collection labour turning into scanning labour. Of the THB 60,000 per year in labour, digitizing the card removes 30%, or THB 18,000. Only changing the trigger source itself removes 75%, or THB 45,000.
What you decide is not a product but three boundaries. As a rule, keep scope internal — include outside parties and layer 4 integration cost spikes. The trigger source determines roughly 80% of the benefit, and you choose among four approaches based on inventory accuracy and how fast the goods move. For grain, per milk run is realistic in Thai two-shift operations, with information lag of up to about one hour relative to event-by-event sync.
The kanban card count formula does not change by one character when you digitize. Only the review cycle changes, from annual to monthly. That is the single substantive benefit, and what it improves is not labour but inventory. Thai automotive production in the first half of 2026 was 717,212 units, down 1.04% year on year, with June alone at 120,391 units, down 7.55%, and May at 114,214 units, down 17.94%. A 1% decline on a half-year cumulative basis, yet double-digit drops in individual months. In these conditions, a fixed card count creates excess inventory and stockouts at the same time.
Then the numbers. All at once, a three-year TCO of THB 2,078,000 against a three-year benefit of THB 975,960 — it does not pay back. Narrow to the top 15%, or 63 part numbers, and TCO is THB 1,176,000 with an annual benefit of THB 248,150. Even so, payback on profit and loss is 726,000 divided by 98,150, or 7.4 years. But the THB 665,280 inventory reduction is a release of working capital, so on a cash basis it all but offsets the THB 726,000 initial investment in year one, leaving a difference of THB 60,720. The same investment reads as 7.4 years on profit and loss and as year one on cash. Whether you can present these two views separately decides whether the capital approval goes through.
The inventory reduction, however, does not happen just because a system is installed. It appears only once a routine is running that recalculates card counts monthly from actual demand data and actually changes them. That is why the second-to-last slot in the 90-day roadmap holds “run one card count review”. A deployment that never passes through it stops in a state where the system works but delivers nothing.
Where to turn while you are still evaluating
Evaluating electronic kanban starts not with choosing a product but with counting. How many kanban cards exist per part number. How many were lost over the last twelve months, and how many of those turned into stockouts. Building those two tables needs no system, and no outside help.
In practice, though, plenty of plants start collecting quotations without those two tables in hand. Ask a vendor in that state and, naturally, an all-part-numbers quotation comes back. Not sure how to count. Not sure which axes to rank on. Wanting to check how the profit-and-loss view and the cash view look with your own numbers in place. We take enquiries at exactly that stage as a matter of routine, and it is entirely fine to stop at counting the actual figures, before deciding whether to deploy at all. Do get in touch through our contact page while you are still evaluating.
References
- Japan Auto Parts Industries Association (JAPIA), EDI Committee (Industry initiatives and related materials on EDI standards for the automotive parts sector)
- JAMA and JAPIA Standard Forms Guideline (Japan Automobile Manufacturers Association. Scope covers delivery slips, kanban included, and electronic tags)
- Bangkok minimum wage raised to 400 baht per day (Thailand) (JETRO Business Brief, 4 July 2025. Reports that the Bangkok minimum wage was raised to 400 baht per day effective 1 July 2025, and that four provinces and one district with a heavy concentration of manufacturing, including Chonburi and Rayong, had already moved to 400 baht in January 2025)
- Thailand’s auto production falls 7.55 pct in June (Xinhua, 24 July 2026. June production of 120,391 units, down 7.55% year on year, with first-half cumulative production of 717,212 units, down 1.04%)
- Thailand Vehicle Production Falls 17.94% to 114,214 Units in May 2026 (M Report. May production volume and year-on-year change)
- Automotive sector posts downturn in first 5 months (Bangkok Post. Automotive industry trends from January to May 2026)


